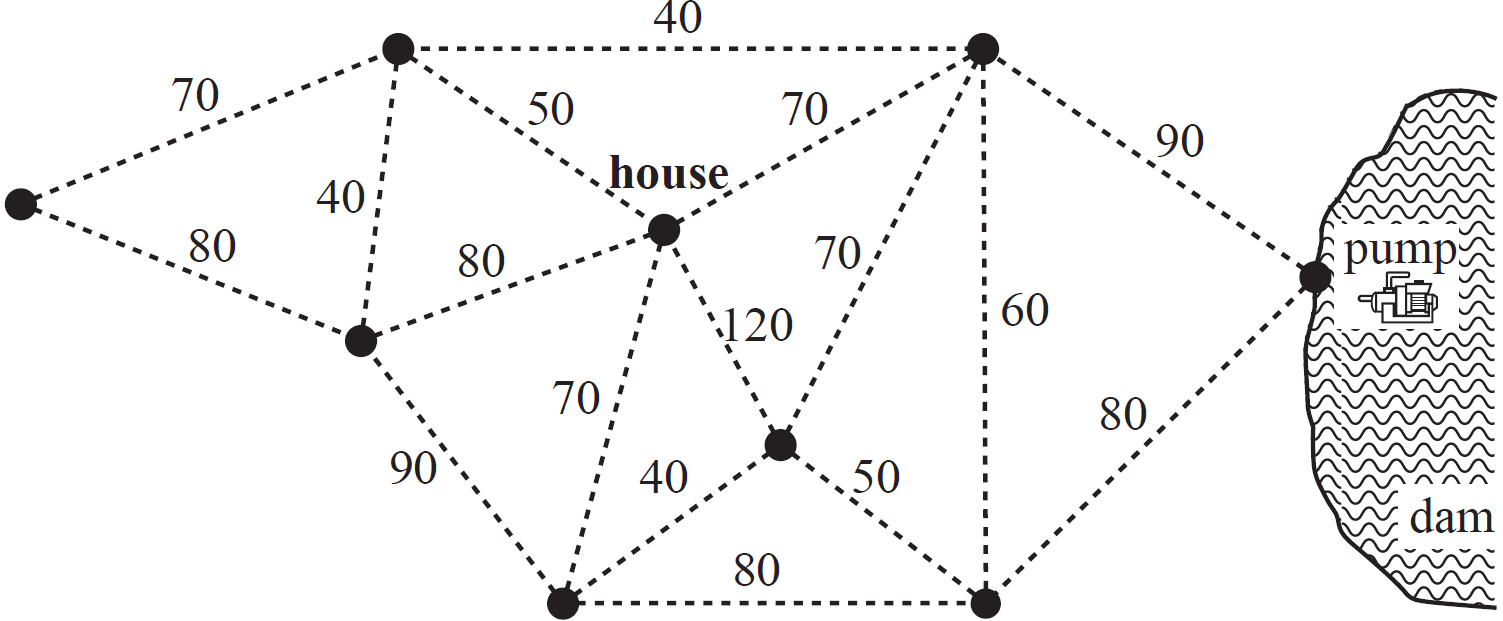
The network shows the distances, in kilometres, along a series of roads that connect towns.

What is the value of the largest weighted edge included in the minimum spanning tree for this network?
- 7
- 8
- 9
- 10
Show Worked Solution
\(\text{Minimum spanning tree:}\)

\(\text{Using Kruskal’s algorithm:}\)
\(\text{Edge 1 = 4, Edge 2/3 = 5, Edge 4 = 6, Edge 5 = 9}\)
\(\therefore\ \text{The largest weighted edge in the MST = 9.}\)
\(\Rightarrow C\)
♦♦ Mean mark 33%.