Let `f: (1/3, oo) -> R,\ \ f(x) = 1/(3x-1)`.
Find `f ^{′}(x)`. (1 mark)
Aussie Maths & Science Teachers: Save your time with SmarterEd
Let `f: (1/3, oo) -> R,\ \ f(x) = 1/(3x-1)`.
Find `f ^{′}(x)`. (1 mark)
The spread of a highly contagious virus can be modelled by the function
`f(x) = 8000/(1 + 1000e^(-0.12x))`
Where `x` is the number of days after the first case of sickness due to the virus is diagnosed and `f(x)` is the total number of people who are infected by the virus in the first `x` days.
--- 1 WORK AREA LINES (style=lined) ---
--- 5 WORK AREA LINES (style=lined) ---
Differentiate with respect to `x`:
`10^(5x^2 - 3x)`. (2 marks)
Differentiate `log_2 x^2` with respect to `x`. (2 marks)
Consider the vector `underset~a = underset~i + sqrt3underset~j`, where `underset~i` and `underset~j` are unit vectors in the positive direction of the `x` and `y` axes respectively.
--- 2 WORK AREA LINES (style=lined) ---
--- 6 WORK AREA LINES (style=lined) ---
Given that `underset~b` is perpendicular to `underset~a`, find the value of `underset~m`. (1 mark)
--- 4 WORK AREA LINES (style=lined) ---
Consider the following vectors
`overset(->)(OA) = 2underset~i + 2underset~j,\ \ overset(->)(OB) = 3underset~i - underset~j,\ \ overset(->)(OC) = 5underset~i + 3underset~j`
--- 3 WORK AREA LINES (style=lined) ---
--- 3 WORK AREA LINES (style=lined) ---
--- 3 WORK AREA LINES (style=lined) ---
The vectors `underset~a = 2underset~i + m underset~j` and `underset~b = m^2underset~i-underset~j` are perpendicular for
Consider the vectors
`underset~a = 6underset~i + 2underset~j,\ \ underset~b = 2underset~i - m underset~j`
--- 2 WORK AREA LINES (style=lined) ---
--- 5 WORK AREA LINES (style=lined) ---
--- 2 WORK AREA LINES (style=lined) ---
Find the projection of `underset~a` onto `underset~b` given `underset~a = 2underset~i + underset~j` and `b = 3underset~i - 2underset~j`. (2 marks)
In the quadrilateral `PQRS`, `T` lies on `SR` such that `ST : TR = 3 : 1`.

--- 2 WORK AREA LINES (style=lined) ---
--- 2 WORK AREA LINES (style=lined) ---
--- 5 WORK AREA LINES (style=lined) ---
Show that `I_n = 1/(2(n - 1)) - n/(n - 1) I_(n - 1)\ \ text(for)\ \ n >= 2`. (3 marks)
--- 7 WORK AREA LINES (style=lined) ---
--- 6 WORK AREA LINES (style=lined) ---
--- 6 WORK AREA LINES (style=lined) ---
`sum_(r = 1)^n\ text(cosec)(2^r x) = cot x - cot(2^n x)`. (2 marks)
--- 8 WORK AREA LINES (style=lined) ---
A parachutist jumps from a plane, falls freely for a short time and then opens the parachute. Let t be the time in seconds after the parachute opens, `x(t)` be the distance in metres travelled after the parachute opens, and `v(t)` be the velocity of the parachutist in `text(ms)^(-1)`.
The acceleration of the parachutist after the parachute opens is given by
`ddot x = g - kv,`
where `g\ text(ms)^(-2)` is the acceleration due to gravity and `k` is a positive constant.
Show that `w = g/k`. (1 mark)
--- 2 WORK AREA LINES (style=lined) ---
At the time the parachute opens, the speed of descent is `1.6 w\ text(ms)^(-1)`.
--- 10 WORK AREA LINES (style=lined) ---
Show that `D = g/k^2 (1/2 + log_e 6)`. (3 marks)
--- 8 WORK AREA LINES (style=lined) ---
Two objects are projected from the same point on a horizontal surface. Object 1 is projected with an initial velocity of `20\ text(ms)^(-1)` directed at an angle of `pi/3` to the horizontal. Object 2 is projected 2 seconds later.
The equations of motion of an object projected from the origin with initial velocity `v` at an angle `theta` to the `x`-axis are
`x = vt cos theta`
`y = -4.9t^2 + vt sin theta`,
where `t` is the time after the projection of the object. Do NOT prove these equations.
--- 8 WORK AREA LINES (style=lined) ---
Find the initial speed and the angle of projection of Object 2, giving your answer correct to 1 decimal place. (3 marks)
--- 10 WORK AREA LINES (style=lined) ---
a. `text(Object 1:)`

| `x` | `= 20t cos\ pi/3` |
| `= 10t` | |
| `y` | `= -4.9t^2 + 20t sin\ pi/3` |
| `= -4.9t^2 + 10 sqrt 3 t` |
`text(Let)\ \ t_1 = text{time of flight (Object 1)}`
| `-4.9t_1^2 + 10 sqrt 3 t_1` | `= 0` |
| `t_1(-4.9t_1 + 10 sqrt 3)` | `= 0` |
| `4.9t_1` | `= 10 sqrt 3\ \ (t >= 0)` |
| `t_1` | `= (10 sqrt 3)/4.9` |
`text(Find)\ \ x\ \ text(when)\ \ t_1 = (10 sqrt 3)/4.9:`
| `x` | `= 10 xx (10 sqrt 3)/4.9` |
| `= (100 sqrt 3)/4.9\ text(… as required)` |
(ii) `text{Time of flight (Object 2)}= (10 sqrt 3)/4.9 – 2`♦ Mean mark 42%.
| `text(Range)` | `= (100 sqrt 3)/4.9` |
| `(100 sqrt 3)/4.9` | `= v((10 sqrt 3)/4.9 – 2) cos theta` |
| `v cos theta` | `= (100 sqrt 3)/4.9 xx 4.9/(10 sqrt 3 – 9.8)` |
| `v cos theta` | `= (100 sqrt 3)/(10 sqrt 3 – 9.8) \ \ \ …\ (1)` |
| `0` | `= -4.9t^2 + vt sin theta` |
| `0` | `= -4.9 xx ((10 sqrt 3)/4.9 – 2)^2 + v((10 sqrt 3)/4.9 – 2) sin theta` |
| `0` | `= -4.9((10 sqrt 3 – 9.8)/4.9) + v sin theta` |
| `v sin theta` | `= 10 sqrt 3 – 9.8 \ \ \ …\ (2)` |
`(2) ÷ (1)`
| `tan theta` | `= (10 sqrt 3 – 9.8) xx (10 sqrt 3 – 9.8)/(100 sqrt 3)` |
| `= 0.3265…` | |
| `:. theta` | `= 18.1^@\ text{(1 d.p.)}` |
`text{Substitute into (2)}`
| `:.v` | `= (10 sqrt 3 – 9.8) /(sin 18.1^@)` |
| `= 24.206` | |
| `= 24.2\ text(ms)^(-1)\ text{(1 d.p.)}` |
Consider the function `f(x) = x^3 - 1`.
--- 8 WORK AREA LINES (style=lined) ---
--- 10 WORK AREA LINES (style=lined) ---
--- 10 WORK AREA LINES (style=lined) ---
i. `y = |\ x^3 – 1\ |`

ii. `y = 1/(x^3 – 1)`

iii. `y = x/(x^3 – 1)`

The diagram shows two straight railway tracks that meet at an angle of `(2 pi)/3` at the point `P`.
Trains `A` and `B` are joined by a cable which is 70 m long.
At time `t` seconds, train `A` is `x` metres from `P` and train `B` is `y` metres from `P`.
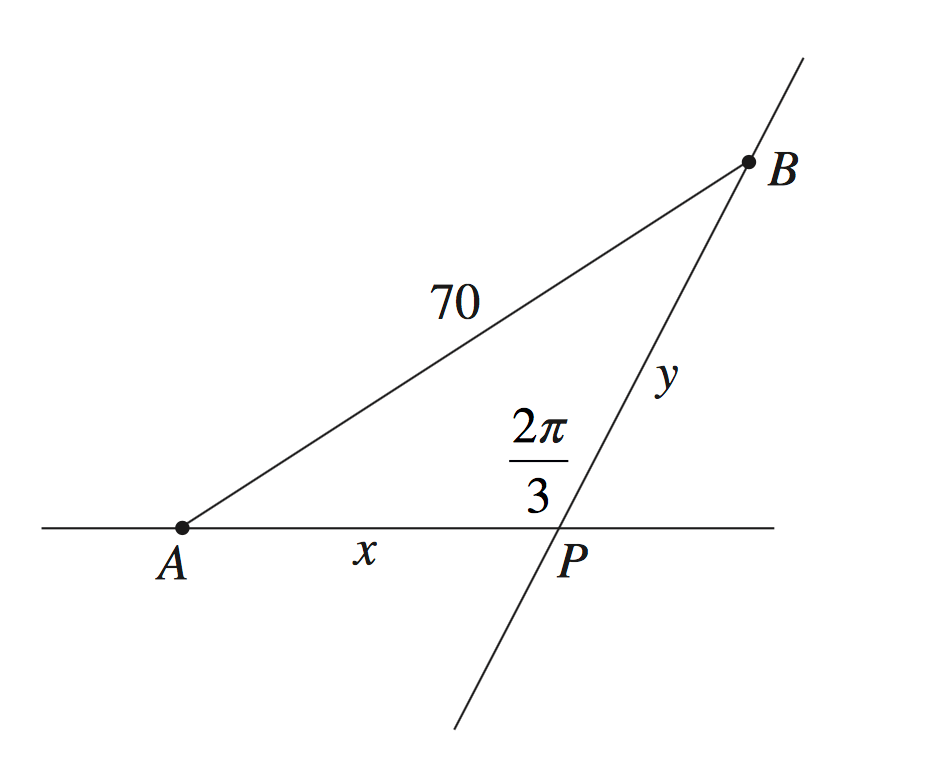
Train `B` is towing train `A` and is moving at a constant speed of `4\ text(ms)^(-1)` away from `P`.
Let `z = -1 + i sqrt 3`.
--- 4 WORK AREA LINES (style=lined) ---
--- 3 WORK AREA LINES (style=lined) ---
Find `int (dx)/(x^2 + 10x + 29)` (2 marks)
Which expression is equal to `int x cos x\ dx`?
A bank offers two different savings accounts.
Account `X` offers simple interest of 7% per annum.
Account `Y` offers compound interest of 6% per annum compounded yearly.
The table displays the future values of $20 000 invested in each account for the first 2 years.

--- 2 WORK AREA LINES (style=lined) ---
--- 6 WORK AREA LINES (style=lined) ---
Five rabbits were introduced onto a farm at the start of 2018. At the start of 2019 there were 10 rabbits on the farm. It is predicted that the number of rabbits on the farm will continue to double each year.


--- 2 WORK AREA LINES (style=lined) ---


| a. | |
| b. | |
♦ Mean mark part (c) 25%.
c. `text(Exponential model – the graph isn’t a straight line.)`
`text(The number of rabbits grow at an increasing rate.)`
The plan of the lower level of a small house is shown.

--- 1 WORK AREA LINES (style=lined) ---
--- 4 WORK AREA LINES (style=lined) ---
Prove by mathematical induction that, for all integers `n >= 1`,
`1(1!) + 2(2!) + 3(3!) + … + n(n!) = (n + 1)! - 1`. (3 marks)
--- 14 WORK AREA LINES (style=lined) ---
A survey question is shown.

Give ONE reason why this survey may be considered to be poorly designed. (1 mark)
When blood pressure is measured, two numbers are recorded: systolic pressure and diastolic pressure. If the measurements recorded are 130 systolic and 85 diastolic, then the blood pressure is written as '130 over 85'.
The bars on the graph indicate the healthy ranges of blood pressure for people of various ages.

Which person has both blood pressure measurements in the healthy range for their age?
Which compass bearing is the same as a true bearing of 110°?

`110° =\ text(S70°E)`
`=> C`
Sugar is sold in four different sized packets.
Which is the best buy?
A refrigerator has a constant temperature of 3°C. A can of drink with temperature 30°C is placed in the refrigerator.
After being in the refrigerator for 15 minutes, the temperature of the can of drink is 28°C.
The change in the temperature of the can of drink can be modelled by `(dT)/(dt) = k(T - 3)`, where `T` is the temperature of the can of drink, `t` is the time in minutes after the can is placed in the refrigerator and `k` is a constant.
`qquad(dT)/(dt) = k(T - 3)`. (1 mark)
--- 2 WORK AREA LINES (style=lined) ---
--- 10 WORK AREA LINES (style=lined) ---
Distance `A` is inversely proportional to distance `B`, such that `A = 9/B` where `A` and `B` are measured in metres. The two distances vary with respect to time. Distance `B` is increasing at a rate of `0.2\ text(ms)^(-1)`.
What is the value of `(dA)/(dt)` when `A = 12`? (3 marks)
--- 6 WORK AREA LINES (style=lined) ---
Prize-winning symbols are printed on 5% of ice-cream sticks. The ice-creams are randomly packed into boxes of 8.
--- 2 WORK AREA LINES (style=lined) ---
--- 3 WORK AREA LINES (style=lined) ---
Find `int 2 sin^2 4x\ dx`. (2 marks)
Find the polynomial `Q(x)` that satisfies `x^3 + 2x^2-3x-7 = (x-2) Q(x) + 3`. (2 marks)
--- 6 WORK AREA LINES (style=lined) ---
| `(x-2) ⋅ Q(x) + 3` | `= x^3 + 2x^2-3x-7` |
| `(x-2) ⋅ Q(x)` | `= x^3 + 2x^2-3x-10` |

`:. Q(x ) = x^2 + 4x + 5`
For what values of `x` is `x/(x + 1) < 2`? (3 marks)
--- 6 WORK AREA LINES (style=lined) ---
`x/(x + 1) < 2`
`text(Multiply b.s. by)\ \ (x + 1)^2`
| `x(x + 1)` | `< 2(x + 1)^2` |
| `x^2 + x` | `< 2x^2 + 4x + 2` |
| `0` | `< x^2 + 3x + 2` |
| `0` | `< (x + 2)(x + 1)` |

`text(From graph:)`
`x < -2 or x > -1`
′
The diagram shows the graph of `y = f(x)`.

Which equation best describes the graph?
A. `y = x/(x^2 - 1)`
B. `y = x^2/(x^2 - 1)`
C. `y = x/(1 - x^2)`
D. `y = x^2/(1 - x^2)`
What is the domain of the function `f(x) = ln(4-x)`?
A small business makes and sells bird houses.
Technology was used to draw straight-line graphs to represent the cost of making the bird houses `(C)` and the revenue from selling bird houses `(R)`. The `x`-axis displays the number of bird houses and the `y`-axis displays the cost/revenue in dollars.

--- 1 WORK AREA LINES (style=lined) ---
--- 6 WORK AREA LINES (style=lined) ---
The time taken for a car to travel between two towns at a constant speed varies inversely with its speed.
It takes 1.5 hours for the car to travel between the two towns at a constant speed of 80 km/h.
--- 1 WORK AREA LINES (style=lined) ---

--- 0 WORK AREA LINES (style=lined) ---

| a. | `D` | `= S xx T` |
| `= 80 xx 1.5` | ||
| `= 120\ text(km)` |
b.
\begin{array} {|c|c|c|c|c|}
\hline
\rule{0pt}{2.5ex} \ \ s\ \ \rule[-1ex]{0pt}{0pt} & 20 & 40 & 60 & 80 \\
\hline
\rule{0pt}{2.5ex} t \rule[-1ex]{0pt}{0pt} & 6 & 3 & 2 & 1.5 \\
\hline
\end{array}
The derivative of a function `y = f(x)` is given by `f^{′}(x) = 3x^2 + 2x-1`.
--- 6 WORK AREA LINES (style=lined) ---
Find an expression for `f(x)`. (2 marks)
--- 4 WORK AREA LINES (style=lined) ---
--- 8 WORK AREA LINES (style=lined) ---
--- 2 WORK AREA LINES (style=lined) ---
a. `f^{′}(x) = 3x^2 + 2x-1`
`f^{″}(x) = 6x + 2`
`text(S.P.’s when)\ \ f^{′}(x) = 0`
| `3x^2 + 2x-1` | `= 0` |
| `(3x-1)(x + 1)` | `= 0` |
`x = 1/3 or -1`
`text(When)\ x = 1/3,`
`f^{″}(x) = 4 > 0 =>\ text(MIN)`
`text(When)\ x = -1,`
`f^{″}(x)= -4 < 0 =>\ text(MAX)`
| b. | `f(x)` | `= int f^{′}(x)\ dx` |
| `= int 3x^2 + 2x-1\ dx` | ||
| `= x^3 + x^2-x + c` |
`(0, 4)\ \ text(lies on)\ \ f(x)\ \ =>\ \ c = 4`
`:. f(x) = x^3 + x^2-x + 4`
| c. | `text(When)\ \ x = -1,\ \ y = 5` |
| `text(When)\ \ x = 1/3,\ \ y = 103/27` |

d. `text(Concave down when)\ f^{″}(x) < 0`♦ Mean mark 36%.
| `6x + 2` | `< 0` |
| `6x` | `< -2` |
| `x` | `< -1/3` |
--- 4 WORK AREA LINES (style=lined) ---
--- 2 WORK AREA LINES (style=lined) ---
The number of leaves, `L(t)`, on a tree `t` days after the start of autumn can be modelled by
`L(t) = 200\ 000e^(-0.14t)`
--- 2 WORK AREA LINES (style=lined) ---
--- 5 WORK AREA LINES (style=lined) ---
--- 6 WORK AREA LINES (style=lined) ---
In an arithmetic series, the fourth term is 6 and the sum of the first 16 terms is 120.
Find the common difference. (3 marks)
--- 7 WORK AREA LINES (style=lined) ---
A bag contains 5 green beads and 7 purple beads. Two beads are selected at random, without replacement.
What is the probability that the two beads are the same colour? (2 marks)
--- 8 WORK AREA LINES (style=lined) ---

| `P\ text{(same colour)}` | `= P (GG) + P(PP)` |
| `= 5/12 ⋅ 4/11 + 7/12 ⋅ 6/11` | |
| `= 62/132` | |
| `= 31/66` |
Amanda uses 80 kilocalories of energy per kilometre while she is running.
She eats a burger that contains 2180 kilojoules of energy. How many kilometres will she need to run to use up all the energy from the burger? Give your answer correct to one decimal place. (1 kilocalorie = 4.184 kilojoules) (2 marks)
--- 4 WORK AREA LINES (style=lined) ---
What is the limiting sum of the following geometric series?
`2000 - 1200 + 720 - 432…` (2 marks)
Differentiate `(2x + 1)/(x + 5)`. (2 marks)
--- 5 WORK AREA LINES (style=lined) ---
Julia earns $28 per hour. Her hourly pay rate increases by 2%.
How much will she earn for a 4-hour shift with this increase?
Mary is 18 years old and has just purchased comprehensive motor vehicle insurance. The following excesses apply to claims for at-fault motor vehicle accidents.
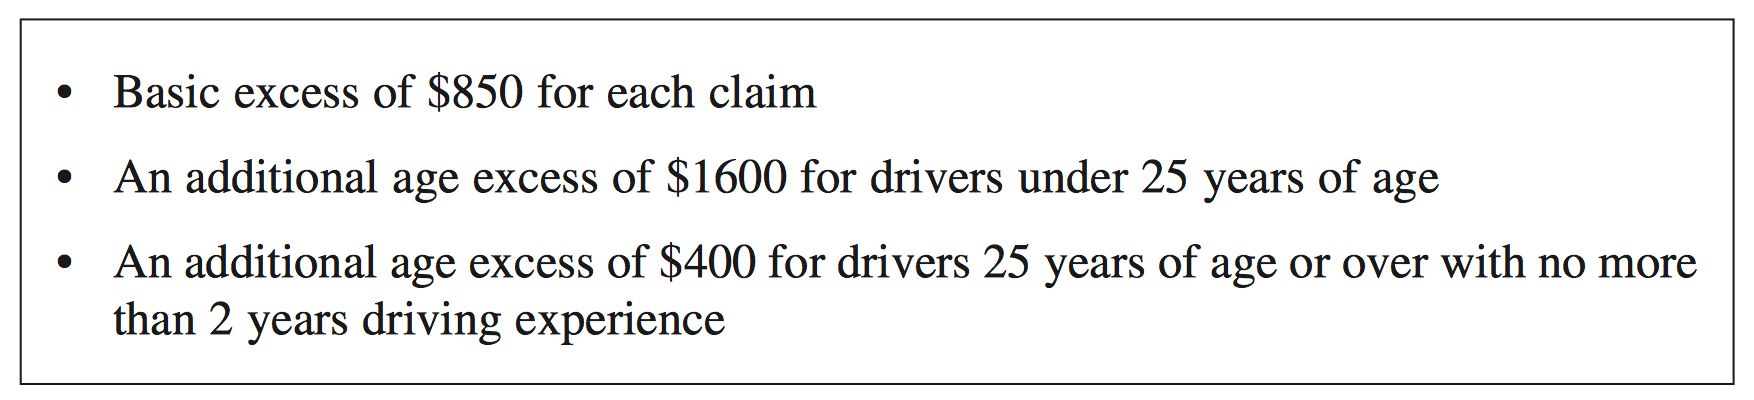
How much would Mary be required to pay as excess if she made a claim as the driver at fault in a car accident?
Sugar is sold in four different sized packets.
Which is the best buy?
A set of bivariate data is collected by measuring the height and arm span of seven children. The graph shows a scatterplot of these measurements.

--- 1 WORK AREA LINES (style=lined) ---
--- 2 WORK AREA LINES (style=lined) ---
Calculate the predicted height for this child using the equation of the least-squares regression line. (1 mark)
--- 1 WORK AREA LINES (style=lined) ---
Andrew, Brandon and Cosmo are the first three batters in the school cricket team. In a recent match, Andrew scored 30 runs, Brandon scored 25 runs and Cosmo scored 40 runs.
--- 4 WORK AREA LINES (style=lined) ---
--- 4 WORK AREA LINES (style=lined) ---
What values of `x` satisfy `4-3x <= 12`?
What is the value of `pi^10` to two significant figures?
The diagram shows a projectile fired at an angle `theta` to the horizontal from the origin `O` with initial velocity `V\ text(ms)^(−1)`.
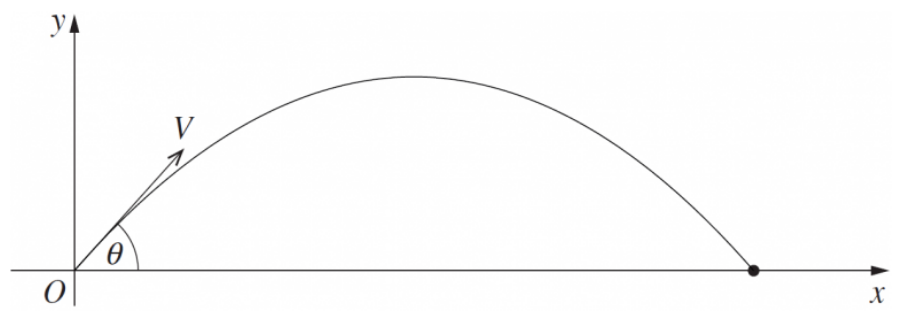
The position vector for the projectile is given by
`qquad underset~s(t) = Vtcosthetaunderset~i + (Vtsintheta - 1/2 g t^2)underset~j` (DO NOT prove this)
where `g` is the acceleration due to gravity.
--- 5 WORK AREA LINES (style=lined) ---
The projectile is fired so that `theta = pi/3`.
--- 5 WORK AREA LINES (style=lined) ---
A cricketer hits a ball at time `t = 0` seconds from an origin `O` at ground level across a level playing field.
The position vector `underset ~s(t)`, from `O`, of the ball after `t` seconds is given by
`qquad underset ~s(t) = 15t underset ~i + (15 sqrt 3 t - 4.9t^2)underset ~j`,
where, `underset ~i` is a unit vector in the forward direction, `underset ~j` is a unit vector vertically up and displacement components are measured in metres.
--- 5 WORK AREA LINES (style=lined) ---
--- 4 WORK AREA LINES (style=lined) ---
--- 2 WORK AREA LINES (style=lined) ---
--- 2 WORK AREA LINES (style=lined) ---
How far horizontally from `O` is the fielder when the ball is caught? Give your answer in metres, correct to one decimal place. (2 marks)
--- 5 WORK AREA LINES (style=lined) ---
Steve and Jess are two students who have agreed to take part in a psychology experiment. Each has to answer several sets of multiple-choice questions. Each set has the same number of questions, `n`, where `n` is a number greater than 20. For each question there are four possible options A, B, C or D, of which only one is correct.
Let the random variable `X` be the number of questions that Steve answers correctly in a particular set.
--- 1 WORK AREA LINES (style=lined) ---
--- 2 WORK AREA LINES (style=lined) ---
If `P(Y > 23) = 6 xx P(Y = 25)`, show that the value of `p=5/6`. (2 marks)
--- 5 WORK AREA LINES (style=lined) ---
Consider the function `f(x) = 1/(4x-1)`.
--- 1 WORK AREA LINES (style=lined) ---
--- 8 WORK AREA LINES (style=lined) ---
a. `{text(all real)\ x, x!=1/4}`
b.

| a. | `4x-1` | `!= 0` |
| `x` | `!= 1/4` |
`:.\ text(Domain:)\ {text(all real)\ x, x!=1/4}`
b. `text(When)\ \ x = 0, \ y = −1`
`text(As)\ \ x -> ∞, \ y -> 0^+`
`text(As)\ \ x -> −∞, \ y -> 0^−`
--- 1 WORK AREA LINES (style=lined) ---
--- 8 WORK AREA LINES (style=lined) ---

| i. | `y` | `= (2x^2)/(x^2 +9)` |
| `= 2/(1 + 9/(x^2))` |
`text(As)\ \ x -> oo,\ y ->2`
`text(As)\ \ x -> – oo,\ y -> 2`
`:.\ text(Horizontal asymptote at)\ y = 2`
| ii. | `text(At)\ \ x = 0,\ y = 0` |
`f(x) = (2x^2)/(x^2 + 9) >= 0\ text(for all)\ x`
`f(–x) = (2(–x)^2)/((–x)^2 + 9) = (2x^2)/(x^2 + 9) = f(x)`
`text(S)text(ince)\ \ f(x) = f(–x) \ \ =>\ text(EVEN function)`
Find `y` given `dy/dx = 1 - y/3` and `y = 4` when `x = 2`. (2 marks)
--- 6 WORK AREA LINES (style=lined) ---
Consider the vector `underset ~a = sqrt 3 underset ~i - underset ~j - sqrt 2 underset ~k`, where `underset ~i, underset ~j` and `underset ~k` are unit vectors in the positive directions of the `x, y` and `z` axes respectively.
--- 2 WORK AREA LINES (style=lined) ---
--- 4 WORK AREA LINES (style=lined) ---
Given that `underset ~b` is perpendicular to `underset ~a,` find the value of `m`. (2 marks)
--- 2 WORK AREA LINES (style=lined) ---
The coordinates of three points are `A\ ((– 1), (2), (4)), \ B\ ((1), (0), (5)) and C\ ((3), (5), (2)).`
--- 2 WORK AREA LINES (style=lined) ---
Prove that the triangle has a right angle at `A.` (2 marks)
--- 4 WORK AREA LINES (style=lined) ---
--- 5 WORK AREA LINES (style=lined) ---