What are the equations of the asymptotes of the hyperbola `9x^2 - 4y^2 = 36`?
- `y = +- 9/4x`
- `y = +- 2/3x`
- `y = +- 3/2x`
- `y = +- 4/9x`
Aussie Maths & Science Teachers: Save your time with SmarterEd
What are the equations of the asymptotes of the hyperbola `9x^2 - 4y^2 = 36`?
Which expression is equal to `int 1/(sqrt(1 - 4x^2))\ dx`?
An artist posted a song online. Each day there were `2^n + n` downloads, where `n` is the number of days after the song was posted.
--- 1 WORK AREA LINES (style=lined) ---
--- 4 WORK AREA LINES (style=lined) ---
The population of a country grew exponentially between 1910 and 2010. This population can be modelled by the equation `P(t) = 92e^(kt)`, where `P(t)` is the population of the country in millions, `t` is the time in years after 1910 and `k` is a positive constant. The population of the country in 1960 was 184 million.
--- 5 WORK AREA LINES (style=lined) ---
--- 4 WORK AREA LINES (style=lined) ---
Consider the curve `y = 6x^2 - x^3`.
--- 6 WORK AREA LINES (style=lined) ---
--- 4 WORK AREA LINES (style=lined) ---
--- 8 WORK AREA LINES (style=lined) ---
i. `y = 6x^2 – x^3`
`(dy)/(dx) = 12x – 3x^2`
`(d^2y)/(dx^2) = 12 – 6x`
`text(S.P.s occur when)\ \ (dy)/(dx) = 0`
`12x – 3x^2 = 0`
`3x(4 – x) = 0`
`x = 0 or 4`
`text(When)\ \ x = 0,\ (d^2y)/(dx^2) > 0`
`:.\ text(MIN at)\ (0, 0)`
`text(When)\ \ x = 4,\ (d^2y)/(dx^2) < 0`
`:.\ text(MAX at)\ (4, 32)`
ii. `text(P.I. occur when)\ \ (d^2y)/(dx^2) = 0,`
| `12 – 6x` | `= 0` |
| `x` | `= 2` |
`text(When)\ \ x = 2,\ y = 16`

`text(S)text(ince the concavity changes)`
`=>\ text(P.I. occurs at)\ \ (2, 16)`
| iii. |  |
The displacement of a particle moving along the `x`-axis is given by
`x = t^3/3 - 2t^2 + 3t,`
where `x` is the displacement from the origin in metres and `t` is the time in seconds, for `t >= 0`.
--- 2 WORK AREA LINES (style=lined) ---
--- 3 WORK AREA LINES (style=lined) ---
--- 4 WORK AREA LINES (style=lined) ---
A ship travels from Port A on a bearing of 050° for 320 km to Port B. It then travels on a bearing of 120° for 190 km to Port C.

--- 3 WORK AREA LINES (style=lined) ---
--- 5 WORK AREA LINES (style=lined) ---
| i. |  |
`text(Let)\ \ D\ \ text(be south of)\ \ B`
`/_ ABD = 50^@ qquad text{(alternate angles)}`
`/_DBC = 60^@ qquad text{(180° in straight line)}`
| `:. /_ ABC` | `= 50 + 60` |
| `= 110^@` |
ii. `text(Using the cosine rule:)`
| `AC^2` | `= AB^2 + BC^2 – 2 *AB*BC* cos /_ ABC` |
| `= 320^2 + 190^2 – 2 xx 320 xx 190 xx cos 110^@` | |
| `= 180\ 089.64…` | |
| `:. AC` | `= 424.36…` |
| `= 420\ text{km (nearest 10 km)}` |
Differentiate `e^x/(x + 1)`. (2 marks)
--- 5 WORK AREA LINES (style=lined) ---
Differentiate `x^2 tan x`. (2 marks)
Evaluate `int_0^3 e^(5x)\ dx`. (2 marks)
In an arithmetic series, the third term is 8 and the twentieth term is 59.
--- 2 WORK AREA LINES (style=lined) ---
--- 4 WORK AREA LINES (style=lined) ---
Solve `1 - 3x > 10`. (2 marks)
Rationalise the denominator of `3/(3 + sqrt 2)`. (2 marks)
A field is bordered on one side by a straight road and on the other side by a river, as shown. Measurements are taken perpendicular to the road every 7.5 metres along the road.

Use four applications of the Trapeziodal rule to find an approximation to the area of the field. Answer to the nearest square metre. (3 marks)
--- 6 WORK AREA LINES (style=lined) ---
`text(Strategy 1)`
| `A` | `~~ 7.5/2(8.8 + 7.1) + 7.5/2(7.1 + 9.8) + 7.5/2(9.8 + 8.5) + 7.5/2(8.5 + 4.9)` |
| `~~ 241.875` | |
| `~~ 242\ text{m² (nearest m²)}` |
`text(Strategy 2)`

| `A` | `~~ 7.5/2(8.8 + 2 xx 7.1 + 2 xx 9.8 + 2 xx 8.5 + 4.9)` |
| `~~ 242\ text(m²)` |
What is the derivative of `sin(ln x),` where `x > 0`?
Joanna sits a Physics test and a Biology test.
Calculate the `z`-score for Joanna’s mark in this test. (1 mark)
--- 2 WORK AREA LINES (style=lined) ---
Joanna’s `z`-score is the same in both the Physics test and the Biology test.
What is her mark in the Biology test? (2 marks)
--- 4 WORK AREA LINES (style=lined) ---
The graph displays the cost (`$c`) charged by two companies for the hire of a minibus for `x` hours.

Both companies charge $360 for the hire of a minibus for 3 hours.
--- 1 WORK AREA LINES (style=lined) ---
Write a formula, in the form of `c = mx + b`, for the cost of hiring a minibus from Company B for `x` hours. (2 marks)
--- 4 WORK AREA LINES (style=lined) ---
Calculate how much cheaper this is than hiring from Company A. (2 marks)
--- 4 WORK AREA LINES (style=lined) ---
A car is purchased for $23 900.
The value of the car is depreciated by 11.5% each year using the declining-balance method.
What is the value of the car after three years? (2 marks)
--- 4 WORK AREA LINES (style=lined) ---
Ali made monthly deposits of $100 into an annuity for 5 years.
Calculate the total amount Ali deposited into the annuity over this period. (1 mark)
Clark’s formula, given below, is used to determine the dosage of medicine for children.
`text(Dosage) = (text(weight in kg × adult dosage))/70`
For a particular medicine, the adult dosage is 325 mg and the correct dosage for a specific child is 90 mg.
How much does the child weigh, to the nearest kg? (2 marks)
What is the `x`-intercept of the line `x + 3y + 6 = 0`?
An experiment has three distinct outcomes, A, B and C.
Outcome A occurs 50% of the time. Outcome B occurs 23% of the time.
What is the expected number of times outcome C would occur if the experiment is conducted 500 times?
The driving distance from Alex's home to his work is 20 km. He drives to and from work five times each week. His car uses fuel at the rate of 8 L/100 km.
How much fuel does he use driving to and from work each week?
Which graph best represents the equation `y = x^2-2`?
| A. |  |
B. |  |
| C. |  |
D. |  |
A set of scores has the following five-number summary.
lower extreme = 2
lower quartile = 5
median = 6
upper quartile = 8
upper extreme = 9
What is the range?
In triangle `ABC, BC` is perpendicular to `AC`. Side `BC` has length `a`, side `AC` has length `b` and side `AB` has length `c`. A quadrant of a circle of radius `x`, centered at `C`, is constructed. The arc meets side `BC` at `E`. It touches the side `AB` at `D`, and meets side `AC` at `F`. The interval `CD` is perpendicular to `AB`.


A table is constructed to represent the network diagram below.

Complete the table. (2 marks)

--- 0 WORK AREA LINES (style=lined) ---

Prove by mathematical induction that, for `n >= 1,`
`2-6 + 18-54 + … + 2 (-3)^(n-1) = (1-(-3)^n)/2.` (3 marks)
--- 14 WORK AREA LINES (style=lined) ---
An object is projected from the origin with an initial velocity of `V` at an angle `theta` to the horizontal. The equations of motion of the object are
| `x(t)` | `= Vt cos theta` |
| `y(t)` | `= Vt sin theta - (g t^2)/2.` (Do NOT prove this.) |
`V^2/g sin 2 theta` (2 marks)
--- 6 WORK AREA LINES (style=lined) ---
`V^2/g sin 2 theta`. (1 mark)
--- 3 WORK AREA LINES (style=lined) ---
Let these angles be `alpha` and `beta`, where `beta = pi/2 - alpha.`
Let `h_alpha` be the maximum height reached by the object when projected at the angle `alpha` to the horizontal.
Let `h_beta` be the maximum height reached by the object when projected at the angle `beta` to the horizontal.

Show that the average of the two heights, `(h_alpha + h_beta)/2`, depends only on `V` and `g`. (3 marks)
--- 9 WORK AREA LINES (style=lined) ---
Let `f(x) = sin^(-1) x + cos^(-1) x`.
--- 2 WORK AREA LINES (style=lined) ---
--- 4 WORK AREA LINES (style=lined) ---
--- 8 WORK AREA LINES (style=lined) ---
i. `f^{′}(x) = 1/sqrt(1-x^2) + (-1/sqrt (1-x^2)) = 0`
ii. `text(S)text(ince)\ \ f^{′}(x) = 0\ \ => f(x)\ \ text(is a constant.)`♦ Mean mark (ii) 37%.
`text(Substituting)\ \ x=1\ \ text{into the equation (any value works)}`
| `sin^(-1) 1 + cos^(-1) 1` | `= pi/2 + 0` | |
| `= pi/2\ \ text(… as required)` |
iii. `text(Domain restrictions require:)\ \ -1<x<1`♦ Mean mark (iii) 40%.
|
|
A ferris wheel has a radius of 20 metres and is rotating at a rate of 1.5 radians per minute. The top of a carriage is `h` metres above the horizontal diameter of the ferris wheel. The angle of elevation of the top of the carriage from the centre of the ferris wheel is `theta`.

--- 2 WORK AREA LINES (style=lined) ---
--- 6 WORK AREA LINES (style=lined) ---
Find `int cos^2 (3x)\ dx`. (2 marks)
Evaluate `int_-3^0 x/sqrt(1 - x) dx`, using the substitution `u = 1 - x`. (3 marks)
--- 8 WORK AREA LINES (style=lined) ---
Consider the function `f(x) = 1/(4x - 1)`.
(i) `text(Domain is)\ {text(all real)\ x, x!=1/4}`
| (ii) | `1/(4x – 1)` | `< 1` |
| `(4x – 1)` | `< (4 x – 1)^2` | |
| `(4x – 1)^2 – (4x – 1)` | `> 0` | |
| `(4x – 1)[4x – 1- 1]` | `> 0` | |
| `2 (4x – 1) (2x – 1)` | `> 0` |
`text(Sketching the parabola:)`
`x > 1/2 or x < 1/4.`

`text(From the graph,)`
`y > 1\ \ text(when)\ \ x < 1/4 or x > 1/2`
Write `sqrt 3 sin x + cos x` in the form `R sin (x + alpha)` where `R > 0` and `0 <= alpha <= pi/2.` (2 marks)
--- 6 WORK AREA LINES (style=lined) ---
Solve `log_2 5 + log_2(x - 2) = 3.` (2 marks)
Consider the polynomial `P(x) = x^3-2x^2-5x + 6`.
--- 2 WORK AREA LINES (style=lined) ---
--- 5 WORK AREA LINES (style=lined) ---
The acute angle between the lines `y = 3x` and `y = 5x` is `theta.`
What is the value of `tan theta?`
A. `1/8`
B. `1/7`
C. `1/2`
D. `4/7`
The polynomial `2x^3 + 6x^2 - 7x - 10` has zeros `alpha, beta and gamma.`
What is the value of `alpha beta gamma (alpha + beta + gamma)?`
A. `−60`
B. `−15`
C. `15`
D. `60`
A project will be undertaken in the wildlife park. This project involves the 13 activities shown in the table below. The duration, in hours, and predecessor(s) of each activity are also included in the table.
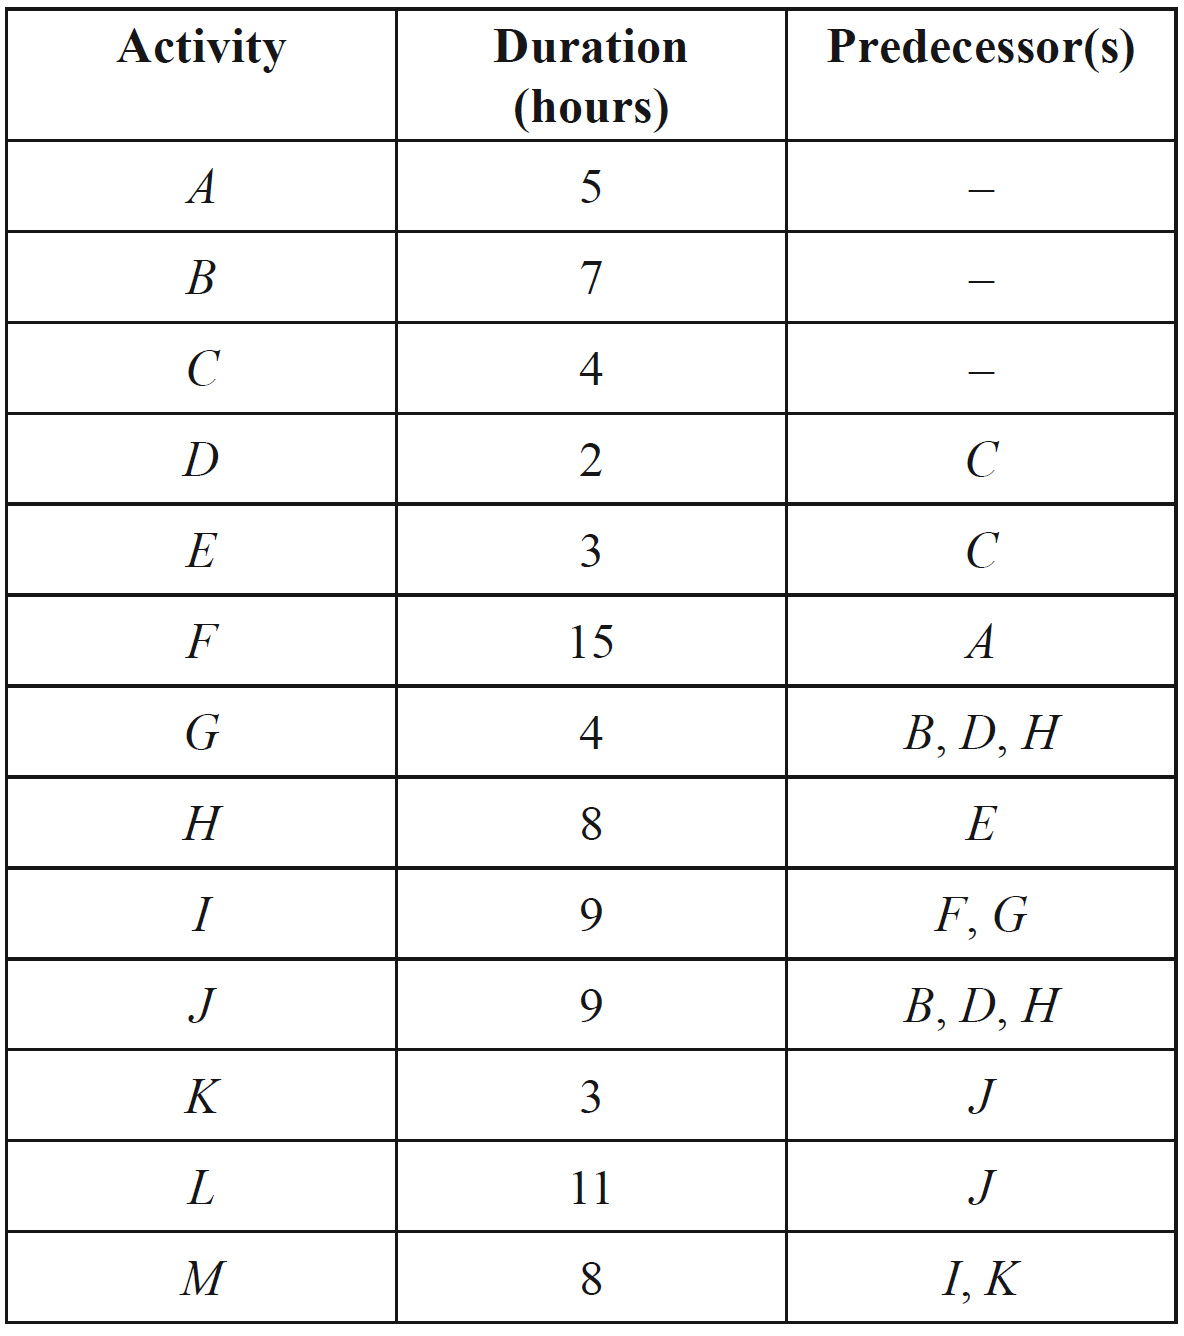
Activity `G` is missing from the network diagram for this project, which is shown below.

--- 1 WORK AREA LINES (style=lined) ---
--- 2 WORK AREA LINES (style=lined) ---
--- 1 WORK AREA LINES (style=lined) ---
‘If the time to complete just one of the activities in this project is reduced by one hour, then the minimum time to complete the entire project will be reduced by one hour.’
Explain the circumstances under which this statement will be true for this project. (1 mark)
--- 2 WORK AREA LINES (style=lined) ---
--- 2 WORK AREA LINES (style=lined) ---
a.

b. `7\ text(hours)`
c.i. `AFIM`
c.ii. `14\ text(hours)`
d. `text(The statement will only be true if the crashed activity)`
`text(is on the critical path)\ \ A F I M.`
e. `text(36 hours)`
| a. | |
b. `text(Scanning forwards and backwards:)`

`text(EST for Activity)\ H`
`= 4 + 3`
`= 7\ text(hours)`
c.i. `A F I M`
c.ii. `text(LST of)\ G = 20 – 4 = 16\ text(hours)`
`text(LST of)\ D = 16 – 2 = 14\ text(hours)`
d. `text(The statement will only be true if the time reduced activity)`
`text(is on the critical path)\ \ A F I M.`
e. `A F I M\ text(is 37 hours.)`
`text(If)\ F\ text(is reduced by 2 hours, the new critical)`
`text(path is)\ \ C E H G I M\ text{(36 hours)}`
`:.\ text(Minimum completion time = 36 hours)`
Thirteen activities must be completed before the produce grown on a farm can be harvested.
The directed network below shows these activities and their completion times in days.

--- 1 WORK AREA LINES (style=lined) ---
Explain why this activity is used on the network diagram. (1 mark)
--- 1 WORK AREA LINES (style=lined) ---
--- 1 WORK AREA LINES (style=lined) ---
--- 2 WORK AREA LINES (style=lined) ---
--- 1 WORK AREA LINES (style=lined) ---
| a. | `text(EST of)\ E` | `= 10 + 2` |
| `= 12\ text(days)` |
b. `F\ text(has)\ B\ text(as a predecessor while)\ G\ text(and)\ H`
`text(have)\ B\ text(and)\ C\ text(as predecessors.)`
`text(S)text(ince there cannot be 2 activities called)\ B, text(a zero)`
`text{duration activity is drawn as an extension of}\ B\ text(to)`
`text(show that it is also a predecessor of)\ G\ text(and)\ H.`
c. `text(Scanning forwards:)`

`text(EST for)\ H = 15\ text(days)`
d. `text(The critical path is)\ \ ABHILM`

e. `text(The shortest time to complete all the activities)`
`= 10 + 5 + 4 + 3 + 4 + 2`
`= 28\ text(days)`
| `:.\ text(LST of)\ J` | `= 28 − 3` |
| `= 25\ text(days)` |
For a particular project there are ten activities that must be completed.
These activities and their immediate predecessors are given in the following table.

A directed graph that could represent this project is
| A. |  |
| B. |  |
| C. |  |
| D. |  |
`text(Consider the information in the table:)`
`text(D and E are prerequisites to F → eliminate B)`
`text(G is a prerequisite to I → eliminate A and C)`
`=>\ text(Option D reflects the information in the table:)`
`rArr D`
An estate has large open parklands that contain seven large trees.
The trees are denoted as vertices A to G on the network diagram below.
Walking paths link the trees as shown.
The numbers on the edges represent the lengths of the paths in metres.

Jamie is standing at A and Michelle is standing at D.
Write down the shortest route that Jamie can take and the distance travelled to meet Michelle at D. (1 mark)
--- 2 WORK AREA LINES (style=lined) ---
`text(One strategy – using Dijkstra’s algorithm:)`

`text(Shortest path is)\ AFCD`
| `text(Shortest distance)` | `= 200 + 150 + 150` |
| `= 500\ text(metres)` |

In the directed graph above, the only vertex with a label that can be reached from vertex Y is
A. vertex A
B. vertex B
C. vertex C
D. vertex D
The following directed graph represents a series of one-way streets with intersections numbered as nodes 1 to 8.

All intersections can be reached from
A. intersection 4
B. intersection 5
C. intersection 6
D. intersection 8
A school is designing a computer network between five key areas within the school.
The cost of connecting the rooms is shown in the diagram below.

--- 0 WORK AREA LINES (style=lined) ---

--- 1 WORK AREA LINES (style=lined) ---

a. `text(One Strategy: Using Prim’s Algorithm)`
`text(Starting vertex – Staff Room)`
`text(1st edge: Staff Room – Library)`
`text(2nd edge: Library – School Office)`
`text(3rd edge: Staff Room – IT Staff)`
`text(4th edge: Library – Computer Room)`
| b. | `text(Minimum Cost)` | `= 300 + 300 + 400 + 500` |
| `= $1500` |
This diagram shows the possible paths (in km) for laying gas pipes between various locations.

Gas is to be supplied from one location. Any one of the locations can be the source of the supply.
What is the minimum total length of the pipes required to provide gas to all the locations?
| A. | 32 km |
| B. | 34 km |
| C. | 36 km |
| D. | 38 km |
`text(Using Kruskal’s Algorithm:)`

`text(1st edge: Parkview – Summerville)\ (5)`
`text(2nd edge: Summerville – Newville)\ (8)`
`text(3rd edge: Beachview – Summerville)\ (10)`
`text(4th edge: Old Town – Newville)\ (11)`
`:.\ text(Minimum length of pipes.)`
`= 5 + 8 + 10 + 11`
`= 34`
`=> B`
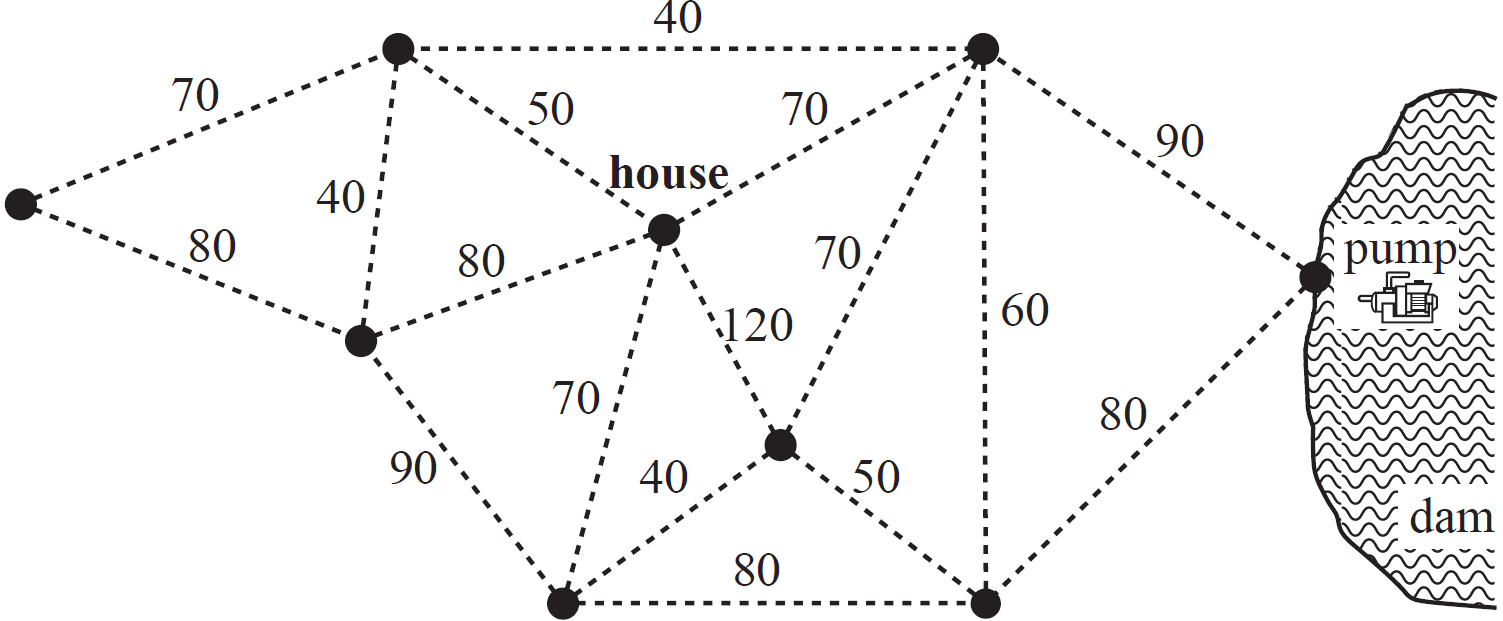
Water will be pumped from a dam to eight locations on a farm.
The pump and the eight locations (including the house) are shown as vertices in the network diagram below.
The numbers on the edges joining the vertices give the shortest distances, in metres, between locations.
--- 1 WORK AREA LINES (style=lined) ---
The total length of all edges in the network is 1180 metres.
The total length of pipe that supplies water from the pump to the eight locations on the farm is a minimum.
This minimum length of pipe is laid along some of the edges in the network.
--- 1 WORK AREA LINES (style=lined) ---

a. `2\ text{(the house and the top right vertex)}`
b. `text(One Strategy – Using Prim’s algorithm:)`
`text(Starting at the house)`
`text(1st edge: 50)`
`text{2nd edge: 40 (either)}`
`text(3rd edge: 40)`
`text(4th edge: 60 etc…)`
c. `text(Minimum spanning tree)`
The factory supplies groceries to stores in five towns, `Q`, `R`, `S`, `T` and `U`, represented by vertices on the graph below.

The edges of the graph represent roads that connect the towns and the factory.
The numbers on the edges indicate the distance, in kilometres, along the roads.
Vehicles may only travel along the road between towns `S` and `Q` in the direction of the arrow due to temporary roadworks.
Each day, a van must deliver groceries from the factory to the five towns.
The first delivery must be to town `T`, after which the van will continue on to the other four towns before returning to the factory.
Describe the order in which these deliveries would follow to achieve the shortest possible circuit and the length, in kilometres, of the circuit. (2 marks)
Aden, Bredon, Carrie, Dunlop, Enwin and Farnham are six towns.
The network shows the road connections and distances between these towns in kilometres.

--- 1 WORK AREA LINES (style=lined) ---
--- 1 WORK AREA LINES (style=lined) ---
An engineer plans to inspect all of the roads in this network.
He will start at Dunlop and inspect each road only once.
--- 2 WORK AREA LINES (style=lined) ---
The diagram below shows a network of tracks (represented by edges) between checkpoints (represented by vertices) in a short-distance running course. The numbers on the edges indicate the time, in minutes, a team would take to run along each track.

A challenge requires teams to run from checkpoint `X` to checkpoint `Y` using these tracks.
What would be the shortest possible time for a team to run from checkpoint `X` to checkpoint `Y`? Mark the shortest route on the diagram below. (2 marks)

--- 4 WORK AREA LINES (style=lined) ---
`text(Using Djikstra’s Algorithm:)`

`text(Shortest distance)\ \ X\ \ text(to)\ \ Y`
`=4 + 3 + 4`
`= 11\ text(minutes)`
One of the landmarks in a city is a hedge maze. The maze contains eight statues. The statues are labelled `F` to `M` on the following directed graph. Walkers within the maze are only allowed to move in the directions of the arrows.

--- 1 WORK AREA LINES (style=lined) ---
List the three other ways that statue `H` can be reached from statue `K`. (1 mark)
--- 1 WORK AREA LINES (style=lined) ---
Bus routes connect six towns.
The towns are Northend (`N`), Opera (`O`), Palmer (`P`), Quigley (`Q`), Rosebush (`R`) and Seatown (`S`).
The graph below gives the cost, in dollars, of bus travel along these routes.
Bai lives in Northend (`N`) and he will travel by bus to take a holiday in Seatown (`S`).

--- 1 WORK AREA LINES (style=lined) ---
--- 1 WORK AREA LINES (style=lined) ---
| a. | `text(C)text(ost)` | `= 15 + 105` |
| `= $120` |
b. `text(Using Djikstra’s algorithm:)`

`text(Fastest route is:)\ \ NQRS.`
`:.\ text(Other towns are Quigley and Rosebush.)`
The vertices in the network diagram below show the entrance to a wildlife park and six picnic areas in the park: `P1`, `P2`, `P3`, `P4`, `P5` and `P6`.
The numbers on the edges represent the lengths, in metres, of the roads joining these locations.

--- 1 WORK AREA LINES (style=lined) ---
--- 1 WORK AREA LINES (style=lined) ---
a. `3`
b. `text(Using Djikstra’s algorithm:)`

`text( Shortest distance)`
`= E – P1 – P3`
`= 600 + 400`
`= 1000\ text(m)`
Water will be pumped from a dam to eight locations on a farm.
The pump and the eight locations (including the house) are shown as vertices in the network diagram below.
The numbers on the edges joining the vertices give the shortest distances, in metres, between locations.
a.i. Determine the shortest distance between the house and the pump. (1 mark)
a.ii. How many vertices on the network diagram have an odd degree? (1 mark)
The total length of pipe that supplies water from the pump to the eight locations on the farm is a minimum.
This minimum length of pipe is laid along some of the edges in the network.
b.i. On the diagram below, draw the minimum length of pipe that is needed to supply water to all locations on the farm. (1 mark)
b.ii. What is the mathematical term that is used to describe this minimum length of pipe in part b.i.? (1 mark)
a.i. `160\ text(m)`
a.ii. `2`
b.i. `1250\ text(m)`
b.ii. `text(Minimal spanning tree)`
a.i. `text(Shortest distance)`
`=70 + 90`
`= 160\ text(m)`
a.ii. `2\ text{(the house and the top right vertex)}`
| b.i. | |
b.ii. `text(Minimal spanning tree)`
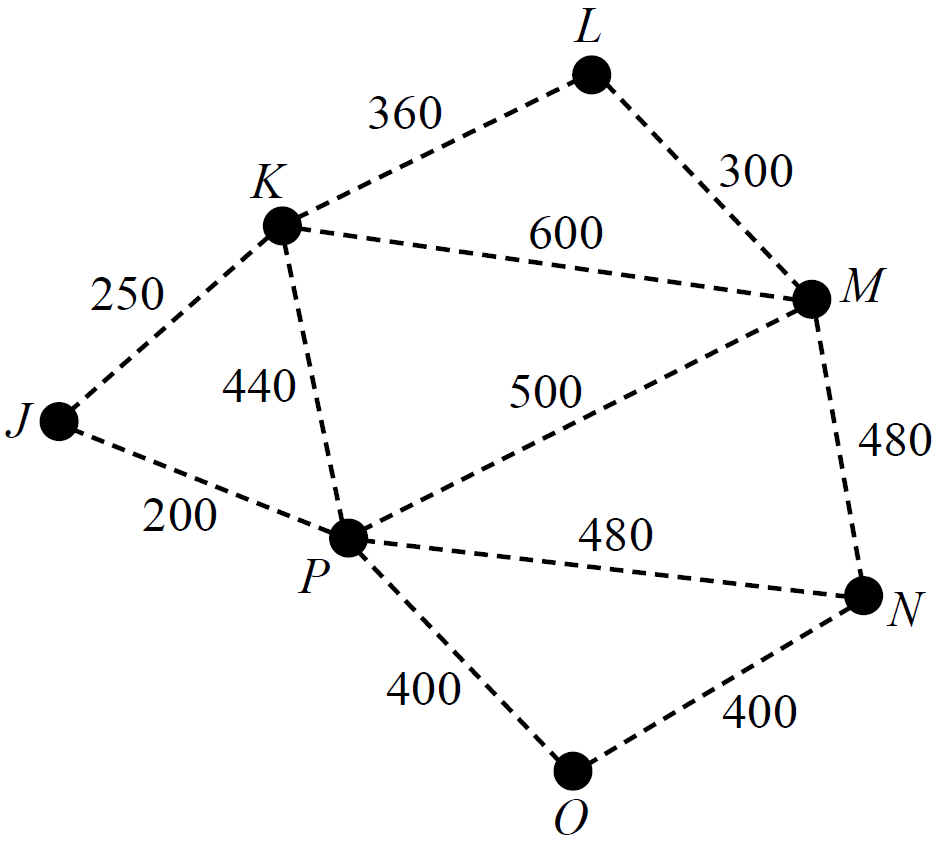
A factory requires seven computer servers to communicate with each other through a connected network of cables.
The servers, `J`, `K`, `L`, `M`, `N`, `O` and `P`, are shown as vertices on the graph below.

The edges on the graph represent the cables that could connect adjacent computer servers.
The numbers on the edges show the cost, in dollars, of installing each cable.
--- 1 WORK AREA LINES (style=lined) ---
--- 1 WORK AREA LINES (style=lined) ---
How much would be saved in installation costs if the factory removed computer server `P` from its minimum spanning tree network?
A copy of the graph above is provided below to assist with your working. (1 mark)
--- 0 WORK AREA LINES (style=lined) ---

a. `$300`
b. `text(Minimum cost of)\ K\ text(to)\ N`
`= 440 + 480`
`= $920`
c.i. `text(Using Prim’s Algorithm:)`
`text(Starting at Vertex)\ L`
`text{1st Edge: L → M (300)}`
`text{2nd Edge: L → K (360)}`
`text{3rd Edge: K → J (250)}`
`text{4th Edge: J → P (200) etc…}`
c.ii. `text(Disconnect)\ J – P\ text(and)\ O – P`
`text(Savings) = 200 + 400 = $600`
`text(Add in)\ M – N`
`text(C)text(ost) = $480`
| `:.\ text(Net savings)` | `= 600 – 480` |
| `= $120` |
At the Farnham showgrounds, eleven locations require access to water. These locations are represented by vertices on the network diagram shown below. The dashed lines on the network diagram represent possible water pipe connections between adjacent locations. The numbers on the dashed lines show the minimum length of pipe required to connect these locations in metres.

All locations are to be connected using the smallest total length of water pipe possible.
--- 1 WORK AREA LINES (style=lined) ---

a. `text(Using Prim’s Algorithm)`
`text(Starting at bottom right vertex)`
`text{1st Edge: 50}`
`text{2nd Edge: 40`
`text(3rd Edge: 50)`
`text(4th Edge: 40 etc…)`
b. `text(Total length of water pipe)`
`= 50+40+50+40+50+60+40+60+60+60`
`= 510\ text(metres)`
James, Dante, Tahlia and Chanel are four children playing a game.
In this children’s game, seven posts are placed in the ground.
The network below shows distances, in metres, between the seven posts.
The aim of the game is to connect the posts with ribbon using the shortest length of ribbon.
This will be a minimal spanning tree.


--- 1 WORK AREA LINES (style=lined) ---
--- 1 WORK AREA LINES (style=lined) ---
a. `text(Using Kruskal’s Algorithm)`
`text{Edges 1-3: 2}`
`text{Edges 4-5: 3 (2 edges with weight 3 create a circuit and are ignored)`
`text(Edge 6: 4)`

`text(or)`

b. `text(Length of minimal spanning tree)`
`= 2+2+2+3+3+4`
`= 16\ text(metres)`
c. `2`

The vertices of the graph above represent nine computers in a building. The computers are to be connected with optical fibre cables, which are represented by edges. The numbers on the edges show the costs, in hundreds of dollars, of linking these computers with optical fibre cables.
Based on the same set of vertices and edges, which one of the following graphs shows the cable layout (in bold) that would link all the computers with optical fibre cables for the minimum cost?


