Let `X` be a normally distributed random variable with a mean of 6 and a variance of 4. Let `Z` be a random variable with the standard normal distribution. --- 2 WORK AREA LINES (style=lined) --- --- 4 WORK AREA LINES (style=lined) ---
Aussie Maths & Science Teachers: Save your time with SmarterEd
Let `X` be a normally distributed random variable with a mean of 6 and a variance of 4. Let `Z` be a random variable with the standard normal distribution. --- 2 WORK AREA LINES (style=lined) --- --- 4 WORK AREA LINES (style=lined) ---
Let `f:[0,2pi] -> R, \ f(x) = 2cos(x) + 1`.
--- 5 WORK AREA LINES (style=lined) ---
--- 0 WORK AREA LINES (style=lined) ---
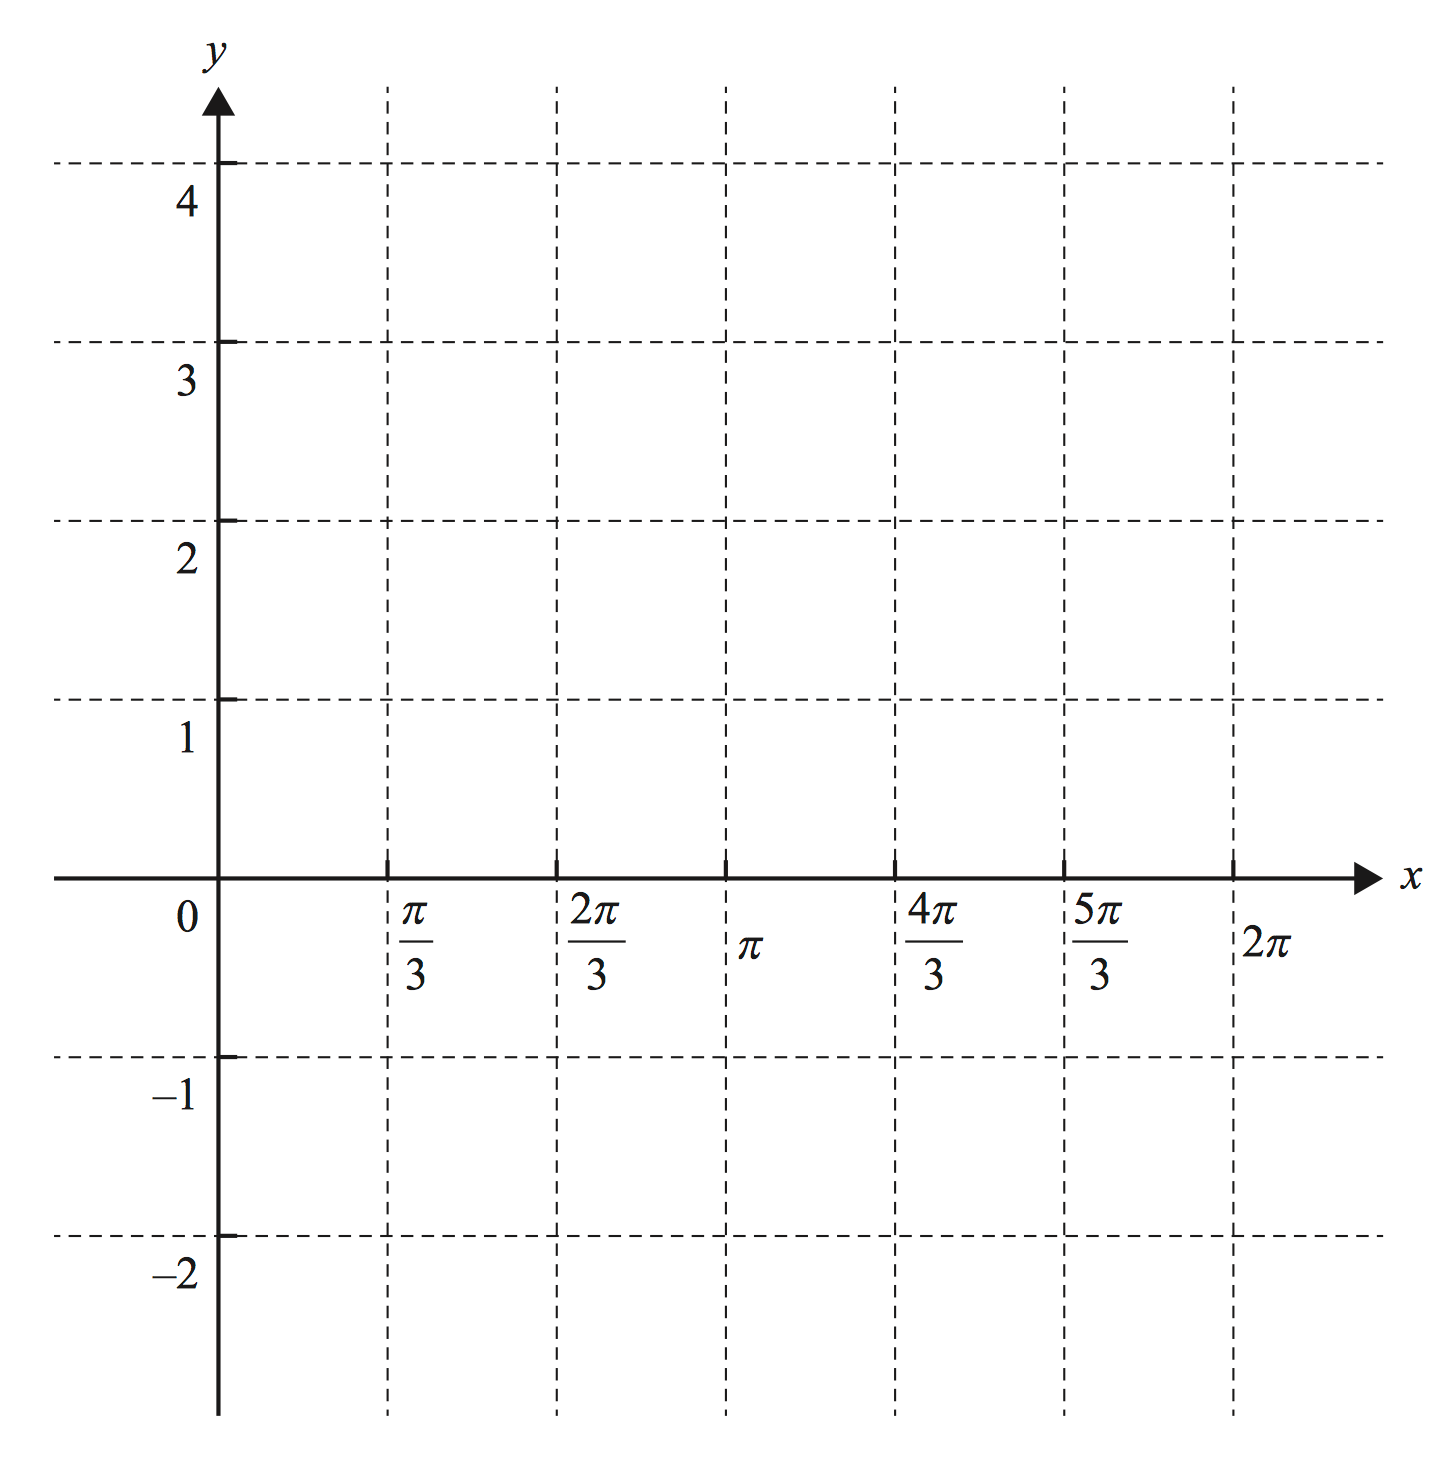

| a. | `2cos(x) + 1` | `= 0` |
| `cos(x)` | `=-1/2` |
`=> cos\ pi/3 = 1/2\ text(and cos is negative)`
`text(in 2nd/3rd quadrant)`
| `:.x` | `= pi-pi/3, pi + pi/3` |
| `= (2pi)/3, (4pi)/3` |
| b. | |
Let `f: R^+ -> R,\ f(x) = k log_2(x),\ k in R`.
Given that `f^(-1)(1) = 8`, the value of `k` is
The maximal domain of the function `f` is `R text(\{1})`.
A possible rule for `f` is
The graph below shows a line intersecting the `x`-axis at `(4, 0)` and the `y`-axis at `(0, 2)`.

The gradient of this line is
Robert wants to hire a geologist to help him find potential gold locations.
One geologist, Jennifer, charges a flat fee of $600 plus 25% commission on the value of gold found.
The following graph displays Jennifer’s total fee in dollars.

Another geologist, Kevin, charges a total fee of $3400 for the same task.
`qquad qquad`(answer on the axes above.)
Complete the step graph by sketching the missing information. (2 marks)

| a. |  |
b. `text(Let)\ \ x = text(value of gold)`♦ Mean mark 41%.
`text(Jennifer’s total fee) = 600 + 0.25x`
`text(Equating fees:)`
| `600 + 0.25x` | `= 3400` |
| `0.25x` | `= 2800` |
| `:.x` | `= 2800/0.25` |
| `= $11\ 200` |
| c. |  |
Consider the graph below.

Which one of the following is not a path for this graph?
The weight of gold can be recorded in either grams or ounces.
The following graph shows the relationship between weight in grams and weight in ounces.

The relationship between weight measured in grams and weight measured in ounces is shown in the equation
weight in grams = `M` × weight in ounces
Using the equation above, calculate the weight, in grams, of this gold nugget. (1 mark)
Using the equation above, calculate the weight, in ounces, of this gold. (1 mark)
The following chart displays the daily gold prices (dollars per gram) for the month of November 2017.

A triangle `PQR` is shown in the diagram below.

The length of the side `QR` is 18 cm.
The length of the side `PR` is 26 cm.
The angle `QRP` is 30°.
The area of triangle `PQR`, in square centimetres, is closest to
Consider the graph below.
Which one of the following is not a path for this graph?
A planar graph has five faces.
This graph could have
Tennis balls are packaged in cylindrical containers.
Frank purchases a container of tennis balls that holds three standard tennis balls, stacked one on top of the other.
This container has a radius of 3.4 cm and a height of 20.4 cm, as shown in the diagram below.

Write your answer in square centimetres, rounded to one decimal place. (1 mark)
A standard tennis ball is spherical in shape with a radius of 3.4 cm.
Round your answer to the nearest whole number. (1 mark)
At the Zenith Post Office all computer systems are to be upgraded.
This project involves 10 activities, `A` to `J`.
The directed network below shows these activities and their completion times, in hours.

--- 2 WORK AREA LINES (style=lined) ---
Write down the critical path. (1 mark)
--- 1 WORK AREA LINES (style=lined) ---
Write down these two activities. (1 mark)
--- 3 WORK AREA LINES (style=lined) ---
Complete the following sentence by filling in the boxes provided. (1 mark)
--- 3 WORK AREA LINES (style=lined) ---
The extra activity could be represented on the network above by a directed edge from the
| end of activity |
|
to the start of activity |
|
a. `text(Longest path to)\ I:`
`B -> E -> G`
| `:.\ text(EST for)\ \ I` | `= 2 + 3 + 5` |
| `= 10\ text(hours)` |
b. `B-E-G-H-J`
c. `text(Scanning forwards and backwards:)`♦ Mean mark 45%.

`:.\ text(Activity)\ A\ text(and)\ C\ text(have a 2 hour float time.)`
d. `text(end of activity)\ E\ text(to the start of activity)\ J`♦♦ Mean mark 25%.
`text(By inspection of forward and backward scanning:)`
`text(EST of 5 hours is possible after activity)\ E.`
`text(LST of 12 hours after activity)\ E -> text(edge has weight)`
`text(of 1 and connects to)\ J`
The graph below shows the possible number of postal deliveries each day between the Central Mail Depot and the Zenith Post Office.
The unmarked vertices represent other depots in the region.
The weighting of each edge represents the maximum number of deliveries that can be made each day.

Two other cuts are labelled as Cut B and Cut C.
i. Write down the capacity of Cut B. (1 mark)
--- 2 WORK AREA LINES (style=lined) ---
--- 2 WORK AREA LINES (style=lined) ---
--- 2 WORK AREA LINES (style=lined) ---
A transition matrix, `V`, is shown below.
`{:(),(),(),(),(V =),(),():}{:(qquadqquadtext(this month)),(qquadLqquadquadTqquadquadFqquad\ M),([(0.6,0.6,0.6,0.0),(0.1,0.2,0.0,0.1),(0.3,0.0,0.8,0.4),(0.0,0.2,0.0,0.5)]):}{:(),(),(L),(T),(F),(M):}{:\ text(next month):}`
The transition diagram below has been constructed from the transition matrix `V`.
The labelling in the transition diagram is not yet complete.

The proportion for one of the transitions is labelled `x`.
The value of `x` is

`x = 0.6`
`=> C`
The Hiroads company has a contract to maintain and improve 2700 km of highway.
Each year sections of highway must be graded `(G)`, resurfaced `(R)` or sealed `(S)`.
The remaining highway will need no maintenance `(N)` that year.
Let `S_n` be the state matrix that shows the highway maintenance schedule for the `n`th year after 2018.
The maintenance schedule for 2018 is shown in matrix `S_0` below.
`S_0 = [(700),(400),(200),(1400)]{:(G),(R),(S),(N):}`
The type of maintenance in sections of highway varies from year to year, as shown in the transition matrix `T`, below.
`{:(qquad qquad qquad qquad qquad quad text(this year)),(qquad qquad quad quad G qquad quad R qquad quad S quad quad \ N),(T = [(0.2,0.1,0.0,0.2),(0.1,0.1,0.0,0.2),(0.2,0.1,0.2,0.1),(0.5, 0.7,0.8,0.5)]{:(G),(R),(S),(N):} \ text (next year)):}`
--- 2 WORK AREA LINES (style=lined) ---
--- 0 WORK AREA LINES (style=lined) ---
|
|
`× 700 +` |
|
`× 400 +` |
|
`× 200 +` |
|
`× 1400 = 460` |
The state matrix describing the highway maintenance schedule for the nth year after 2018 is given by
`S_(n + 1) = TS_n`
--- 0 WORK AREA LINES (style=lined) ---
`qquad qquad S_1 = [(460),(text{____}),(text{____}),(1490)]{:(G),(R),(S),(N):}`
--- 3 WORK AREA LINES (style=lined) ---
--- 4 WORK AREA LINES (style=lined) ---
Julie deposits some money into a savings account that will pay compound interest every month. The balance of Julie’s account, in dollars, after `n` months, `V_n` , can be modelled by the recurrence relation shown below. `V_0 = 12\ 000, qquad V_(n + 1) = 1.0062 V_n` --- 1 WORK AREA LINES (style=lined) --- --- 3 WORK AREA LINES (style=lined) --- --- 3 WORK AREA LINES (style=lined) --- --- 0 WORK AREA LINES (style=lined) --- --- 1 WORK AREA LINES (style=lined) ---
After how many months will the balance of Julie’s account first exceed $12 300? (1 mark)
Balance =
×
`n`
What would be the value of `n` if Julie wanted to determine the value of her investment after three years? (1 mark)
The congestion level in a city can be recorded as the percentage increase in travel time due to traffic congestion in peak periods (compared to non-peak periods).
This is called the percentage congestion level.
The percentage congestion levels for the morning and evening peak periods for 19 large cities are plotted on the scatterplot below.

Write your answers in the appropriate boxes provided below. (2 marks)
--- 0 WORK AREA LINES (style=lined) ---
| Median percentage congestion level for morning peak period |
%
|
| Median percentage congestion level for evening peak period |
%
|
A least squares line is to be fitted to the data with the aim of predicting evening congestion level from morning congestion level.
The equation of this line is.
evening congestion level = 8.48 + 0.922 × morning congestion level
--- 1 WORK AREA LINES (style=lined) ---
--- 2 WORK AREA LINES (style=lined) ---
--- 4 WORK AREA LINES (style=lined) ---
--- 2 WORK AREA LINES (style=lined) ---
The data in Table 1 relates to the impact of traffic congestion in 2016 on travel times in 23 cities in the United Kingdom (UK). The four variables in this data set are: --- 1 WORK AREA LINES (style=lined) --- --- 1 WORK AREA LINES (style=lined) --- --- 1 WORK AREA LINES (style=lined) --- --- 0 WORK AREA LINES (style=lined) --- --- 3 WORK AREA LINES (style=lined) --- Traffic congestion can lead to an increase in travel times in cities. The dot plot and boxplot below both show the increase in travel time due to traffic congestion, in minutes per day, for the 23 UK cities. --- 1 WORK AREA LINES (style=lined) --- --- 3 WORK AREA LINES (style=lined) ---


a. `3\-text(city, congestion level, size)` b. `2\-text(congestion level, size)` c. `text(Newcastle-Sunderland and Liverpool)` g. `IQR = 39-30 = 9` `text(Calculate the Upper Fence:)`Show Worked Solution
d.

e.
`text(Percentage)`
`= text(Number of small cities high congestion)/text(Number of small cities) xx 100`
`= 4/16 xx 100`
`= 25 text(%)`
f. `text(Positively skewed)`
`Q_3 + 1.5 xx IQR`
`= 39 + 1.5 xx 9`
`= 52.5`
Five people, India (`I`), Jackson (`J`), Krishna (`K`), Leanne (`L`) and Mustafa (`M`), competed in a table tennis tournament.
Each competitor played every other competitor once only.
Each match resulted in a winner and a loser.
The matrix below shows the tournament results.
`{:(),(),(),(),(text(winner)),(),():}{:(),(),(I),(J),(K),(L),(M):}{:(qquadqquadqquadtext(loser)),(qquadIquadJquadKquadLquadM),([(0,1,0,1,0),(0,0,1,0,1),(1,0,0,1,1),(0,1,0,0,0),(0,0,0,1,0)]):}`
A 1 in the matrix shows that the competitor named in that row defeated the competitor named in that column.
For example, the 1 in the fourth row shows that Leanne defeated Jackson.
A 0 in the matrix shows that the competitor named in that row lost to the competitor named in that column.
There is an error in the matrix. The winner of one of the matches has been incorrectly recorded as a 0.
This match was between
Which one of the following matrices has a determinant of zero?
| A. | `[(0,1),(1,0)]` | B. | `[(1,0),(0,1)]` | C. | `[(1,2),(−3,6)]` |
| D. | `[(3,6),(2,4)]` | E. | `[(4,0),(0,−2)]` |
The value of an annuity investment, in dollars, after `n` years, `V_n` , can be modelled by the recurrence relation shown below.
`V_0 = 46\ 000, quadqquadV_(n + 1) = 1.0034V_n + 500`
Part 1
What is the value of the regular payment added to the principal of this annuity investment?
Part 2
Between the second and third years, the increase in the value of this investment is closest to
The table below shows the monthly profit, in dollars, of a new coffee shop for the first nine months of 2018.

Using four-mean smoothing with centring, the smoothed profit for May is closest to
The pulse rates of a population of Year 12 students are approximately normally distributed with a mean of 69 beats per minute and a standard deviation of 4 beats per minute.
Part 1
A student selected at random from this population has a standardised pulse rate of `z = –2.5`
This student’s actual pulse rate is
Part 2
Another student selected at random from this population has a standardised pulse rate of `z=–1.`
The percentage of students in this population with a pulse rate greater than this student is closest to
Part 3
A sample of 200 students was selected at random from this population.
The number of these students with a pulse rate of less than 61 beats per minute or greater than 73 beats per minute is closest to
`text(Part 1)`
| `ztext(-score)` | `= (x – barx)/s` |
| `−2.5` | `= (x – 69)/4` |
| `x – 69` | `= −10` |
| `:. x` | `= 59` |
`=> A`
`text(Part 2)`
`ztext(-score) = −1`

| `text(% above)` | `= 34 + 50` |
| `= 84 text(%)` |
`=> E`
`text(Part 3)`
| `z-text(score)\ (61)` | `= (61 – 69)/4 = −2` |
| `z-text(score)\ (73)` | `= (73 – 69)/4 = 1` |

| `text(Percentage)` | `= 2.5 + 16` |
| `= 18.5text(%)` |
| `:.\ text(Number of students)` | `= 18.5 text(%) xx 200` |
| `= 37` |
`=> B`
The dot plot below displays the difference in travel time between the morning peak and the evening peak travel times for the same journey on 25 days.

Part 1
The percentage of days when there was five minutes difference in travel time between the morning peak and the evening peak travel times is
Part 2
The median difference in travel time is
Murray is building a new garage. The project involves activities `A` to `L`.

The network diagram shows these activities and their completion times in days.
--- 2 WORK AREA LINES (style=lined) ---
--- 4 WORK AREA LINES (style=lined) ---
--- 1 WORK AREA LINES (style=lined) ---
a. `text(Activity)\ C\ text(and)\ D.`
| b. |  |
`text(Critical path)\ \ A – D – G – L`
`= 1 + 10 + 13 + 6`
`= 30\ text(days)`
c. `text(Float time of Activity)\ E`
`= 14 – 8`
`= 6\ text(days)`
In central Queensland, there are four petrol stations `A`, `B`, `C` and `D`. The table shows the length, in kilometres, of roads connecting these petrol stations.

--- 5 WORK AREA LINES (style=lined) ---
Calculate the shortest distance that can be travelled by the petrol tanker. In your answer, include the order the petrol stations are refilled. (2 marks)
--- 4 WORK AREA LINES (style=lined) ---

| a. | |
b. `text(Shortest Path from)\ A\ (text(visiting all stations)):`
`A – B – D – C`
`text(Distance)= 170 + 90 + 120= 380\ text(km)`
This diagram shows the possible paths (in km) for laying gas pipes between various locations.

Gas is be supplied from one location. Any one of the locations can be the source of the supply.
What is the minimum total length of the pipes required to provide gas to all the locations?
`text(Using Kruskul’s Theorem:)`
`=>\ text(5 vertices – 4 edges needed)`
`text{Edge 1: The Hill → Carnie (9)}`
`text{Edge 2: Carnie → Bally (10)}`
`text{Edge 3: Bally → Eden (13)}`
`text{Edge 4: Carnie → Shallow End (14)}`

`text(Minimum length)= 9 + 10 + 13 + 14= 46\ text(km)`
`=>A`
A weighted network diagram is shown below.

What is the weight of the minimum spanning tree?
`text(One Strategy – Using Kruskal’s Algorithm:)`
`text(There are 5 vertices, so we need 4 edges.)`

`:.\ text(Weight)= 4 + 4 + 5 + 6= 19`
`=>B`
Bert is in Moscow, which is three hours behind of Coordinated Universal Time (UTC).
Karen is in Sydney, which is eleven hours ahead of UTC.
--- 2 WORK AREA LINES (style=lined) ---
--- 4 WORK AREA LINES (style=lined) ---
Blood pressure is measured using two numbers: systolic pressure and diastolic pressure. If the measurement shows 120 systolic and 80 diastolic, it is written as 120/80.
The bars on the graph show the normal range of blood pressure for people of various ages.

--- 4 WORK AREA LINES (style=lined) ---

--- 6 WORK AREA LINES (style=lined) ---
Part of a train timetable is shown.

Kalyn arrives at New Castle station at 1.25 pm and needs to get to Gosford as quickly as possible.
Assuming all trains run to schedule, what is the EARLIEST time that Kalyn can arrive at Gosford station?
Part of the graph of `y = 1/2 tan^(-1)(x)` is shown below.

The equations of its asymptotes are
A. `y = +- 1/2`
B. `y = +- 3/4`
C. `y = +- 1`
D. `y = +- pi/2`
E. `y = +- pi/4`
A cockroach is measured in a school science experiment and its length is recorded as 5.2 cm.
What is the upper limit of accuracy of this measurement?
In which triangle is `sin theta = 4/7`?
| A. |  |
B. |  |
| C. |  |
D. |  |
`=>\ text(D)`
There are 8 male chimpanzees in a community of 24 chimpanzees.
What is the ratio of males to females in the community?
The population of Indian Myna birds in a suburb can be described by the exponential function
`N = 35e^(0.07t)`
where `t` is the time in months.
--- 3 WORK AREA LINES (style=lined) ---
--- 8 WORK AREA LINES (style=lined) ---

i. `N = 35e^(0.07t)`
`text(Find)\ N\ text(when)\ \ t = 24:`
| `N` | `= 35e^(0.07 xx 24)` |
| `= 35e^(1.68)` | |
| `= 187.79…` | |
| `= 188\ text(birds)` |
ii.
The displacement `x` metres from the origin at time `t` seconds of a particle travelling in a straight line is given by
`x = 2t^3-t^2-3t + 11` when `t >= 0`
--- 2 WORK AREA LINES (style=lined) ---
--- 4 WORK AREA LINES (style=lined) ---
--- 6 WORK AREA LINES (style=lined) ---
--- 5 WORK AREA LINES (style=lined) ---
--- 6 WORK AREA LINES (style=lined) ---
--- 3 WORK AREA LINES (style=lined) ---
Given `cot theta = −24/7` for `−pi/2 < theta < pi/2`, find the exact value of
--- 4 WORK AREA LINES (style=lined) ---
--- 1 WORK AREA LINES (style=lined) ---
a. `cot theta = −24/7\ \ =>\ \ tan theta=– 7/24`
`text(Graphically, given)\ −pi/2 < theta < pi/2:`

`x= sqrt(24^2 + 7^2)=25`
`sectheta= 1/(costheta)= 1/(24/25)= 25/24`
b. `sintheta = −7/25`
Damon owns a swim school and purchased a new pool pump for $3250.
He writes down the value of the pool pump by 8% of the original price each year.
--- 1 WORK AREA LINES (style=lined) ---
--- 8 WORK AREA LINES (style=lined) ---
a. `text(Depreciation each year)= 8text(%) xx 3250= $260`
`:.\ text(Value) = 3250-260t`
b.

`text(Find)\ \ t\ \ text(when value = 0)`
| `3250-260t` | `= 0` |
| `t` | `= 3250/260= 12.5\ text(years)` |
`text(Domain)\ \ {t: 0 <= t <= 12.5}`
`text(Range)\ \ {y: 0 <= y <= 3250}`
Ita publishes and sells calendars for $25 each. The cost of producing the calendars is $8 each plus a set up cost of $5950.
How many calendars does Ita need to sell to breakeven? (2 marks)
--- 5 WORK AREA LINES (style=lined) ---
Worker A picks a bucket of blueberries in `a` hours. Worker B picks a bucket of blueberries in `b` hours.
--- 3 WORK AREA LINES (style=lined) ---
--- 2 WORK AREA LINES (style=lined) ---
A tank is initially full. It is drained so that at time `t` seconds the volume of water, `V`, in litres, is given by
`V = 50(1 - t/80)^2` for `0 <= t <= 100`
--- 2 WORK AREA LINES (style=lined) ---
--- 4 WORK AREA LINES (style=lined) ---
--- 4 WORK AREA LINES (style=lined) ---
Find the exact value of `sin\ pi/12`. (2 marks)
If `costheta = −3/4` and `0 < theta < pi`,
determine the exact value of `tantheta`. (2 marks)
--- 5 WORK AREA LINES (style=lined) ---
`text(Consider the angle graphically:)`

`text(S)text(ince)\ \ costheta\ \ text(is negative ⇒ 2nd quadrant.)`
`text(Using Pythagoras:)`
| `x^2` | `= 4^2-3^2` |
| `x` | `= sqrt7` |
`:. tan theta =-sqrt7/3`
Find `a` and `b` such that
`tan75^@ = a + bsqrt3` (2 marks)
--- 5 WORK AREA LINES (style=lined) ---
The parametric equations of a graph are
`x = 1-1/t`
`y = 1 + 1/t`
Sketch the graph. (2 marks)
--- 12 WORK AREA LINES (style=lined) ---

| `x` | `= 1-1/t\ \ …\ (1)` |
| `tx` | `= t-1` |
| `t(1-x)` | `= 1` |
| `t` | `= 1/(1-x)\ \ …\ (1^{′})` |
| `y` | `= 1 + 1/t\ \ …\ (2)` |
`text(Substitute)\ \ t = 1/(1-x)\ \ text{from}\ (1^{′})\ \text{into (2)}:`
`y= 1 + 1/(1/(1-x))= 1 + 1-x= 2-x`
The parametric equations of a graph are
`x = t^2`
`y = 1/t` for `t > 0`
--- 5 WORK AREA LINES (style=lined) ---
--- 8 WORK AREA LINES (style=lined) ---
a. `y = sqrt(1/x)`
b.

a. `x = t^2\ …\ (1)`
`y = 1/t\ …\ (2)`
`text(Substitute)\ \ t = 1/y\ \ text{from (1) into (1)}`
| `x` | `= (1/y)^2` |
| `y^2` | `= 1/x` |
| `y` | `= sqrt(1/x)\ \ \ (y > 0\ \ text(as)\ \ t > 0)` |
b.
Sketch the curve described by these two parametric equations
`x = 3cost + 2`
`y = 3sint-3` for `0 <= t < 2pi`. (3 marks)
--- 8 WORK AREA LINES (style=lined) ---

`(x-2) = 3cost, \ (y + 3) = 3sint`
| `(x-2)^2 + (y + 3)^2` | `= (3cost)^2 + (3sint)^2` |
| `= 9cos^2t + 9sin^2t` | |
| `= 9(cos^2t + sin^2t)` | |
| `= 9` |
`text(Sketch:) \ (x-2)^2 + (y + 3)^2 = 3^2`
Solve `3/(|\ x-3\ |) < 3`. (3 marks)
--- 6 WORK AREA LINES (style=lined) ---
`text(Solution 1)`
`3/(|\ x-3\ |) < 3`
| `|\ x-3\ |` | `> 1` |
| `(x^2-6x + 9)` | `> 1^2` |
| `x^2-6x + 8` | `> 0` |
| `(x-4)(x-2)` | `> 0` |

`:. {x: \ x < 2\ ∪\ x > 4}`
`text(Solution 2)`
`|\ x-3\ | > 1`
| `text(If)\ \ (x-3)` | `> 0,\ text(i.e.)\ x >3` |
| `x-3` | `> 1` |
| `x` | `> 4` |
`=> x > 4\ (text(satisfies both))`
| `text(If)\ \ (x-3)` | `< 0,\ text(i.e.)\ x <3` |
| `-(x-3)` | `> 1` |
| `-x + 3` | `> 1` |
| `x` | `< 2` |
`=> x < 2\ (text(satisfies both))`
`:. {x: \ x < 2\ ∪\ x > 4}`
A circle has centre `(5,3)` and radius 3.
--- 4 WORK AREA LINES (style=lined) ---
--- 8 WORK AREA LINES (style=lined) ---
a. `(x-5)^2 + (y-3)^2 < 9\ ∩\ y > 2`
b.

a. `text(Equation of circle:)`
`(x-5)^2 + (y-3)^2 = 3^2`
`:.\ text(Region is:)`
`(x-5)^2 + (y- 3)^2 < 9\ ∩\ y > 2`
COMMENT: The broken line on the graph represents an excluded boundary.
b.
Find the values of `x` that satisfy the equation
`x^2 + 8x + 3 <= 0`. (3 marks)
--- 6 WORK AREA LINES (style=lined) ---
| `x` | `= (-8 ± sqrt(8^2-4 · 1 · 3))/2` |
| `= (-8 ± sqrt(52))/2` | |
| `= -4 ± sqrt13` |

`{x:\ -4-sqrt13 <=x <= -4 + sqrt13}`
On an Argand diagram, a point that lies on the path defined by `|\ z - 2 + i\ | = |\ z - 4\ |` is
The implied domain of `f(x) = 2cos^(−1)(1/x)` is
`1/x ∈ [−1,1]`

`:. x ∈(−∞,−1] ∪ [1,∞)`
`=>C`
Let `f(x) = e^(-x^2)`. The diagram shows the graph `y = f(x)`.

Find the `x` coordinates of these points. (3 marks)
--- 6 WORK AREA LINES (style=lined) ---
--- 3 WORK AREA LINES (style=lined) ---
--- 5 WORK AREA LINES (style=lined) ---
--- 2 WORK AREA LINES (style=lined) ---
--- 5 WORK AREA LINES (style=lined) ---

| i. | `y` | `= e^(-x^2)` |
| `dy/dx` | `= -2x * e^(-x^2)` | |
| `(d^2y)/(dx^2)` | `= -2x (-2x * e^(-x^2)) + e ^(-x^2) (-2)` | |
| `= 4x^2 e^(-x^2)-2e^(-x^2)` | ||
| `= 2e^(-x^2) (2x^2-1)` |
`text(P.I. when)\ \ (d^2y)/(dx^2) = 0:`
| `2e^(-x^2) (2x^2-1)` | `= 0` |
| `2x^2-1` | `= 0` |
| `x^2` | `= 1/2` |
| `x` | `= +- 1/sqrt2` |
`text(If)\ x < 1/sqrt2\ =>\ (d^2y)/(dx^2) < 0,\ \ x > 1/sqrt2\ =>\ (d^2y)/(dx^2) > 0`
`=>\ text(Change of concavity)`
`:.\ text(P.I. at)\ \ x = 1/sqrt2`
`text(If)\ x < – 1/sqrt2\ =>\ (d^2y)/(dx^2) > 0,\ \ x > – 1/sqrt2\ =>\ (d^2y)/(dx^2) < 0`
`=>\ text(Change of concavity)`
`:.\ text(P.I. at)\ \ x = -1/sqrt2`
ii. `text(In)\ f(x), text(there are 2 values of)\ y\ text(for each value of)\ x.`
`:.\ text(The domain of)\ f(x)\ text(must be restricted for)\ f^(-1) (x)\ text(to exist).`
iii. `y = e^(-x^2)`
`text(Inverse function can be written)`
| `x` | `= e^(-y^2),\ \ \ x >= 0` |
| `lnx` | `= ln e^(-y^2)` |
| `-y^2` | `= lnx` |
| `y^2` | `= -lnx` |
| `y^2` | `=ln(1/x)` |
| `y` | `= +- sqrt(ln (1/x))` |
`text(Restricting)\ \ x>=0\ \ =>\ \ y>=0`
`:. f^(-1) (x)=sqrt(ln (1/x))`
| iv. | `f(0) = e^0 = 1` |
`:.\ text(Range of)\ \ f(x)\ \ text(is)\ \ 0 < y <= 1`
`:.\ text(Domain of)\ \ f^(-1) (x)\ \ text(is)\ \ 0 < x <= 1`
v.
The diagram below shows a sketch of the graph of `y = f(x)`, where `f(x) = 1/(1 + x^2)` for `x ≥ 0`.

--- 1 WORK AREA LINES (style=lined) ---
--- 5 WORK AREA LINES (style=lined) ---
Let `alpha` be the `x`-coordinate of `P`. Explain why `alpha` is a root of the equation `x^3 + x-1 = 0`. (1 mark)
--- 4 WORK AREA LINES (style=lined) ---
| i. |
|
ii. `text(Domain of)\ f^(−1)(x)\ text(is)\ \ 0 < x ≤ 1`
iii. `f(x) = 1/(1 + x^2)`
`text(Inverse: swap)\ \ x↔y`
| `x` | `= 1/(1 + y^2)` |
| `x(1 + y^2)` | `= 1` |
| `1 + y^2` | `= 1/x` |
| `y^2` | `= 1/x-1` |
| `y^2` | `= (1-x)/x` |
| `y` | `= sqrt((1-x)/x), \ \ y >= 0` |
iv. `P\ \ text(occurs when)\ \ f(x)\ \ text(cuts)\ \ y = x`
`text(i.e. where)`
| `1/(1 + x^2)` | `= x` |
| `1` | `= x(1 + x^2)` |
| `1` | `= x + x^3` |
| `x^3 + x-1` | `= 0` |
`=>\ text(S)text(ince)\ alpha\ text(is the)\ x\ text(-coordinate of)\ P,`
`text(it is a root of)\ \ \ x^3 + x-1 = 0`
Given `f(x) = sqrt (x^2 - 9)` and `g(x) = x + 5`
--- 4 WORK AREA LINES (style=lined) ---
--- 6 WORK AREA LINES (style=lined) ---
| a. | `f(g(x))` | `= sqrt {(x + 5)^2 – 9}` |
| `= sqrt (x^2 + 10x + 16)` | ||
| `= sqrt {(x + 2) (x + 8)}` |
`:. c = 2, d = 8 or c = 8, d = 2`
b. `text(Find)\ x\ text(such that:)`
`(x+2)(x+8) >= 0`

`(x + 2) (x + 8) >= 0\ \ text(when)`
`x <= -8 or x >= -2`
`:.\ text(Domain:)\ \ x<=-8\ \ and\ \ x>=-2`
