At the local bakery, the cost of four donuts and six buns is $14.70.
The cost of three donuts and five buns is $11.90.
At this bakery, the cost of one donut and two buns will be
A. `$2.80`
B. `$3.80`
C. `$3.85`
D. `$4.55`
E. `$4.85`
Aussie Maths & Science Teachers: Save your time with SmarterEd
At the local bakery, the cost of four donuts and six buns is $14.70.
The cost of three donuts and five buns is $11.90.
At this bakery, the cost of one donut and two buns will be
A. `$2.80`
B. `$3.80`
C. `$3.85`
D. `$4.55`
E. `$4.85`
`D`
`text(Let)\ x = text(cost of doughnuts)`
`text(Let)\ y = text(cost of buns)`
`4x + 6y = $14.70\ \ \ …\ (1)`
`3x + 5y = $11.90\ \ \ …\ (2)`
`text(Multiply)\ (1) xx 3\ text(and)\ (2) xx 4`
`12x + 18y = 44.10\ \ \ …\ (3)`
`12x + 20y = 47.60\ \ \ …\ (4)`
`(4) − (3)`
`2y` | `= 3.50` |
`y` | `= $1.75` |
`text(Substitute)\ \ y= $1.75\ text(into)\ (1)`
`4x + 6(1.75)` | `= 14.70` |
`4x` | `= 4.20` |
`x` | `= 1.05` |
`:.\ text(C)text(ost of 1 doughnut and 2 buns)`
`= 1.05 + 2 xx 1.75`
`= $4.55`
`=> D`
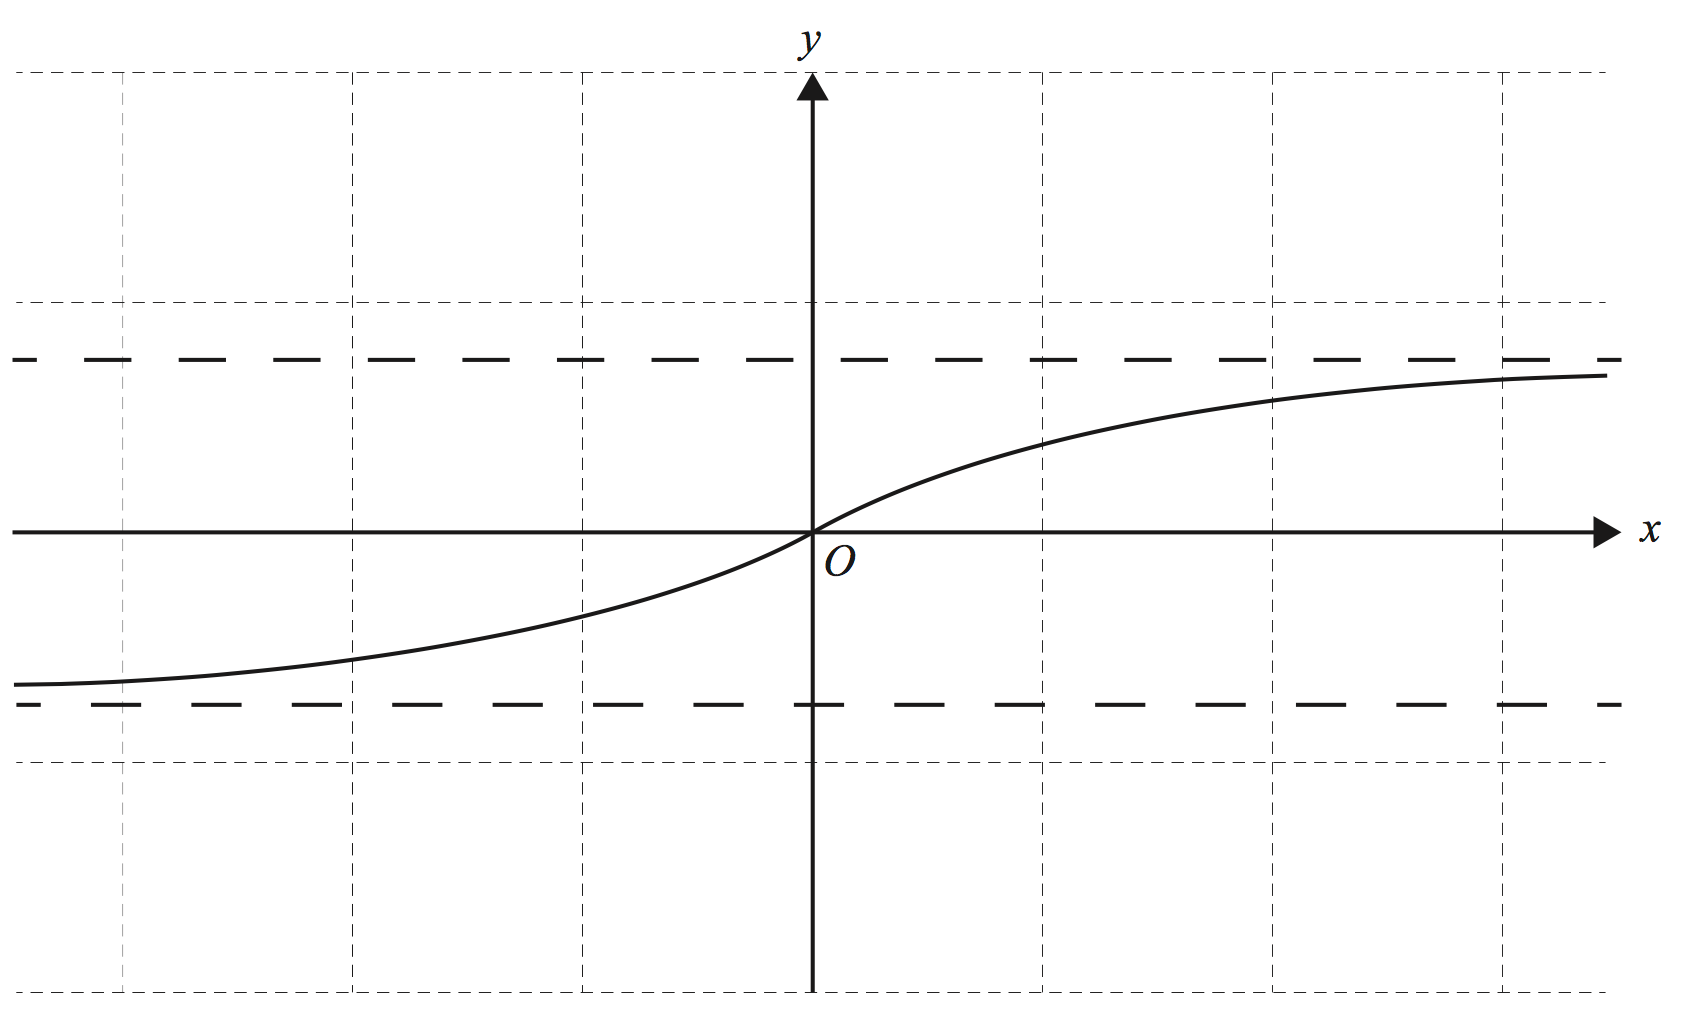
The graph below shows the time `t`, in hours, taken to travel 100 km at an average speed of `s` km/h.
Which statement is false?
`C`
`text(Using the formula)`
`text(distance = speed)\ xx\ text(time,)`
`A, B, D\ text(and)\ E\ text(are correct.)`
`text(However, as shown by the curved graph, the)`
`text(relationship between)\ t\ text(and)\ s\ text(is NOT linear.)`
`=> C`
Fiona and John are planning to hold a fund-raising event for cancer research. They can hire a function room for $650 and a band for $850. Drinks will cost them $25 per person.
--- 1 WORK AREA LINES (style=lined) ---
--- 2 WORK AREA LINES (style=lined) ---
i. | `text(Fixed C) text(osts)` | `= 650 + 850` |
`= $1500` |
`text(Variable C) text(osts) = $25x`
`:.\ $C = 1500 + 25x`
ii. | `text(From the graph)` |
`text(C) text(osts = Income when)\ x = 60` | |
`text{(i.e. where graphs intersect)}` |
iii. `text(When)\ \ x = 80:`
`text(Income)` | `= 80 xx 50` | |
`= $4000` |
`$C` | `= 1500 + 25 xx 80` |
`= $3500` |
`:.\ text(Profit)` | `= 4000 – 3500` |
`= $500` |
The length of a type of ant is approximately normally distributed with a mean of 4.8 mm and a standard deviation of 1.2 mm.
A standardised ant length of `z\ text(= −0.5)` corresponds to an actual ant length of
A. ` text(2.4 mm)`
B. `text(3.6 mm)`
C. `text(4.2 mm)`
D. `text(5.4 mm)`
`C`
`z` | `= \ \ (x – mu)/sigma` |
`-0.5` | `= \ \ (x – 4.8)/1.2` |
`-0.6` | `= \ \ x – 4.8` |
`x` | `= \ \ 4.2\ text(mm)` |
`=>C`
Solve `9^x-10(3^x)+9=0` (2 marks)
`x=0\ \ text(or)\ \ 2`
`9^x-10(3^x)+9` | `=0` |
`(3^2)^x-10(3^x)+9` | `=0` |
`(3^x)^2-10(3^x)+9` | `=0` |
`text(Let)\ X=3^x` | |
`:.\ X^2-10X+9` | `=0` |
`(X-9)(X-1)` | `=0` |
`X` | `=9` | `\ \ \ \ \ \ \ \ \ \ ` | `X` | `=1` |
`3^x` | `=9` | `\ \ \ \ \ \ \ \ \ \ ` | `3^x` | `=1` |
`x` | `=2` | `\ \ \ \ \ \ \ \ \ \ ` | `x` | `=0` |
`:.x=0\ \ text(or)\ \ 2`
Express the recurring decimal `0.323232...` as a fraction. (2 marks)
--- 5 WORK AREA LINES (style=lined) ---
`32/99`
`0.3232…` | `=32/100+32/10^4+32/10^6+…` |
`=32/100(1+1/10^2+1/10^4+…)` | |
`=>\ text(GP where)\ a=1,\ \ r=1/10^2` | |
`=32/100(a/(1-r))` | |
`=32/100(1/(1-1/100))` | |
`=32/100(1/(99/100))` | |
`=32/99` |
Brian, a landscaping contractor, charges by the hour for his company’s services.
To complete a particular job, he will have to use three workers and pay each of them $20 per hour. The fixed costs for the job are $150 and it will take four hours to complete the job.
To break even on this job, his hourly charge to the client should be
A. `$38.25`
B. `$57.50`
C. `$97.50`
D. `$127.50`
E. `$132.50`
`C`
`text(Fixed Cost)` | `= $150` |
`text(Labour Cost)` | `= $20 xx 3 xx 4` |
`= $240` | |
`text(Total Cost)` | `= 150 + 240` |
`= $390` |
`:.\ text(Breakeven Hourly Charge)`
`=(text(Total C) text(ost))/text(Job Hours)` | |
`= 390/4` | |
`= $97.50` |
`=> C`
A school’s squash and volleyball teams plan to enter a sports competition.
A squash team requires at least 4 players.
A volleyball team requires at least 6 players.
No more than 25 students from any one school can enter the competition.
Let `x` be the number of squash players sent by the school to the competition.
Let `y` be the number of volleyball players sent by the school to the competition.
The constraints above define the feasible region shaded in the graph below.
A fee is charged for all players entering the competition. Squash players are charged $5 and volleyball players are charged $4.
Given the above constraints, the maximum cost for the school’s squash and volleyball teams to enter the competition is
A. `$44`
B. `$104`
C. `$119`
D. `$121`
E. `$144`
`C`
`text(S)text(ince squash players pay a higher fee, the)`
`text(maximum cost occurs when the maximum)`
`text(number of squash players enter, which is 19)`
`text{(from the graph).}`
`:.\ text(Max cost)` | `= 19 xx $5 + 6 × $4` |
`= $119` |
`=> C`
Kathy is a tutor who offers tutorial sessions for English and History students.
Part 1
An English tutorial session takes 1.5 hours.
A History tutorial session take 30 minutes.
Kathy has no more than 15 hours available in a week for tutorial sessions.
Let `x` represent the number of English tutorial sessions Kathy has each week.
Let `y` represent the number of History tutorial sessions Kathy has each week.
An inequality representing the constraint on Kathy’s tutorial time each week (in hours) is
A. `1.5x + 30y = 15`
B. `1.5x + 30y >= 15`
C. `1.5x + 30y <= 15`
D. `1.5x + 0.5y >= 15`
E. `1.5x + 0.5y <= 15`
Part 2
Kathy prefers to have no more than 18 tutorial sessions in total each week.
She prefers to have at least 4 English tutorial sessions.
She also prefers to have at least as many History tutorial sessions as English tutorial sessions.
Let `x` represent the number of English tutorial sessions Kathy has each week.
Let `y` represent the number of History tutorial sessions Kathy has each week.
The shaded region that satisfies all of these constraints is
`text(Part 1:)\ E`
`text(Part 2:)\ D`
`text(Part 1)`
`text(English tutorial time)` | `= 1.5x\ text(hours)` |
`text(History tutorial time)` | `= 30y\ text(minutes)` |
`= 0.5y\ text(hours)` |
`text(Kathy has no more than 15 hours available,)`
`:.\ 1.5x + 0.5y <= 15`
`=> E`
`text(Part 2)`
`text(The constraints can be given by:)`
`x+y` | `<=18` |
`y` | `>=4` |
`y` | `>=x` |
`=> D`
The graph below shows the water temperature in a fish tank over a 12-hour period.
Part 1
Over the 12-hour period, the temperature of the tank is increasing most rapidly
A. during the first 2 hours.
B. from 2 to 4 hours.
C. from 4 to 6 hours.
D. from 6 to 8 hours.
E. from 8 to 10 hours.
Part 2
The fish tank is considered to be a safe environment for a type of fish if the water temperature is maintained between 24°C and 28°C.
Over the 12-hour period, the length of time (in hours) that the environment was safe for this type of fish was closest to
A. `1.5`
B. `5.0`
C. `7.0`
D. `8.5`
E. `10.5`
Part 3
The graph below can be used to determine the cost (in cents) of heating the fish tank during the first five hours of heating.
The cost of heating the tank for one hour is
A. `4\ text(cents.)`
B. `5\ text(cents.)`
C. `15\ text(cents.)`
D. `20\ text(cents.)`
E. `100\ text(cents.)`
`text(Part 1:)\ B`
`text(Part 2:)\ C`
`text(Part 3:)\ A`
`text(Part 1)`
`text(The steepest part of the curve from the choices)`
`text(given is the 2 to 4 hour period. Therefore, the)`
`text(temperature increases the most during this)`
`text(period.)`
`=> B`
`text(Part 2)`
`text{The curve is between 24 and 28 (on the}`
` y\ text{axis) during the following periods:}`
`3.5\ text(to)\ 7.75` | `= 4.25\ text(hours)` |
`9.5\ text(to)\ 12` | `= 2.5\ text(hours) ` |
`:.\ text(Environment was safe for 6.75 hours)`
`=> C`
`text(Part 3)`
`text(C)text(ost of heating for 5 hours = 20 cents)`
`:.\ text(C)text(ost of 1 hour)` | `= 20/5` |
`= 4\ text(cents) ` |
`=> A`
In the diagram, `AD = 9\ text(cm), AC = 24\ text(cm) and DB = 27\ text(cm.)`
Line segments `AC` and `DE` are parallel.
The length of `DE` is
A. `6\ text(cm)`
B. `8\ text(cm)`
C. `12\ text(cm)`
D. `16\ text(cm)`
E. `18\ text(cm)`
`E`
`/_CAD = /_EDB\ \ \ text{(} text(corresponding angles,)\ AC\ text(||)\ DE text{)}`
`/_DBE\ text(is common)`
`:. Delta ACB\ text(|||)\ Delta DEB\ \ text{(equiangular)}`
`:.\ (DE)/(DB)` | `= (AC)/(AB)` | `\ \ \ text{(corresponding sides}` `\ \ \ \ text{of similar triangles)}` |
`(DE)/27` | `= 24/36` | |
`DE` | `= (24 xx 27)/36` | |
`= 18\ text(cm)` |
`=> E`
The rectangular box shown in this diagram is closed at the top and at the bottom.
It has a volume of 6 m³.
The base dimensions are 1.5 m × 2 m.
The total surface area of this box is
A. `10\ text(m²)`
B. `13\ text(m²)`
C. `13.5\ text(m²)`
D. `20\ text(m²)`
E. `27\ text(m²)`
`D`
`V` | `= text(Area of base) xx text(height)\ (h)` |
`6` | `= 1.5 xx 2 xx h` |
`6` | `= 3h` |
`:. h` | `= 2\ text(m)` |
`:.\ text(Surface Area of box)`
`= 2 xx (1.5 xx 2) + 2 xx (1.5 xx 2) + 2(2 xx 2)`
`= 6 + 6 + 8`
`= 20\ text(m²)`
`=> D`
A piece of plaster has a uniform cross-section, which has been shaded, and has dimensions as shown.
(i) |
`A` | `= h/3 [y_0 +4y_1 + y_2]\ text(… applied twice)` |
`= 3.6/3 (5 + 4 xx 4.6 + 3.7) + 3.6/3 (3.7 + 4 xx 2.8 + 0)` | |
`= 32.52 + 17.88` | |
`= 50.4\ text(cm²)` |
(ii) `text(Total Area) = 7480.8\ text(cm²)`
`text(Area of Base)` | `= 14.4 xx 200` |
`= 2880\ text(cm²)` |
`text(Area of End)` | `= 5 xx 200` |
`= 1000\ text(cm²)` |
`text(Area of sides)` | `= 2 xx 50.4\ \ \ text{(from (i))}` |
`= 100.8\ text(cm²)` |
`:.\ text(Area of curved surface)`
`= 7480.8 – (2880 + 1000 + 100.8)`
`= 3500\ text(cm²)`
The building shown in the diagram is 8 m wide and 24 m long.
The side walls are 4 m high.
The peak of the roof is 6 m vertically above the ground.
In cubic metres, the volume of this building is
A. `384`
B. `576`
C. `960`
D. `1152`
E. `4608`
`C`
A steel beam used for constructing a building has a cross-sectional area of 0.048 m2 as shown.
The beam is 12 m long.
In cubic metres, the volume of this steel beam is closest to
A. `0.576`
B. `2.5`
C. `2.63`
D. `57.6`
E. `2500`
`A`
`text(Volume)` | `= A xx h` |
`= 0.048 xx 12` | |
`= 0.576\ text(m³)` |
`=> A`
A rectangle is 3.79 m wide and has a perimeter of 24.50 m.
Correct to one decimal place, the length of the diagonal of this rectangle is
A. `9.2\ text(m)`
B. `9.3\ text(m)`
C. `12.2\ text(m)`
D. `12.3\ text(m)`
E. `12.5\ text(m)`
`B`
A regular hexagon has side length 3.0 cm and height 5.2 cm as shown in the diagram above.
The area (in cm²) of the hexagon is closest to
A. `11.7`
B. `13.5`
C. `15.6`
D. `18.0`
E. `23.4`
`E`
`text(Area of rectangle)` | `= 3.0 xx 5.2` |
`= 15.6\ text(cm²)` |
`text(Using Pythagoras to find)\ h:`
`3.0^2` | `= 2.6^2 + h^2` |
`h^2` | `= 9 – 6.76` |
`= 2.24` | |
`h` | `= 1.496…` |
`text(Area of)\ \ Delta ABC`
`= 1/2 xx b xx h`
`= 1/2 xx 5.2 xx 1.496…`
`= 3.891…\ text(cm²)`
`:.\ text(Area of hexagon)`
`= 15.6 + (2 xx 3.891…)`
`= 23.38…\ text(cm²)`
`=> E`
Sand is poured out of a truck and forms a pile in the shape of a right circular cone. The diameter of the base of the pile of sand is 2.6 m. The height is 1.2 m.
The volume (in m³) of sand in the pile is closest to
A. `2.1`
B. `3.1`
C. `6.4`
D. `8.5`
E. `25.5`
`A`
The solid cylindrical rod shown above has a volume of 490.87 cm3. The length is 25.15 cm.
The radius (in cm) of the cross-section of the rod, correct to one decimal place, is
A. `2.5`
B. `5.0`
C. `6.3`
D. `12.5`
E. `19.6`
`A`
`V = pir^2h`
`text(Where length) =h = 25.15\ text(cm)`
`:.\ 490.87` | `= pi xx r^2 xx 25.15` |
`r^2` | `= 490.87/(pi xx 25.15)` |
`= 6.2126…` | |
`:. r` | `= 2.492…\ text(cm)` |
`=> A`
Zilda needs to download an `8.3 text(MB)` file from the internet. If the download transfer rate is `5 text(kbps)`, how long will it take her to download the file (to the nearest minute)? (3 marks)
`232\ text(mins)\ text{(nearest minute)}`
`8.3 text(MB file)`
`= 8.3 xx 2^20\ text(bytes)`
`= 8.3 xx 2^20 xx 8\ text(bits)`
`text(Download speed is 5kbps)`
`= 5000\ text(bps)`
`:.\ text(Time to download)`
`= (8.3 xx 2^20 xx 8)/5000`
`= 13925.08…\ text(seconds)`
`= 232.08\ text(mins)`
`= 232\ text(mins)\ text{(nearest minute)}`
Consider the simultaneous linear equations below.
`4x - 2y = 18`
`3x + ky = 10` (3 marks)
where `k` is a real constant.
a. | `4x – 2y` | `=18` |
`y` | `=2x-9\ \ …\ (1)` |
`=> m_1 = 2,\ \ c_1=-9`
`3x +ky` | `=10` |
`y` | `=-3/k x +10/k\ \ …\ (2)` |
`=> m_2 = – 3/k,\ \ c_2=10/k`
`text(No solution if)\ \ m_1=m_2, and c_1!=c_2.`
`-3/k` | `=2` |
`k` | `=- 3/2` |
`text(When)\ \ k=-3/2, c_1!=c_2.`
`:.\ text(No solution when)\ \ k=-3/2.`
b. `text(A unique solution exists when)\ \ m_1 != m_2,`
`k in R\ text(\) {-3/2}`
Find the value of `R_1` if
`1/R = 1/R_1 + 1/R_2`, `R = 1.12` and `R_2 = 2.24` (2 marks)
`R_1 = 2.24`
`1/R` | `= 1/R_1 + 1/R_2` |
`1/1.12` | `= 1/R_1 + 1/2.24` |
`1/R_1` | `= 1/1.12 – 1/2.24` |
`= 2/2.24 – 1/2.24` | |
`= 1/2.24` | |
`:.\ R_1 = 2.24` |
A clubhouse uses four long-life light globes for five hours every night of the year. The purchase price of each light globe is $6.00 and they each cost `$d` per hour to run.
--- 4 WORK AREA LINES (style=lined) ---
--- 2 WORK AREA LINES (style=lined) ---
What is the mean life, in hours, of these light globes if 97.5% will last up to 5000 hours? (1 mark)
--- 2 WORK AREA LINES (style=lined) ---
i. `text(Purchase price) = 4 xx 6 = $24`
`text(Running cost)` | `= text(# Hours) xx text(Cost per hour)` |
`= 4 xx 5 xx 365 xx d` | |
`= 7300d` | |
`:.\ $c = 24 + 7300d` |
ii. `text(Given)\ \ $c = $250`
`250` | `= 24 + 7300d` |
`7300d` | `= 226` |
`d` | `= 226/7300` |
`= 0.03095…` | |
`= 0.031\ $ text(/hr)\ text{(3 d.p.)}` |
iii. `text(If)\ d\ text(doubles to 0.062)\ \ $text(/hr)`
`$c` | `= 24 + 7300 xx 0.062` |
`= $476.60` | |
`text(S) text(ince $476.60 is less than)\ 2 xx $250\ ($500),` | |
`text(the total cost increases to less than double)` | |
`text(the original cost.)` |
iv. `sigma = 170`
`z\ text(-score of 5000 hours) = 2`
`z` | `= (x – mu)/sigma` |
`2` | `= (5000 – mu)/170` |
`340` | `= 5000 – mu` |
`mu` | `= 4660` |
`:.\ text(The mean life of these globes is 4660 hours.)`
A rectangular playing surface is to be constructed so that the length is 6 metres more than the width.
--- 2 WORK AREA LINES (style=lined) ---
--- 1 WORK AREA LINES (style=lined) ---
A graph comparing the area of the playing surface to its length is shown.
--- 2 WORK AREA LINES (style=lined) ---
--- 4 WORK AREA LINES (style=lined) ---
Company `A` constructs playing surfaces.
Use the horizontal axis to represent the area and the vertical axis to represent the cost. (2 marks)
--- 8 WORK AREA LINES (style=lined) ---
Justify your answer with suitable calculations. (1 mark)
--- 2 WORK AREA LINES (style=lined) ---
`text{of 4 m (among many possibilities).}`
`text(the width, it follows that the length)`
`text(must be greater than 6 m.)`
i. `text(One possibility is a length of 10 m, and a width)`
`text{of 4 m (among many possibilities).}`
ii. `text(Length) = l\ text(m)`
`text(Width) = (l – 6)\ text(m)`
`:.\ A` | `= l (l – 6)` |
iii. `text(Given the length must be 6m more than the width,)`
`text(it follows that the length must be greater than 6 m)`
`text(so that the width is positive.)`
iv. `text(From the graph, an area of 135 m² corresponds to)`
`text(a length of 15 m.)`
`:.\ text(The dimensions would be 15 m × 9 m.)`
v. |
vi. `text(Company)\ A\ text(cost) = $50\ 000`
`text(Company)\ B\ text(cost)` | `= 135 xx 360` |
`= $48\ 600` |
`:.\ text(Company)\ B\ text(would charge $1400 less)`
`text(than Company)\ A.`
Myles is in his third year as an apprentice film editor.
After 3 years it has depreciated to $3635 using the straight-line method.
Calculate the rate of depreciation per year as a percentage. (2 marks)
--- 4 WORK AREA LINES (style=lined) ---
--- 2 WORK AREA LINES (style=lined) ---
--- 4 WORK AREA LINES (style=lined) ---
i. | `S = V_0 – Dn` |
`S = $3635,\ \ \ V_0 = 5000,\ \ \ n = 3` |
`3635` | `= 5000 – D xx 3` |
`3D` | `= 1365` |
`D` | `= $455` |
`:.\ text(Rate of depreciation per year)`
`= 455/5000 xx 100`
`= 9.1 text(%)`
ii. | `text(Income per year)` | `= 52 xx 800` |
`= $41\ 600` |
`text(Taxable income)` | `=\ text(Income – Deductions)` |
`= 41\ 600 – 455` | |
`= $41\ 145` |
iii. | `text(Tax payable)` | `= 4500 + 0.3(41\ 145 – 28\ 000)` |
`= 4500 + 3943.50` | ||
`= $8443.50` |
The diagram shows information about the locations of towns `A`, `B` and `Q`.
Calculate her walking speed correct to the nearest km/h. (1 mark)
--- 1 WORK AREA LINES (style=lined) ---
Find the distance from Town `A` to Town `B`. Give your answer to the nearest km. (2 marks)
--- 4 WORK AREA LINES (style=lined) ---
--- 2 WORK AREA LINES (style=lined) ---
i. `text(2 hrs 48 mins) = 168\ text(mins)`
`text(Speed)\ text{(} A\ text(to)\ Q text{)}` | `= 15/168` |
`= 0.0892…\ text(km/min)` |
`text(Speed)\ text{(in km/hr)}` | `= 0.0892… xx 60` |
`= 5.357…\ text(km/hr)` | |
`= 5\ text(km/hr)\ text{(nearest km/hr)}` |
ii. |
`text(Using cosine rule)`
`AB^2` | `= 15^2 + 10^2 – 2 xx 15 xx 10 xx cos 87^@` |
`= 309.299…` | |
`AB` | `= 17.586…` |
`= 18\ text(km)\ text{(nearest km)}` |
`:.\ text(The distance from Town)\ A\ text(to Town)\ B\ text(is 18 km.)`
iii |
`/_CAQ` | `= 31^@\ \ \ text{(} text(straight angle at)\ A text{)}` |
`/_AQD` | `= 31^@\ \ \ text{(} text(alternate angle)\ AC\ text(||)\ DQ text{)}` |
`/_DQB` | `= 87 – 31 = 56^@` |
`/_QBE` | `= 56^@\ \ \ text{(} text(alternate angle)\ DQ \ text(||)\ BE text{)}` |
`:.\ text(Bearing of)\ Q\ text(from)\ B`
`= 180 + 56`
`= 236^@`
The radius of a circle is 6.5 centimetres.
A square has the same area as this circle.
The length of each side of the square, in centimetres, is closest to
A. `6.4`
B. `10.2`
C. `11.5`
D. `23.0`
E. `33.2`
`C`
`text(Area of circle)` | `= pi r^2` |
`= pi xx 6.5^2` | |
`= 132.73…\ text(cm²)` |
`text(Area of square)` | ` = l^2` |
` l^2` | ` = 132.73…` |
`:. l` | ` = 11.52…\ text(cm)` |
`=> C`
The point `Q` on building `B` is visible from the point `P` on building `A`, as shown in the diagram above.
Building `A` is 16 metres taller than building `B`.
The horizontal distance between point `P` and point `Q` is 23 metres.
The angle of depression of point `Q` from point `P` is closest to
A. `35°`
B. `41°`
C. `44°`
D. `46°`
E. `55°`
`A`
A right pyramid, shown below, has a rectangular base with length 4 m and width 3 m.
The height of the pyramid is 2 m.
The angle `VCO` that the sloping edge `VC` makes with the base of the pyramid, to the nearest degree, is
A. `22°`
B. `27°`
C. `34°`
D. `39°`
E. `45°`
`D`
A greenhouse is built in the shape of a trapezoidal prism, as shown in the diagram above.
The cross-section of the greenhouse (shaded) is an isosceles trapezium. The parallel sides of this trapezium are 4 m and 10 m respectively. The two equal sides are each 5 m.
The length of the greenhouse is 12 m.
The five exterior surfaces of the greenhouse, not including the base, are made of glass.
The total area, in m², of the glass surfaces of the greenhouse is
A. `196`
B. `212`
C. `224`
D. `344`
E. `672`
`C`
`text(Area of trapezoid)\ =\ 1/2\ text(h)\ (a+b)`
`text(Using Pythagoras,)`
`h^2 + 3^2` | `= 5^2` |
`h^2` | `= 16` |
`h` | `= 4` |
`∴\ text{Area (trapezoid)}= 1/2 xx 4\ (10 + 4)= 28\ text(m²)`
`text(Area of side)` | `= 12 xx 5` | `= 60\ text(m²)` |
`text(Area of roof)` | `= 4 xx 12` | `= 48\ text(m²)` |
`∴\ text(Total area of glass surface)`
`= 2 xx (28 + 60) + 48`
`= 224\ text(m²)`
`=> C`
In triangle `MNR`, point `P` lies on side `MR` and point `Q` lies on side `NR`.
The lines `PQ` and `MN` are parallel.
The length of `RQ` is 4 cm, the length of `QN` is 6 cm and the length of `PQ` is 5 cm.
The length of `MN`, in cm, is equal to
A. `7.5`
B. `8.3`
C. `12.0`
D. `12.5`
E. `15.0`
`D`
`/_ PRQ\ \ text(is common)`
`/_ RPQ = /_ RMN\ \ (text{corresponding}\ PQ\ text{||}\ MN)`
`:. Delta RPQ\ text(|||)\ Delta RMN\ text{(equiangular)}`
`∴ (MN)/(RN)` | `= (PQ)/(RQ)` | `\ \ \ \ text{(corresponding sides of}` `\ \ \ \ \ text{similar triangles)}` |
`(MN)/10` | `= 5/4` | |
`:.MN` | `= 12.5\ text(cm)` |
`=> D`
The scale used on a map is `1:50\ 000`.
On this map, a distance of 4 km would be represented by
A. `2.0\ text(cm)`
B. `5.0\ text(cm)`
C. `8.0\ text(cm)`
D. `12.5\ text(cm)`
E. `20.0\ text(cm)`
`C`
`text(Map scale is)\ 1:50\ 000`
`∴\ text(On the map, 4 km)`
`= 4000/(50\ 000)\ text(m)`
`= 0.08\ text(m)`
`= 8\ text(cm)`
`=> C`
An orienteering course is triangular in shape and is marked by three points, `A`, `B` and `C`, as shown in the diagram below.
Part 1
In this course, the bearing of `B` from `A` is `050^@` and the bearing of `C` from `B` is `120^@`.
The bearing of `B` from `C` is
A. `060°`
B. `120°`
C. `240°`
D. `300°`
E. `310°`
Part 2
In this course, `B` is 7.0 km from `A`, ` C` is 8.0 km from `B` and `A` is 12.3 km from `C`.
The area (in km²) enclosed by this course is closest to
A. `21`
B. `24`
C. `25`
D. `26`
E. `28`
`text(Part 1:)\ D`
`text(Part 2:)\ D`
`text(Part 1)`
`text(Let)\ D\ text(be directly North of)\ C`
`/_ BCD = 60^@\ \ \ ` | `text{(cointerior, North South}` `\ \ text{lines are parallel)}` |
`∴ text(Bearing of)\ B\ text(from)\ C`
`= 360 − 60`
`= 300^@`
`=> D`
`text(Part 2)`
`text(Using cosine rule in)\ Delta ABC,`
`cos /_ BAC` | `= (7.0^2 + 12.3^2 − 8.0^2) / (2 xx 7.0 xx 12.3)` |
`= 0.7914…` | |
`/_ BAC` | `= 37.67…^@` |
`text(Using sine rule,)`
`text(Area of)\ Delta ABC` | `= 1/2 xx 7.0 xx 12.3 xx sin 37.67…^@` |
`= 26.31…\ text(km²)` |
`=> D`
The results of two class tests are normally distributed. The means and standard deviations of the tests are displayed in the table.
--- 5 WORK AREA LINES (style=lined) ---
--- 4 WORK AREA LINES (style=lined) ---
i. `text(In Test 1,)\ \ mu = 60,\ sigma = 6.2`
`z text(-score)\ (63)` | `= (x – mu)/sigma` |
`= (63 – 60)/6.2` | |
`= 0.483…` |
`text(In Test 2,)\ \ mu = 58,\ sigma = 6.0`
`z text(-score)\ (62)` | `= (62 – 58)/6.0` |
`= 0.666…` | |
`text(S) text(ince Stuart’s)\ z\ text(-score is higher in Test 2,)`
`text(his performance relative to the class is better)`
`text(despite his mark being slightly lower.)`
ii. `text(In Test 2)`
`z text(-score)\ (64)` | `= (64 – 58)/6` |
`= 1` |
`=> text(84% have)\ z text(-score) < 1`
`:.\ text(# Students expected below 64)`
`= text(84%) xx 150`
`= 126`
Give an example of an event that has a probability of exactly `3/4`. (1 mark)
--- 2 WORK AREA LINES (style=lined) ---
`text(Choosing a red ball out of a bag that)`
`text(contains 3 red balls and 1 green ball.)`
`text {(} text(An infinite amount of examples are)`
`text(possible) text{).}`
`text(Choosing a red ball out of a bag that contains)`
`text(3 red balls and 1 green ball.)`
`text {(} text(An infinite amount of examples are)`
`text(possible) text{).}`
Barry constructed a back-to-back stem-and-leaf plot to compare the ages of his students.
--- 2 WORK AREA LINES (style=lined) ---
--- 1 WORK AREA LINES (style=lined) ---
For the age group 30 - 39 years, what is the value of the product of the class centre and the frequency? (2 marks)
--- 3 WORK AREA LINES (style=lined) ---
Caitlyn correctly used the original data in the back-to-back stem-and-leaf plot and calculated the mean to be 38.2.
What is the reason for the difference in the two answers? (1 mark)
--- 2 WORK AREA LINES (style=lined) ---
i. | `text(More males attend than females and a higher proportion)` |
`text(of those are younger males, with the distribution being)` | |
`text(positively skewed. Female attendees are generally older)` | |
`text(and have a negatively skewed distribution.)` |
ii. | `text(Mode) = 64\ \ \ text{(4 times)}` |
iii. | `text(Class centre)` | `= (30 + 39)/2` |
`= 34.5` | ||
`text(Frequency) = 5` |
`:.\ text(Class centre) xx text(frequency)`
`= 34.5 xx 5`
`= 172.5`
iv. | `text(The difference in the answers is due to the class)` |
`text(centres used in group frequency tables distorting)` | |
`text(the mean value from the exact data.)` |
Sandy travels to Europe via the USA. She uses this graph to calculate her currency conversions.
She converts all of her money to euros.How many euros does she have to spend in Europe? (3 marks)
--- 6 WORK AREA LINES (style=lined) ---
--- 2 WORK AREA LINES (style=lined) ---
`text(A$, then 1 A$ will buy more euros than)`
`text(before and the gradient used to convert)`
`text{the currencies will steepen (increase).}`
i. `text(From graph:)`
`75\ text(US$)` | `=\ text(100 A$)` |
`=> 150\ text(US$)` | `=\ text(200 A$)` |
`:.\ text(Sandy has a total of 800 A$)`
`text(Converting A$ to €:)`
`text(100 A$)` | `= 60\ €` |
`:.\ text(800 A$)` | `= 8 xx 60` |
`= 480\ €` |
ii. `text(If the value of the euro falls against the)`
`text(A$, then 1 A$ will buy more euros than)`
`text(before and the gradient used to convert)`
`text{the currencies will steepen (increase).}`
Consider the following set of scores:
`3, \ 5, \ 5, \ 6, \ 8, \ 8, \ 9, \ 10, \ 10, \ 50.`
--- 1 WORK AREA LINES (style=lined) ---
--- 5 WORK AREA LINES (style=lined) ---
`text(would become lower.)`
`text(Median will NOT change.)`
i. `text(Total of scores)`
`= 3 + 5 + 5 + 6 + 8 + 8 + 9 + 10 + 10 +50`
`= 114`
`:.\ text(Mean) = 114/10 = 11.4`
ii. `text(Mean)`
`text{If the outlier (50) is removed, the mean}`
`text(would become lower.)`
`text(Median)`
`text(The current median (10 data points))`
`= text(5th + 6th)/2 = (8 + 8)/2 = 8`
`text(The new median (9 data points))`
`=\ text(5th value)`
`= 8`
`:.\ text(Median will NOT change.)`
A scientific study uses the ‘capture-recapture’ technique.
In the first stage of the study, 24 crocodiles were caught, tagged and released.
Later, in the second stage of the study, some crocodiles were captured from the same area. Eighteen of these were found to be tagged, which was 40% of the total captured during the second stage.
--- 2 WORK AREA LINES (style=lined) ---
--- 4 WORK AREA LINES (style=lined) ---
i. | `text(Let)\ C_1` | `=\ text(crocodiles captured in stage 1)` |
`C_2` | `=\ text(crocodiles captured in stage 2)` |
`C_1` | `=\ text(40%)\ xx C_2` |
`18` | `=\ text(40%)\ xx C_2` |
`:.\ C_2` | `= 18/0.4 = 45\ text(crocodiles)` |
ii. | `text(Capture) = 24/text(Population)` |
`text(Recapture) = 18/45`
`24/text(Population)` | `= 18/45` |
`:.\ text(Population)` | `= (24 xx 45)/18` |
`= 60` |
`ABCD` is a sloping rectangular roof above a horizontal rectangular ceiling, `TCDR`.
`AB` | `= DC` | `= 12\ text(metres)` |
`RD` | `= TC` | `= 3.8\ text(metres)` |
`AR` | `= BT` | `= 1.5\ text(metres)` |
Part 1
The angle of depression of `D` from `A` is closest to
A. `21.5^@`
B. `23.3^@`
C. `66.7^@`
D. `68.5^@`
E. `111.5^@`
Part 2
The angle `ACR` is closest to
A. `6.80^@`
B. `6.84^@`
C. `7.13^@`
D. `18.80^@`
E. `21.54^@`
`text(Part 1:)\ A`
`text(Part 2:)\ A`
`text(Part 1)`
`text(Let)\ theta =` | `text(Angle of Depression of)\ D\ text(from)\ A` |
`/_ADR` | `= theta\ text( (alternate,)\ AB \ text (||)\ RD)` |
`tan theta` | `= 1.5 / 3.8` |
`theta` | `= 21.54…^@` |
`=> A` |
`text(Part 2)`
`text(Find)\ x,`
`text(Using Pythagoras in)\ Delta RCD,`
`x^2` | `= 3.8^2 + 12^2` |
`= 158.44` | |
`x` | `= 12.587…\ text(m)` |
`text(In)\ Delta ACR,`
`tan /_ ACR` | `= 1.5 / (12.587…)` |
`/_ ACR` | `= 6.79…^@` |
`=> A`
A cylindrical water tank, of height 2 m, is placed in the ground at a school.
The radius of the tank is 3.78 metres. The hole is 2 metres deep. When the tank is placed in the hole there is a gap of 1 metre all the way around the side of the tank.
--- 6 WORK AREA LINES (style=lined) ---
The water tank holds 90 000 litres when full.
For how many hours can the sprinklers be used before a full tank is emptied? (1 mark)
--- 2 WORK AREA LINES (style=lined) ---
During a storm, 20 mm of rain falls on the roof and is collected in the tank.
How many litres of water were collected? (2 marks)
--- 4 WORK AREA LINES (style=lined) ---
i. `V = pi r^2 h\ \ \ \ text(where)`
`h = 2\ text(and)\ r = 4.78\ text(m)`
`:.\ V` | `= pi xx 4.78^2 xx 2` |
`= 143.56…` | |
`= 144\ text(m³)\ \ text{(nearest m³)}` |
ii. `text(Total water) = 90\ 000\ text(litres)`
`text(Usage) = 7500\ \ text(litres/hr)`
`:.\ text(Hours before it is empty)`
`= (90\ 000)/7500`
`= 12\ text(hours)`
iii. `text(Water collected)`
`= 400 xx 0.020`
`= 8\ text(m²)`
`= 8000\ text(litres)`
The locations of three towns, `Q`, `R` and `T`, are shown in the diagram above.
Town `T` is due south of town `R`.
The angle `TRQ` is `48^@`.
The bearing of town `R` from town `Q` is
A. `048^@`
B. `132^@`
C. `138^@`
D. `228^@`
E. `312^@`
`E`
A right triangular prism has a volume of 160 cm3.
A second right triangular prism is made with the same width, twice the height and three times the length of the prism shown.
The volume of the second prism (in cm3) is
A. `320`
B. `640`
C. `960`
D. `1280`
E. `1920`
`C`
`text(Volume of existing prism)\ (V)`
`= 1/2 xx b xx h xx l` | |
`= 160 \ text(cm³)` |
`text(Volume of new prism)\ (V_1)`
`= 1/2 xx b xx 2h xx 3l` | |
`= 6 xx 1/2 xx b xx h xx l` | |
`= 6 xx V` | |
`= 6 xx 160` | |
`= 960 \ text(cm³)` |
`=> C`
Lilly and Rose each have money to invest and choose different investment accounts.
The graph shows the values of their investments over time.
--- 1 WORK AREA LINES (style=lined) ---
--- 4 WORK AREA LINES (style=lined) ---
--- 2 WORK AREA LINES (style=lined) ---
`text{Rose 1 year longer (15 years) to reach the same value}`
i. `$5000\ text{(} y text(-intercept) text{)}`
ii. `text(After 6 years,)`
`text(Lilly’s investment)` | `= $9000` |
`text(Rose’s investment)` | `= $11\ 000` |
`:.\ text(Rose’s is worth $2000 more.)` |
iii. `text(It takes Lilly 14 years to reach $20 000 and it)`
`text{takes Rose 1 year longer (15 years) to reach the}`
`text(same value.)`
The difference equation `u_(n + 1) = 4u_n - 2` generates a sequence.
If `u_2 = 2`, then `u_4` will be equal to
A. 4
B. 8
C. 22
D. 40
E. 42
`C`
`u_(n+1)` | `= 4u_n – 2` | |
`∴ u_3` | `= 4u_2 – 2` | |
`= 4 xx 2 – 2\ \ text{(given}\ u_2 = 2 text{)}` | ||
`= 6` | ||
`∴ u_4` | `= 4u_3 – 2` | |
`= 4 xx 6 – 2` | ||
`= 22` |
`=> C`
The distance, `AC`, across a small lake can be calculated using the measurements shown in the diagram below.
In this diagram, `BCA` and `BDE` are right-angled triangles, where `CB = 40.4\ text(m), BD = 10\ text(m)` and `BE = 12\ text(m).`
The distance between the points `A` and `C`, in metres, is closest to
A. `22.4`
B. `26.8`
C. `33.6`
D. `48.5`
E. `177.8`
`B`
`/_ ABC = /_ DBE\ \ text{(vertically opposite angles)}`
`/_ ACB = /_ BDE = 90°\ \ text{(given)}`
`∴ Delta ABC\ \ text(|||)\ \ Delta EBD\ \ \ \ text{(equiangular)}`
`∴ (AB)/40.4` | `= 12/10` | `\ \ \ \ \ text{(corresponding sides}` `\ \ \ \ \ \ text{of similar triangles)}` |
`AB` | `= (12 xx 40.4)/10` | |
`= 48.48\ \ text(m)` |
`text(Using Pythagoras in)\ Delta ABC:`
`48.48^2` | `= x^2 + 40.4^2` |
`x^2` | `= 718.1504` |
`x` | `= 26.79\ text(m)` |
`=>B`
Let `P_2011` be the number of pairs of shoes that Sienna owns at the end of 2011.
At the beginning of 2012, Sienna plans to throw out the oldest 10% of pairs of shoes that she owned in 2011.
During 2012 she plans to buy 15 new pairs of shoes to add to her collection.
Let `P_2012` be the number of pairs of shoes that Sienna owns at the end of 2012.
A rule that enables `P_2012` to be determined from `P_2011` is
A. `P_2012 = 1.1 P_2011 + 15`
B. `P_2012 = 1.1 (P_2011 + 15)`
C. `P_2012 = 0.1 P_2011 + 15`
D. `P_2012 = 0.9 (P_2011 + 15)`
E. `P_2012 = 0.9 P_2011 + 15`
`E`
`text(By throwing out 10%, Sienna keeps 90% of her)`
`text{her 2011 shoes (or 0.9} \ P_2011 text{) and then adds 15.}`
`:. P_(2012) = 0.9\ P_2011 + 15`
`=> E`
The number of bees in a colony was recorded for three months and the results are displayed in the table below.
If this pattern of increase continues, which one of the following statements is not true.
A. There will be nine times as many bees in the colony in month 5 than in month 3.
B. In month 4, the number of bees will equal 270.
C. In month 6, the number of bees will equal 7290.
D. In month 8, the number of bees will exceed 20 000.
E. In month 10, the number of bees will be under 200 000.
`C`
`text(Sequence is 10, 30, 90, …)`
`text(GP where)\ \ \ a` | ` = 10, and` |
`r` | ` = t_2/t_1=30 / 10 = 3` |
`text(In A,)\ \ T_5 = 10 xx 3^4 and T_3 = 10 xx 3^2`
`:. T_5 = T_3 xx 3^2\ \ text{(True)}`
`text(In B,)\ \ T_4 = 10 xx 3^3 = 270\ \ text{(True)}`
`text(In C,)\ \ T_6 = 10 xx 3^5 = 2430\ \ text{(NOT true)}`
`text(In D,)\ \ T_8 = 10 xx 3^7 = 21\ 870\ \ text{(True)}`
`text(In E,)\ \ T_10 = 10 xx 3^9 = 196\ 830\ \ text{(True)}`
`=> C`
The graph above shows the first five terms of a sequence.
Let `A_n` be the `n`th term of the sequence.
A difference equation that generates the terms of this sequence is
A. `A_(n+1) = 2A_n - 2` | `\ \ \ \ text(where) \ \ \ \ ` | `A_1 =8` |
B. `A_(n+1) = 3A_n` | `\ \ \ \ text(where) \ \ \ \ ` | `A_1 =8` |
C. `A_(n+1) = -2A_n` | `\ \ \ \ text(where) \ \ \ \ \ \ \ \ ` | `A_1 =8` |
D. `A_(n+1) = -1 / 2 A_n` | `\ \ \ \ text(where) \ \ \ \ ` | `A_1 =8` |
E. `A_(n+1) = -A_n - 1` | `\ \ \ \ text(where) \ \ \ \ ` | `A_1 =8` |
`D`
`A_1 = 8, \ \ A_2 = –4, \ \ A_3 = 2\ \ text{(from graph)}`
`text(This sequence is geometric where)`
`r=t_2/t_1=- 1/2`
`:.\ text(Difference equation is)\ \ \ A_(n+1) = -1/2 A_n`
`=> D`
The first three terms of an arithmetic sequence are –3, –7, –11 . . .
An expression for the `n`th term of this sequence, `t_n`, is
A. `t_n = 1 - 4n`
B. `t_n = 1 - 8n`
C. `t_n = -3 - 4n`
D. `t_n = -3 + 4n`
E. `t_n = -7 + 4n`
`A`
`text(Sequence is –3, –7, –11, …)`
`text(AP where)\ \ \ a` | `= –3, and` |
`d` | `= –7 – (–3) = –4` |
`t_n` | ` = a + (n – 1) d` |
` = –3 + (n – 1) (–4)` | |
` = –3 – 4n + 4` | |
` = 1 – 4n` |
`=> A`
`PQR` is a triangle with side lengths `x, 10` and `y`, as shown below.
In this triangle, angle `RPQ = 37°` and angle `QRP = 42°.`
Which one of the following expressions is correct for triangle `PQR`?
A. `x = 10/(sin 37°)`
B. `y = 10/(tan 37°)`
C. `x = 10 × (sin 42°)/(sin 37°)`
D. `y = 10 × (sin 37°)/(sin 101°)`
E. `10^2 = x^2 + y^2 - 2xy cos 42°`
`C`
A rectangular sheet of cardboard has length 50 cm and width 20 cm.
This sheet of cardboard is made into an open-ended cylinder by joining the two shorter sides, with no overlap.
This is shown in the diagram below.
The radius of this cylinder, in cm, is closest to
A. `6.4`
B. `8.0`
C. `15.6`
D. `15.9`
E. `17.8`
`B`
`text (Circumference) = 50\ text(cm)`
`2pi r` | `= 50` |
`:. r` | `= 50/(2pi)` |
`= 7.95…\ text(cm)` |
`rArr B`
Kim lives in Perth. He wants to watch an ice hockey game being played in Toronto starting at 10.00 pm on Wednesday.
Toronto is 13 hours behind Perth.
What is the time in Perth when the game starts?
`D`
`:.\ text(Time in Perth)`
`=\ text{10 pm (Wed) + 13 hours}`
`=\ text(11 am on Thursday)`
`=> D`
Leanne copied a two-way table into her book.
Leanne made an error in copying one of the values in the shaded section of the table.
Which value has been incorrectly copied?
`D`
`text(By checking row and column total, the number)`
`text(of females part-time work is incorrect)`
`=> D`
Which expression is equivalent to `3x^2 (x + 8) + x^2`?
(A) `3x^3 + x^2 + 8`
(B) `3x^3 + 25x^2`
(C) `4x^3 + 32x^2`
(D) `24x^3 + x^2`
`B`
`3x^2 (x + 8) + x^2`
`= 3x^3 + 24x^2 + x^2`
`= 3x^3 + 25x^2`
`=> B`
The positions of President, Secretary and Treasurer of a club are to be chosen from a committee of `5` people.
In how many ways can the three positions be chosen?
(A) `3`
(B) `10`
(C) `60`
(D) `125`
`C`
`text(3 positions and order matters)`
`:.\ text(# Combinations)` | `= 5 xx 4 xx 3` |
`= 60` |
`=> C`
The value of a car is depreciated using the declining balance method.
Which graph best illustrates the value of the car over time?
`C`
`text(Declining balance depreciates quicker in absolute)`
`text(terms in the early stages, and slower as time goes)`
`text(on and the balance owing decreases.)`
`=> C`
`P` and `Q` are points on the circumference of a circle with centre `O` and radius `3` cm.
What is the length of the arc `PQ`, in centimetres, correct to three significant figures?
(A) `1.57`
(B) `3.14`
(C) `4.71`
(D) `18.8`
`B`
`text(Length of Arc)\ PQ` | `= 60/360 xx 2 pi r` |
`= 1/6 xx 2pi (3)` | |
`= pi` | |
`= 3.14\ text(cm)` |
`=> B`
Each time she throws a dart, the probability that Mary hits the dartboard is `2/7`.
She throws two darts, one after the other.
What is the probability that she hits the dartboard with both darts?
`B`
`P text{(hits)} = 2/7`
`P text{(hits twice)}` | `= 2/7 xx 2/7` |
`= 4/49` |
`=> B`
Which of the following would be most likely to have a positive correlation?
\(A\)
\(\text{Positive correlation means that as one variable increases,}\)
\(\text{the other tends to increase also.}\)
\(\Rightarrow A\)