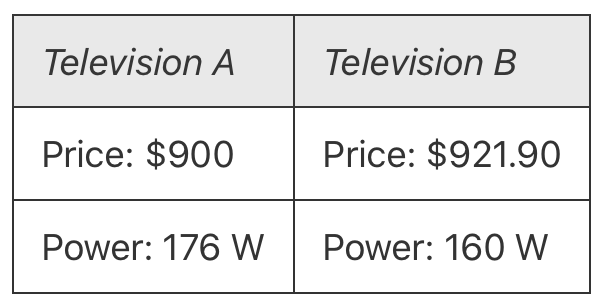
SmarterEd

Aussie Maths & Science Teachers: Save your time with SmarterEd

  • Login
  • Get Help
  • About

Measurement, STD1 M1 2021 HSC 7 MC

Suppose  `a=b/7`, where  `b=22.`

What is the value of  `a`, correct to three significant figures?

  1. 3.14
  2. 3.15
  3. 3.142
  4. 3.143
Show Answers Only

`A`

Show Worked Solution

`a=b/7=22/7=3.1428…`

♦ Mean mark 37%.

`3.1428 = 3.14\ text{(to 3 sig fig)}`

`=>  A`

Filed Under: Units and Measurement Error (Std 1) Tagged With: Band 5, smc-1120-30-Significant Figures

Financial Maths, STD2 F4 2021 HSC 30

Ariana owns 1500 shares in a company. The market price for each share is $27. Ariana's total dividend from these shares is $810.

Calculate the dividend yield for her shares.   (2 marks)

Show Answers Only

`2text(%)`

Show Worked Solution

♦ Mean mark 47%.
`text(Dividend yield)` `= text(Dividend)/text(Value of shares)`  
  `= 810/(1500 xx 27)`  
  `=0.02`  
  `= 2 text(% yield)`  

Filed Under: Compound Interest and Shares (Std2) Tagged With: Band 5, smc-817-40-Shares/Dividends

Algebra, STD2 A1 2021 HSC 29

Solve  `x+(x-1)/2 = 9`  (2 marks)

Show Answers Only

`19/3`

Show Worked Solution

♦ Mean mark 40%.
`x+(x-1)/2` `=9`  
`2x + x-1` `=18`  
`3x` `=19`  
`x` `=19/3`  

Filed Under: Substitution and Other Equations (Std 2), Substitution and Other Equations (Std2-2027) Tagged With: 2adv-std2-common, Band 5, common-content, smc-6234-30-Algebraic Fractions, smc-789-30-Algebraic Fractions

Measurement, STD2 M7 2021 HSC 27

The price and the power consumption of two different brands of television are shown.

The average cost for electricity is 25c/kWh. A particular family watches an average of 3 hours of television per day.

  1. The annual cost of electricity for Television A for this family is $48.18.
  2. For this family, what is the difference in the annual cost of electricity between Television A and Television B?  (2 marks)

    --- 4 WORK AREA LINES (style=lined) ---

  3. For this family, how many years will it take for the total cost of buying and using Television A to be equal to the cost of buying and using Television B?  (2 marks)

    --- 4 WORK AREA LINES (style=lined) ---

Show Answers Only
  1. `$4.38`
  2. `5\ text(years)`
Show Worked Solution
a.   `text{Annual power usage (B)}` `= 160 xx 3 xx 365`
    `=175\ 200`
    `=175.2\ text(kWh)`

♦ Mean mark part (a) 49%.
  `text{Annual cost (B)}` `= 175.2 xx 0.25`
    `=$43.80`


  `text{Difference in cost}` `= 48.18 – 43.80`
    `=$4.38`

♦♦ Mean mark part (b) 23%.
b.   `text{Difference in price}` `= 921.90 – 900`
    `=$21.90`


  `text(Years to even out cost)` `=21.90/4.38`
    `=5\ text{years}`

Filed Under: Energy and Mass (Std 2), M4 Rates (Y12), Rates (Std2) Tagged With: Band 4, Band 5, smc-1104-25-Energy, smc-799-20-Electricity, smc-805-20-Energy

Financial Maths, STD2 F4 2021 HSC 26

Nina plans to invest $35 000 for 1 year. She is offered two different investment options.

Option A:  Interest is paid at 6% per annum compounded monthly.

Option B:  Interest is paid at `r` % per annum simple interest.

  1. Calculate the future value of Nina's investment after 1 year if she chooses Option A.  (2 marks)

    --- 4 WORK AREA LINES (style=lined) ---

  2. Find the value of `r` in Option B that would give Nina the same future value after 1 year as for Option A. Give your answer correct to two decimal places.  (2 marks)

    --- 4 WORK AREA LINES (style=lined) ---

Show Answers Only
  1. `$37\ 158.72`
  2. `6.17text(%)`
Show Worked Solution
a.   `r` `= text(6%)/12= text(0.5%) = 0.005\ text(per month)`
  `n` `=12`


`FV` `= PV(1 + r)^n`
  `= 35\ 000(1 + 0.005)^(12)`
  `= $37\ 158.72`

♦♦ Mean mark part (b) 36%.
b.   `I` `=Prn`
  `2158.72` `=35\ 000 xx r xx 1`
  `r` `=2158.72/(35\ 000)`
    `=0.06167…`
    `=6.17 text{% (to 2 d.p.)}`

Filed Under: Compound Interest, Compound Interest and Shares (Std2) Tagged With: Band 4, Band 5, num-title-ct-coreb, num-title-qs-hsc, smc-4334-10-Find FV, smc-4334-40-Find r, smc-4334-50-Compound vs Simple, smc-817-20-FV Formula, smc-817-30-i/r comparisons (incl. graphs)

Algebra, STD2 A4 2021 HSC 13 MC

The time taken to clean a warehouse varies inversely with the number of cleaners employed.

It takes 8 cleaners 60 hours to clean a warehouse.

Working at the same rate, how many hours would it take 10 cleaners to clean the same warehouse.

  1. 45
  2. 48
  3. 62
  4. 75
Show Answers Only

`B`

Show Worked Solution

`text{Time to clean}\ (T) prop 1/text{Number of cleaners (C)}`

♦ Mean mark 41%.

`T=k/C`

`text(When)\ \ T=60, C=8`

`60` `=k/8`
`k` `=480`


`text{Find}\ \ T\ \ text(when)\ \ C=10:`

`T` `=480/10`
  `=48\ text(hours)`

 
`=>  B`

Filed Under: Non-Linear: Inverse and Other Problems (Std 2) Tagged With: Band 5, smc-795-10-Inverse, smc-795-40-Proportional

Algebra, NAP-I3-NC02v1

A popular video game attracts 3 subscribers in its first week.

It then attracts twice as many subscribers each week as it did the previous week.

If no subscribers leave, the total number of subscribers at the end of any week is

 
always odd.
 
always even.
 
sometimes odd and sometimes even.
Show Answers Only

`text(always odd.)`

Show Worked Solution

`text{Week 1 total = 3 (odd)}`

`text{Week 2 total = 3 + 6 = 9 (odd)}`

`text{Week 3 total = 9 + 18 = 27 (odd)}`

`text(Each total = odd + even = odd)`

`:.\ text(Total subscribers will always be odd.)`

Filed Under: Patterns and Coordinate Geometry (8) Tagged With: Band 5, smc-3151-10-Patterns and numbers

Measurement, NAP-I3-CA05v1

Tim set off for a walk at 6:25 in the morning and got back home at 3:45 in the afternoon.

How many hours did Tim walk for?

 
`text(20 minutes)`
 
`text(7 hour 20 minutes)`
 
`text(7 hours 40 minutes)`
 
`text(9 hours 20 minutes)`
 
`text(10 hours 40 minutes)`
Show Answers Only

`text(9 hours 20 minutes)`

Show Worked Solution

`text(6:25 am to 3:25 pm = 9 hours)`

`text(3:25 pm to 3:45 pm = 20 minutes)`

`:.\ text(9 hours and 20 minutes)`

Filed Under: Time Tagged With: Band 5, smc-3154-10-Time intervals

Measurement, NAP-I3-NC05v1

Eduardo is measuring the length of a pool cues at a manufacturing plant.

He measures one at 1 metre and 58 centimetres.

Which of these shows how Eduardo would write this measurement in metres?

`1.058\ text(m)` `10.58\ text(m)` `1.58\ text(m)` `15.8\ text(m)`


Show Answers Only

`1.58\ text(m)`

Show Worked Solution

`text(1 metre = 100 centimetres)`

`text(1 metre and 58 centimetres)`

`= 1.58\ text(m)`

Filed Under: Units of Measurement Tagged With: Band 5, smc-3152-20-Convert mm/cm/m/km

Number, NAP-I3-CA02v1

Bryce owns a parking facility in the desert for out-of-service planes.

He keeps 6 planes on every hectare of the facility.

How many hectares would he need for 12 planes?

`0.5`    `2` `6` `72`


Show Answers Only

`2`

Show Worked Solution

`text(6 planes per hectare)`

`:.\ text(Hectares for 12 planes)` `=12/6`
  `=2\ text(hectares)`

Filed Under: Rates, Ratios and Scale Tagged With: Band 5, smc-902-70-Rates - Other

Geometry, NAP-C1-17v1

Which letter is in the triangle and the square, but not in the circle?


Show Answers Only

`text(D)`

Show Worked Solution

`text(D)`

Filed Under: Location, Maps and Directions Tagged With: Band 5, smc-705-15-Location

Number, NAP-E3-NC04v1

`135.6 + 23.7 =`


`111.9` `158.1` `159.3` `168.1` `169.3`


Show Answers Only

`159.3`

Show Worked Solution

`135.6 + 23.7 = 159.3`

Filed Under: Decimals Tagged With: Band 5, smc-3146-20-Decimal calculations

Number, NAP-D3-CA04v1

Jet created a new world record by running 5982 kilometres in a month.

Randall ran 4976 kilometres in the same time.

How many more kilometres did Jet run  than Randall?

`10\ 961` `1016` `1004` `1006`


Show Answers Only

`1006`

Show Worked Solution

`5982 – 4976 = 1006`

Filed Under: Basic Concepts and Calculations Tagged With: Band 5, smc-3143-20-Basic operators

Number, NAP-B4-CA06v1

How many more people live in Melbourne than Hunter and Priory combined?

`1\ 272\ 737` `2\606\ 524` `3\ 570\ 264` `5\ 151\ 998`


Show Answers Only

`2\606\ 524`

Show Worked Solution
`text(Number of people)` `= 3\ 879\ 261 – (963\ 740 + 308\ 997)`
  `= 2\606\ 524`

Filed Under: Basic Concepts and Calculations Tagged With: Band 5, smc-3143-20-Basic operators

Probability, NAP-K2-12v1

There are 8 balls, numbered from 1 to 8, in a basket.

Five balls are taken out of the basket, one at a time, and not replaced.

The first two balls taken out are numbered 4 and 6.

Which of the following cannot happen?

 
The next ball chosen is 5.
 
The next 2 balls chosen are odd.
 
The fifth ball chosen is 1.
 
The next 3 balls chosen are even.
Show Answers Only

`text(The next 3 balls chosen are even.)`

Show Worked Solution

`text(Once number 4 and 6 are drawn, only 2 even numbers)`

`text{are left (no replacement).}`

`:.\ text(The next 3 balls chosen are even cannot happen.)`

Filed Under: Chance Tagged With: Band 5, smc-3053-30-Selection

Probability, NAP-C2-07v1

Seigfried and Roy play a board game with a spinner.


Roy spins the arrow.

On which number is the arrow least likely to stop?

`1` `2` `3` `4`


Show Answers Only

`4`

Show Worked Solution

`text(S)text(ince all sectors are the same size, and)`

`text(there is only one number 4.)`

`→\ text(Least likely to land on 4.)`

Filed Under: Chance Tagged With: Band 5, smc-3053-40-Spinner

Measurement, NAP-E2-05v3

Felicity arrived at her favourite cafe at 11:05 am.

She had 2 cups of coffee, read the paper and left at 12:13 pm.

How long was Felicity at the cafe for?

`text(52 minutes)` `text(68 minutes)` `text(108 minutes)` `text(128 minutes)`


Show Answers Only

`text(68 minutes)`

Show Worked Solution

`text(One Strategy:)`

`text(11:05 pm to 12:00 pm = 55 minutes)`

`text(12:00 pm to 12:13 pm = 13 minutes)`

`text(Meeting time = 55 + 13 = 68 minutes)`

Filed Under: Time Tagged With: Band 5, smc-3037-12-Time difference

Measurement, NAP-J2-17v1

Lionel is estimating the amount of diesel fuel he needs to fill up his truck.

Which of these units of measurement would be the most helpful?

cubic centimetres kilograms millilitres centimetres litres


Show Answers Only

`text(litres)`

Show Worked Solution

`text(Fuel is a liquid and litres is the most helpful unit to use.)`

Filed Under: Units of Measurement Tagged With: Band 5, smc-3035-40-Best unit/estimate

Measurement, NAP-E2-10v1

Which of these units is the best to measure the mass of a spoon?

 
`text(kilograms)`
 
`text(millilitres)`
 
`text(centimetres)`
 
`text(grams)`
Show Answers Only

`text(grams)`

Show Worked Solution

`text(Kilograms and grams are both a measurement of mass, although)`

`text(grams is the best unit for the weight of a spoon.)`

Filed Under: Units of Measurement Tagged With: Band 5, smc-3035-40-Best unit/estimate

Number and Algebra, NAP-B1-17 v1

65, 58, 51, …?

What is the next number in this counting pattern?

`44` `45` `47` `48`


Show Answers Only

`44`

Show Worked Solution

`65 – 7 = 58`

`58 – 7 = 51`

`=>\ text(Each number is 7 less than the one before.)`

`text(Next number)` `= 51 – 7`
  `= 44`

Filed Under: Patterns Tagged With: Band 5, smc-3021-10-Number sequences

Number and Algebra, NAP-E2-18 SA v1

Nathan bought kicking tee for $4.45 using coins in his pocket.

After paying, he counted $2.85 left in coins.

How much money in coins did Nathan have to start with?

$   
Show Answers Only

`$7.30`

Show Worked Solution

`text(One strategy:)`

`$4.45 + $2.85` `=6.45 + 0.85 `  
  `=6.45 + 0.55 + 0.30`  
  `=$7.30`  

Filed Under: Money Tagged With: Band 5, smc-3020-20-$ and cents calculations

Number and Algebra, NAP-E1-24v1

Jimmy has this much money.

He buys a drink for $1.55.

How much money does Jimmy have left?

`text(45 cents)` `text(55 cents)` `text(60 cents)` `text(65 cents)`


Show Answers Only

`text(55 cents)`

Show Worked Solution

`text(Money Jimmy has at the start)`

`=$1+50¢+20¢+20¢+10¢+10¢`

`=$2.10`
 

`text(Money left after buying a drink)`

`=$2.10 – $1.55`

`=55\ text(cents)`

Filed Under: Money and Financial Mathematics Tagged With: Band 5, smc-2536-30-$ and cents calculations

Number and Algebra, NAP-K2-16 SA v1

There are 54 maths students at an award presentation.

Mr Habib lines them up so there are 6 students in each row.

How many rows are there?

 
Show Answers Only

`9`

Show Worked Solution
`text(Number of rows)` `= 54 -: 6`
  `= 9`

Filed Under: Solving Problems - Multiply/Divide Tagged With: Band 5, smc-3018-20-Divide

Number and Algebra, NAP-H2-16v1

Lena's orchard had 84 apples to sell at the farm gate.

She packed them in bags of 15 apples for sale.

He had 12 apples left over.

How many bags did Lena pack?

`4`  `5` `11` `66`


Show Answers Only

`5`

Show Worked Solution

`84 ÷ 15 = 5\ text(remainder 9)`

`:. \ text(Lena packed 5 bags.)`

Filed Under: Solving Problems - Multiply/Divide Tagged With: Band 5, smc-3018-20-Divide, smc-3018-35-Remainder

Number and Algebra, NAP-E2-14v1

A table tennis club has 13 more boys than girls.

Miranda knows there are 28 boys.

How can Miranda work out the number of girls in the table tennis club?

 
add 13 to 14
 
subtract 13 from 28
 
add 13 to 28
 
multiply 13 by 28
Show Answers Only

`text(subtract 13 from 28)`

Show Worked Solution

`text(The number of girls can be calculated by subtracting)`

`text(the “extra” boys from the total number of boys.)`

`:.\ text(subtract 13 from 28)`

Filed Under: Solving Problems - Add/Subtract Tagged With: Band 5, smc-3017-50-Find equation

Number and Algebra, NAP-E2-8v1

How many even numbers are between 7 and 19?

`6`    `7`   `8` `14`


Show Answers Only

`6`

Show Worked Solution

`text(Listing the even number between 7 and 19:)`

`8,10,12,14,16,18`

`:.\ text(There are 6 even numbers.)`

Filed Under: Number and Place Tagged With: Band 5, smc-3016-90-Other problems

Number and Algebra, NAP-K2-3 SA v1

What is the closest number to 50 that can be made using two of these cards?


Write the number in the box below.

Show Answers Only

`53`

Show Worked Solution

`53`

Filed Under: Number and Place Tagged With: Band 5, smc-3016-60-Place Value

Number and Algebra, NAP-H2-25v1

Which of these pairs of numbers has a difference of 18?

`18 and 81` `25 and 33` `16 and 34` `12 and 40`


Show Answers Only

`16 and 34`

Show Worked Solution

`34 – 16 = 18`

`:. 16 and 34`

Filed Under: Number and Place Tagged With: Band 5, smc-3016-20-Subtraction

Networks, STD2 N3 FUR2 4

Training program 1 has the cricket team starting from exercise station `S` and running to exercise station `O`.

For safety reasons, the cricket coach has placed a restriction on the maximum number of people who can use the tracks in the fitness park.

The directed graph below shows the capacity of the tracks, in number of people per minute.


  1. Determine the capacity of Cut 1, shown above.  (1 mark)

    --- 1 WORK AREA LINES (style=lined) ---

  2. What is the maximum flow from `S` to `O`, in number of people per minute?  (1 mark)

    --- 2 WORK AREA LINES (style=lined) ---

Show Answers Only
  1. `52`
  2. `50`
Show Worked Solution
a.   `text{Capacity (Cut 1)}` `= 20 + 12 + 20`
    `= 52`


b.   `text(Max flow/minimum cut)`

♦♦ Mean mark part (c) 32%.

`= 20 + 10 + 20`

`= 50`
 

Filed Under: Flow Networks and Minimum Cuts Tagged With: Band 4, Band 5, smc-915-10-Min Cut/Max Flow, smc-915-20-Cut Capacity

NETWORKS, FUR2 2020 VCAA 3

A local fitness park has 10 exercise stations: `M` to `V`.

The edges on the graph below represent the tracks between the exercise stations.

The number on each edge represents the length, in kilometres, of each track.


The Sunny Coast cricket coach designs three different training programs, all starting at exercise station `S`.

  Training program 
number
Training details
  1 The team must run to exercise station `O`.
  2 The team must run along all tracks just once.
  3 The team must visit each exercise station and return to  exercise station `S`.


  1. What is the shortest distance, in kilometres, covered in training program 1?  (1 mark)

    --- 3 WORK AREA LINES (style=lined) ---

  2.  i. What mathematical term is used to describe training program 2?   (1 mark)

    --- 1 WORK AREA LINES (style=lined) ---

  3. ii. At which exercise station would training program 2 finish?  (1 mark)

    --- 1 WORK AREA LINES (style=lined) ---

  4. To complete training program 3 in the minimum distance, one track will need to be repeated.


    Complete the following sentence by filling in the boxes provided.  (1 mark)

    --- 0 WORK AREA LINES (style=lined) ---


    This track is between exercise station   
     
    and exercise station   
     
Show Answers Only
  1. `3.2\ text(km)`
  2.  i. `text(Eulerian trail)`
  3. ii. `text(Station)\ P`
  4. `S and T`
Show Worked Solution
a.   `text(Shortest distance)` `= STUVO`
    `= 0.6 + 1.2 + 0.6 + 0.8`
    `= 3.2\ text(km)`


b.i.  `text(Eulerian trail)`
 

b.ii.  `text(Station)\ P\ text{(only other vertex with}\ S\ text{to have odd degree)} `

♦♦ Mean mark part (c) 25%.


c.   `S and T`

Filed Under: Minimum Spanning Trees and Shortest Paths, Travelling Problems and Adjacency Matrices Tagged With: Band 4, Band 5, smc-622-10-Euler, smc-622-20-Hamiltonian, smc-624-60-Shortest Paths

MATRICES, FUR2 2020 VCAA 4

A second market research project also suggested that if the Westmall shopping centre were sold, each of the three centres (Westmall, Grandmall and Eastmall) would continue to have regular shoppers but would attract and lose shoppers on a weekly basis.

Let `R_n` be the state matrix that shows the expected number of shoppers at each of the three centres `n` weeks after Westmall is sold.

A matrix recurrence relation that generates values of `R_n` is

`R_(n+1) = TR_n + B`

`{:(quad qquad qquad qquad qquad qquad qquad qquad text(this week)),(qquad qquad qquad qquad qquad qquad quad \ W qquad quad G qquad quad \ E),(text(where)\ T = [(quad 0.78, 0.13, 0.10),(quad 0.12, 0.82, 0.10),(quad 0.10, 0.05, 0.80)]{:(W),(G),(E):}\ text(next week,) qquad qquad  B = [(-400), (700), (500)]{:(W),(G),(E):}):}`
 

The matrix `R_2` is the state matrix that shows the expected number of shoppers at each of the three centres in the second week after Westmall is sold

`R_2 = [(239\ 060), (250\ 840), (192\ 900)]{:(W),(G),(E):}`

  1. Determine the expected number of shoppers at Westmall in the third week after it is sold.   (1 mark)

    --- 3 WORK AREA LINES (style=lined) ---

  2. Determine the expected number of shoppers at Westmall in the first week after it is sold.   (1 mark)

    --- 3 WORK AREA LINES (style=lined) ---

Show Answers Only
  1. `237\ 966`
  2. `241\ 000`
Show Worked Solution

♦ Mean mark part (a) 50%.
a.   `R_3` `= TR_2 + B`
    `= [(0.78, 0.13, 0.1),(0.12, 0.82, 0.1),(0.10, 0.05, 0.8)][(239\ 060),(250\ 840),(192\ 900)]+[(-400),(700),(500)] = [(237\ 966),(254\ 366),(191\ 268)]`

 
`:. text(Expected Westmall shoppers) = 237\ 966`
 

♦♦♦ Mean mark part (b) 20%.
b.   `R_2` `= TR_1 + B`
  `R_1` `= T^(-1)[R_2-B]`
    `= [(241\ 000), (246\ 000), (195\ 000)]`

 
`:. text(Expected Westmall shoppers) = 241\ 000`

Filed Under: Transition Matrices - Modified Tagged With: Band 5, Band 6, smc-1893-20-State Matrix in discrete period, smc-1893-25-Inverse Matrix, smc-1893-31-3x3 Matrix

MATRICES, FUR2 2020 VCAA 3

An offer to buy the Westmall shopping centre was made by a competitor.

One market research project suggested that if the Westmall shopping centre were sold, each of the three centres (Westmall, Grandmall and Eastmall) would continue to have regular shoppers but would attract and lose shoppers on a weekly basis.

Let  `S_n`  be the state matrix that shows the expected number of shoppers at each of the three centres  `n`  weeks after Westmall is sold.

A matrix recurrence relation that generates values of  `S_n`  is

`S_(n+1) = T xx S_n`

`{:(quad qquad qquad qquad qquad qquad qquad qquad text(this week)),(qquad qquad qquad qquad qquad qquad quad \ W qquad quad G qquad quad \ E),(text(where)\ T = [(quad 0.80, 0.09, 0.10),(quad 0.12, 0.79, 0.10),(quad 0.08, 0.12, 0.80)]{:(W),(G),(E):}\ text(next week,) qquad qquad  S_0 = [(250\ 000), (230\ 000), (200\ 000)]{:(W),(G),(E):}):}`
 

  1. Calculate the state matrix, `S_1`, to show the expected number of shoppers at each of the three centres one week after Westmall is sold.   (1 mark)

    --- 3 WORK AREA LINES (style=lined) ---

Using values from the recurrence relation above, the graph below shows the expected number of shoppers at Westmall, Grandmall and Eastmall for each of the 10 weeks after Westmall is sold.


  1. What is the difference in the expected weekly number of shoppers at Westmall from the time Westmall is sold to 10 weeks after Westmall is sold?
  2. Give your answer correct to the nearest thousand.   (1 mark)

    --- 2 WORK AREA LINES (style=lined) ---

  3. Grandmall is expected to achieve its maximum number of shoppers sometime between the fourth and the tenth week after Westmall is sold.
  4. Write down the week number in which this is expected to occur.   (1 mark)

    --- 4 WORK AREA LINES (style=lined) ---

  5. In the long term, what is the expected weekly number of shoppers at Westmall?
  6. Round your answer to the nearest whole number.   (1 mark)

    --- 3 WORK AREA LINES (style=lined) ---

Show Answers Only
  1. `S_1 =[(240\ 700),(231\ 700),(207\ 600)]`
  2. `30\ 000`
  3. `S_6 = T^6S_0 =  [(text(__)), (233\ 708), (text(__))]`
  4. `218\ 884`
Show Worked Solution
a.   `S_1` `= TS_0`
    `= [(0.80, 0.09, 0.10),(0.12, 0.79, 0.10),(0.08, 0.12, 0.80)][(250\ 000),(230\ 000),(200\ 000)]=[(240\ 700),(231\ 700),(207\ 600)]`


b.   `text(Using the graph)`
  `text(Difference)` `= 250\ 000-220\ 000`
    `= 30\ 000`


♦♦ Mean mark part (c) 27%.

c.  `text(Testing options:)`

`S_6 = T^6S_0 = [(0.80, 0.09, 0.10),(0.12, 0.79, 0.10),(0.08, 0.12, 0.80)]^6[(250\ 000),(230\ 000),(200\ 000)] = [(text(__)), (233\ 708), (text(__))]`
 

`:.\ text(Maximum shoppers in Grandmall expected in week 6.)`


♦ Mean mark part (d) 39%.

d.  `text(Test with high integer)\ n:`

`S_50 = T^50S_0 -> text(Westmall) = 218\ 884`

Filed Under: Transition Matrices - Regular Tagged With: Band 3, Band 4, Band 5, smc-618-30-State Matrix in discrete period, smc-618-40-Steady State, smc-618-61-3x3 Matrix

MATRICES, FUR2 2020 VCAA 2

The preferred number of cafes `(x)` and sandwich bars `(y)` in Grandmall’s food court can be determined by solving the following equations written in matrix form.
 

`[(5, -9),(4, -7)][(x),(y)]=[(7), (6)]`
 

  1. The value of the determinant of the 2 × 2 matrix is 1.
  2. Use this information to explain why this matrix has an inverse.   (1 mark)

    --- 2 WORK AREA LINES (style=lined) ---

  3. Write the three missing values of the inverse matrix that can be used to solve these equations.   (1 mark)

    --- 0 WORK AREA LINES (style=lined) ---

 
`[(text( __), 9),(text( __), text( __)\ )]`
 

  1. Determine the preferred number of sandwich bars for Grandmall’s food court.   (1 mark)

    --- 2 WORK AREA LINES (style=lined) ---

Show Answers Only
  1. `text(S) text(ince determinant) = 1 != 0,`


    `text(the matrix has an inverse)`

  2. `[(-7, 9),(-4, 5)]`
  3. `2`
Show Worked Solution

a.  `text(S) text(ince determinant) = 1 != 0,`

♦ Mean mark part (a) 37%.

`->\ text(the matrix has an inverse)`


b.
  `[(-7, 9),(-4, 5)]`


Mean mark part (c) 51%.
c.   `[(x), (y)] = [(-7, 9), (-4, 5)][(7), (6)] = [(7),(2)]`

 
`:.\ text(Preferred number of sandwich bars) = 2`

Filed Under: Matrix Calculations Tagged With: Band 4, Band 5, smc-616-40-Powers/Inverse, smc-616-50-Determinant

MATRICES, FUR2 2020 VCAA 1

The three major shopping centres in a large city, Eastmall `(E)`, Grandmall `(G)` and Westmall `(W)`, are owned by the same company.

The total number of shoppers at each of the centres at 1.00 pm on a typical day is shown in matrix `V`.

`qquad qquad qquad {:(qquad qquad qquad \ E qquad qquad G qquad qquad \  W),(V = [(2300,2700,2200)]):}`

  1. Write down the order of matrix `V`.   (1 mark)

Each of these centres has three major shopping areas: food `(F)`, clothing `(C)` and merchandise `(M)`.

The proportion of shoppers in each of these three areas at 1.00 pm on a typical day is the same at all three centres and is given in matrix `P` below

`qquad qquad qquad P = [(0.48), (0.27), (0.25)] {:(F),(C),(M):}

  1. Grandmall’s management would like to see 700 shoppers in its merchandise area at 1.00 pm.


    If this were to happen, how many shoppers, in total, would be at Grandmall at this time?   (1 mark)

  2. The matrix  `Q = P xx V`  is shown below. Two of the elements of this matrix are missing.
     
    `{:(quad qquad qquad qquad \ E qquad qquad G qquad qquad W), (Q = [(1104, \ text{___}, 1056 ), (621,\ text{___}, 594), (575, 675, 550)]{:(F),(C), (M):}):}`
     
    1. Complete matrix `Q` above by filling in the missing elements.   (1 mark)

      --- 0 WORK AREA LINES (style=lined) ---

    2. The element in row `i` and column `j` of matrix `Q` is `q_(ij)`.
    3. What does the element `q_23` represent?   (1 mark)

      --- 2 WORK AREA LINES (style=lined) ---

The average daily amount spent, in dollars, by each shopper in each of the three areas at Grandmall in 2019 is shown in matrix  `A_2019`  below.

`qquad qquad A_2019 = [(21.30), (34.00), (14.70)] {:(F),(C),(M):}`

On one particular day, 135 shoppers spent the average daily amount on food, 143 shoppers spent the average daily amount on clothing and 131 shoppers spent the average daily amount on merchandise.

  1. Write a matrix calculation, using matrix  `A_2019`, showing that the total amount spent by all these shoppers is $9663.20   (1 mark)

    --- 3 WORK AREA LINES (style=lined) ---

  2. In 2020, the average daily amount spent by each shopper was expected to change by the percentage shown in the table below.


      Area food clothing merchandise
      Expected change     increase by 5%       decrease by 15%       decrease by 1%   


    The average daily amount, in dollars, expected to be spent in each area in 2020 can be determined by forming the matrix product

  3. `qquad qquad A_2020 = K xx A_2019`
  4. Write down matrix `K`.    (1 mark)

    --- 3 WORK AREA LINES (style=lined) ---

Show Answers Only
  1. `1 xx 3`
  2. `2800`
  3.  i.   `{:(quad qquad qquad qquad \ E qquad qquad G qquad qquad W), (Q = [(1104, 1296, 1056 ), (621, 729, 594), (575, 675, 550)]{:(F),(C), (M):}):}`
     
  4. ii. `q_23\ text(represents the number of people)`
  5.    `text(in the clothing area of Westmall.)`
  6. `text(Total spent) = [(135, 143, 131)][(21.30), (34.00), (14.70)] = [9663.20]`
  7. `K = [(1.05, 0, 0),(0, 0.85, 0),(0, 0, 0.99)]`
Show Worked Solution

a.  `1 xx 3`

♦ Mean mark part (b) 45%.
b.   `0.25 xx G\ text(shoppers in)\ M` `= 700`
  `:. G\ text(shoppers in)\ M` `= 700/0.25`
    `= 2800`


c.i.   `{:(quad qquad qquad qquad \ E qquad qquad G qquad qquad W), (Q = [(1104, 1296, 1056 ), (621, 729, 594), (575, 675, 550)]{:(F),(C), (M):}):}`


c.ii.   `q_23\ text(represents the number of people)`
  `text(in the clothing area of Westmall.)`


d.  `text(Total spent) = [(135, 143, 131)] [(21.30), (34.00), (14.70)] = [9663.20]`

♦♦ Mean mark part (e) 24%.
 

e.   `A_2020` `= K xx [(21.30), (34.00), (14.70)]`
  `:. K` `= [(1.05, 0, 0),(0, 0.85, 0),(0, 0, 0.99)]`

Filed Under: Matrix Applications Tagged With: Band 3, Band 4, Band 5, page-break-before-question, smc-619-10-Matrix from info/table, smc-619-30-Matrix product and interpretation, smc-619-40-Interpret Elements

NETWORKS, FUR2 2020 VCAA 4

Training program 1 has the cricket team starting from exercise station `S` and running to exercise station `O`.

For safety reasons, the cricket coach has placed a restriction on the maximum number of people who can use the tracks in the fitness park.

The directed graph below shows the capacity of the tracks, in number of people per minute.


  1. How many different routes from `S` to `O` are possible?   (1 mark)

    --- 2 WORK AREA LINES (style=lined) ---

When considering the possible flow of people through this network, many different cuts can be made.

  1. Determine the capacity of Cut 1, shown above.   (1 mark)

    --- 2 WORK AREA LINES (style=lined) ---

  2. What is the maximum flow from `S` to `O`, in number of people per minute?   (1 mark)

    --- 3 WORK AREA LINES (style=lined) ---

Show Answers Only
  1. `10`
  2. `52`
  3. `50`
Show Worked Solution
a.   `text(Routes: )` `SMO, STUNO, STUVO, STUVPO, SRQUNO,SRQUVO,`
    `SRQUVPO, SRQVO, SRQVPO, SRQPO`

♦♦ Mean mark part (a) 30%.

 
`:. 10\ text(routes)`


b.   `text{Capacity (Cut 1)}` `= 20 + 12 + 20`
    `= 52`


c.   `text(Max flow/minimum cut)`

♦♦ Mean mark part (c) 32%.

`= 20 + 10 + 20`

`= 50`
 

Filed Under: Flow Problems Tagged With: Band 4, Band 5, smc-625-10-Cut Capacity, smc-625-20-Max Flow/Min Cut

CORE, FUR2 2020 VCAA 11

Samuel took out a new reducing balance loan.

The interest rate for this loan was 4.1% per annum, compounding monthly.

The balance of the loan after four years of monthly repayments was $329 587.25

The balance of the loan after seven years of monthly repayments was $280 875.15

Samuel will continue to make the same monthly repayment.

To ensure the loan is fully repaid, to the nearest cent, the required final repayment will be lower.

In the first seven years, Samuel made 84 monthly repayments.

From this point on, how many more monthly repayments will Samuel make to fully repay the loan?   (2 marks)

--- 4 WORK AREA LINES (style=lined) ---

Show Answers Only

`text(150 more monthly payments.)`

Show Worked Solution

`text(Find monthly payment)`

♦♦ Mean mark 21%.

`text(By TVM Solver:)`

`N` `= 36`
`I(%)` `= 4.1`
`PV` `= 329\ 587.25`
`PMT` `= ?`
`FV` `= -280\ 875.15`
`text(PY)` `= text(CY) = 12`

 
`=> PMT = -2400.00`


`text(Find)\ N\ text(when)\ FV = 0`

`text(By TVM Solver:)`

`N` `= ?`
`I(%)` `= 4.1`
`PV` `= 280\ 875.15`
`PMT` `= -2400`
`FV` `= 0`
`text(PY)` `= text(CY) = 12`

 
`=> N = 149.67…`

`:.\ text(After 7 years, 150 more monthly payments are required.)`

Filed Under: Borrowing and Loans Tagged With: Band 5, smc-603-22-Reducible balance loans, smc-603-65-CAS (2 step)

CORE, FUR2 2020 VCAA 10

Samuel now invests $500 000 in an annuity from which he receives a regular monthly payment.

The balance of the annuity, in dollars, after  `n`  months,  `A_n` , can be modelled by a recurrence relation of the form

`A_0 = 500\ 000, qquad A_(n+1) = kA_n - 2000`

  1. Calculate the balance of this annuity after two months if  `k = 1.0024`.   (1 mark)

    --- 2 WORK AREA LINES (style=lined) ---

  2. Calculate the annual compound interest rate percentage for this annuity if  `k = 1.0024`.   (1 mark)

    --- 2 WORK AREA LINES (style=lined) ---

  3. For what value of  `k`  would this investment act as a simple perpetuity?   (1 mark)

    --- 3 WORK AREA LINES (style=lined) ---

Show Answers Only
  1. `$498\ 398.08`
  2. `2.88 text(%)`
  3. `1.004`
Show Worked Solution
a.   `A_1 = 1.0024 xx 500\ 000-2000 = $499\ 200`
  `A_2 = 1.0024 xx 499\ 200-2000 = $498\ 398.08`


♦ Mean mark 48%.
b.   `text(Monthly interest rate)` `= (1.0024-1) xx 100 = 0.24text(%)`
  `text(Annual interest rate)` `= 12 xx 0.24 = 2.88text(%)`


♦ Mean mark 36%.
c.   `text(Perpetuity would occur when)`
  `k xx 500\ 000-2000` `= 500\ 000`
  `k` `= (502\ 000)/(500\ 000)`
    `= 1.004`

Filed Under: Annuities and Perpetuities, Recursion - Financial Tagged With: Band 4, Band 5, smc-2512-70-Recurrence relations, smc-717-30-Annuity, smc-717-40-Perpetuity, smc-717-70-Find RR

CORE, FUR2 2020 VCAA 9

Samuel opens a savings account.

Let `B_n` be the balance of this savings account, in dollars, `n` months after it was opened.

The month-to-month value of `B_n` can be determined using the recurrence relation shown below.

`B_0 = 5000, qquad B_(n+1) = 1.003B_n`

  1. Write down the value of `B_4`, the balance of the savings account after four months.
  2. Round your answer to the nearest cent.   (1 mark)

    --- 3 WORK AREA LINES (style=lined) ---

  3. Calculate the monthly interest rate percentage for Samuel’s savings account.   (1 mark)

    --- 2 WORK AREA LINES (style=lined) ---

  4. After one year, the balance of Samuel’s savings account, to the nearest dollar, is $5183.


    If Samuel had deposited an additional $50 at the end of each month immediately after the interest was added, how much extra money would be in the savings account after one year?


    Round your answer to the nearest dollar.   (1 mark)

    --- 3 WORK AREA LINES (style=lined) ---

Show Answers Only
  1. `$5060.27`
  2. `0.3 text(%)`
  3. `$610`
Show Worked Solution
a.   `B_1` `= 1.003 (5000)`
  `B_2` `= 1.003^2 (5000)`

`vdots`

`:. B_4` `= 1.003^4 (5000)`
  `= $5060.27`


b.  `text(Monthly interest rate)`

`= (1.003-1) xx 100`

`= 0.3%`


c.   `text(Extra)\ =\ text(value of annuity after 12 months)`

`text(By TVM solver:)`

`N` `= 12`
`I(%)` `= 3.6`
`PV` `= 0`
`PMT` `= 50`
`FV` `= ?`
`text(PY)` `= text(CY) = 12`

 
`FV = 609.84`

`:.\ text(Extra money) = $610`

Filed Under: Interest Rates and Investing, Recursion - Financial Tagged With: Band 4, Band 5, smc-604-90-CAS Solver, smc-604-95-Recurrence relations, smc-717-10-Compound interest, smc-717-80-Interpret RR

CORE, FUR2 2020 VCAA 8


Samuel has a reducing balance loan.

The first five lines of the amortisation table for Samuel’s loan are shown below.


Interest is calculated monthly and Samuel makes monthly payments of $1600.

Interest is charged on this loan at the rate of 3.6% per annum.

  1. Using the values in the amortisation table
    1. calculate the principal reduction associated with payment number 3.   (1 mark)

      --- 3 WORK AREA LINES (style=lined) ---

    2. Calculate the balance of the loan after payment number 4 is made.
    3. Round your answer to the nearest cent.   (1 mark)

      --- 4 WORK AREA LINES (style=lined) ---

  2. Let `S_n` be the balance of Samuel’s loan after `n` months.
  3. Write down a recurrence relation, in terms of `S_0, S_(n+1)`  and  `S_n`, that could be used to model the month-to-month balance of the loan.   (1 mark)

    --- 3 WORK AREA LINES (style=lined) ---

Show Answers Only

  1.  i. `$643.85`
  2. ii. `$317\ 428.45`
  3. `text(See Worked Solutions)`

Show Worked Solution

a.i.   `text(Principal reduction)` `=\ text(Payment – interest)`
    `= 1600-956.15`
    `= $643.85`


♦ Mean mark part a.ii. 39%.

a.ii.   `text(Interest)` `= 318\ 074.23 xx (0.036/12)`
    `= $954.22`

 
`:.\ text(Balance after payment 4)`

`= 318\ 074.23-1600 + 954.22`

`= $317\ 428.45`


♦♦ Mean mark part b. 30%.

b.   `S_0 = 320\ 000,\ S_(n+1)` `= S_n(1 + 0.036/12)-1600`
  `S_(n+1)` `= 1.003 S_n-1600`

Filed Under: Borrowing and Loans, Recursion - Financial Tagged With: Band 3, Band 5, smc-603-70-Recurrence relation, smc-717-20-Loans, smc-717-70-Find RR

CORE, FUR2 2020 VCAA 6

The table below shows the mean age, in years, and the mean height, in centimetres, of 648 women from seven different age groups.


  1. What was the difference, in centimetres, between the mean height of the women in their twenties and the mean height of the women in their eighties?  (1 mark)

    --- 1 WORK AREA LINES (style=lined) ---

A scatterplot displaying this data shows an association between the mean height and the mean age of these women. In an initial analysis of the data, a line is fitted to the data by eye, as shown.


  1. Describe this association in terms of strength and direction.  (1 mark)

    --- 1 WORK AREA LINES (style=lined) ---

  2. The line on the scatterplot passes through the points (20,168) and (85,157).


    Using these two points, determine the equation of this line. Write the values of the intercept and the slope in the appropriate boxes below.


    Round your answers to three significant figures.  (1 mark)

    --- 0 WORK AREA LINES (style=lined) ---

mean height = 
 
  +  
 
  × mean age


  1. In a further analysis of the data, a least squares line was fitted.


    The associated residual plot that was generated is shown below.


    The residual plot indicates that the association between the mean height and the mean age of women is non-linear.


    The data presented in the table in part a is repeated below. It can be linearised by applying an appropriate transformation to the variable mean age.


    Apply an appropriate transformation to the variable mean age to linearise the data. Fit a least squares line to the transformed data and write its equation below.


    Round the values of the intercept and the slope to four significant figures.  (2 marks)

    --- 5 WORK AREA LINES (style=lined) ---


Show Answers Only
  1. `10.4\ text(cm)`
  2. `text(Strong and negative)`
  3. `text(mean height) = 171 – 0.169 xx text(mean age)`
  4. `text(mean height) = 167.9 – 0.001621 xx text{(mean age)}^2`
Show Worked Solution
a.   `text(Difference)` `= 167.1 – 156.7`
    `= 10.4\ text(cm)`


Mean mark part b. 51%.

b.  `text(Strong and negative.)`


♦♦ Mean mark part c. 23%.

c.   `text(Slope) = (157 – 168)/(85 – 20) = -0.169`

`text(Equation of line)`

`y – 168` `= -0.1692 (x – 20)`
`y` `= -0.169x + 171`

 
`:.\ text(mean height) = 171 – 0.169 xx text(mean age)`


D.    `text(By CAS)`

`text(mean height) = 167.9 – 0.001621 xx text{(mean age)}^2`

Filed Under: Correlation and Regression Tagged With: Band 3, Band 4, Band 5, page-break-before-question, smc-265-20-Find LSRL Equation/Gradient, smc-265-50-Residuals, smc-265-71-Linearise - Squared/Inverse, smc-265-80-Rounding (Sig Fig)

CORE, FUR2 2020 VCAA 5

The scatterplot below shows body density, in kilograms per litre, plotted against waist measurement, in centimetres, for 250 men.

When a least squares line is fitted to the scatterplot, the equation of this line is

body density = 1.195 – 0.001512 × waist measurement

  1. Draw the graph of this least squares line on the scatterplot above.   (1 mark)

    --- 0 WORK AREA LINES (style=lined) ---

  2. Use the equation of this least squares line to predict the body density of a man whose waist measurement is 65 cm.
  3. Round your answer to two decimal places.   (1 mark)

    --- 2 WORK AREA LINES (style=lined) ---

  4. When using the equation of this least squares line to make the prediction in part b., are you extrapolating or interpolating?   (1 mark)

    --- 1 WORK AREA LINES (style=lined) ---

  5. Interpret the slope of this least squares line in terms of a man’s body density and waist measurement.   (1 mark)

    --- 2 WORK AREA LINES (style=lined) ---

  6. In this study, the body density of the man with a waist measurement of 122 cm was 0.995 kg/litre.
  7. Show that, when this least squares line is fitted to the scatterplot, the residual, rounded to two decimal places, is –0.02   (1 mark)

    --- 3 WORK AREA LINES (style=lined) ---

  8. The coefficient of determination for this data is 0.6783
  9. Write down the value of the correlation coefficient `r`.
  10. Round your answer to three decimal places.   (1 mark)

    --- 2 WORK AREA LINES (style=lined) ---

  11. The residual plot associated with fitting a least squares line to this data is shown below.


    Does this residual plot support the assumption of linearity that was made when fitting this line to this data? Briefly explain your answer.   (1 mark)

    --- 3 WORK AREA LINES (style=lined) ---

Show Answers Only
  1. `text(See Worked Solutions)`
  2. `1.10\ text(kg/litre)`
  3. `text(extrapolating)`
  4. `text(See Worked Solutions)`
  5. `-0.02`
  6. `-0.824`
  7. `text(See Worked Solutions)`
Show Worked Solution

a.   `text(LSRL passes through)\ (60, 1.1043) and (130, 0.998)`

♦ Mean mark part a. 41%.

b.   `text(body density)` `= 1.195-0.001512 xx 65`
    `= 1.09672`
    `= 1.10\ text{kg/litre (to 2 d.p.)}`
♦ Mean mark part c. 38%.
c.   `text(A waist of 65 cm is outside the)`
  `text(range of the existing data set.)`

 
`:.\ text(Extrapolating)`


♦ Mean mark part d. 44%.
d.   `text(Body density decreases by 0.001512 kg/litre)`
  `text(for each increase in waist size of 1 cm.)`


e.   `text{Body density (predicted)}`

`= 1.195-0.001512 xx 122`

`~~ 1.0105\ text(kg/litre)`
 

`text(Residual)` `= text(Actual-predicted)`
  `~~ 0.995-1.0105`
  `~~ -0.0155`
  `~~ -0.02\ text{(to 2 d.p.)}`


♦♦ Mean mark part f. 25%.

f.   `r` `= -sqrt(0.6783)`
    `=-0.8235…`
    `= -0.824\ text{(to 3 d.p.)}`


g.  `text(The residual plot has no pattern and is centred around zero.)`

`:.\ text(It supports the assumption of linearity of the LSRL.)`

Filed Under: Correlation and Regression Tagged With: Band 4, Band 5, smc-265-10-r / r^2 and Association, smc-265-30-LSRL formula, smc-265-40-Interpret Gradient, smc-265-50-Residuals, smc-265-60-Extrapolation / Interpolation

CORE, FUR2 2020 VCAA 4

The age, in years, body density, in kilograms per litre, and weight, in kilograms, of a sample of 12 men aged 23 to 25 years are shown in the table below.
 

          Age       
(years)

        Body density        
(kg/litre)

        Weight        
(kg)

  23 1.07 70.1
  23 1.07 90.4
  23 1.08 73.2
  23 1.08 85.0
  24 1.03 84.3
  24 1.05 95.6
  24 1.07 71.7
  24 1.06 95.0
  25 1.07 80.2
  25 1.09 87.4
  25 1.02 94.9
  25 1.09 65.3
     
  1. For these 12 men, determine
  2.  i. their median age, in years.   (1 mark)

    --- 2 WORK AREA LINES (style=lined) ---

  3. ii. the mean of their body density, in kilograms per litre.   (1 mark)

    --- 2 WORK AREA LINES (style=lined) ---

  4. A least squares line is to be fitted to the data with the aim of predicting body density from weight.
  5.  i. Name the explanatory variable for this least squares line.   (1 mark)

    --- 1 WORK AREA LINES (style=lined) ---

  6. ii. Determine the slope of this least squares line.
  7.     Round your answer to three significant figures.   (1 mark)

    --- 1 WORK AREA LINES (style=lined) ---

  8. What percentage of the variation in body density can be explained by the variation in weight?
  9. Round your answer to the nearest percentage.   (1 mark)

    --- 2 WORK AREA LINES (style=lined) ---

Show Answers Only
  1.  i. `24`
  2. ii. `1.065\ text(kg/litre)`
  3. i. `text(Weight)`
  4. ii. `text(Slope) = -0.00112\ text{(by CAS)}`
  5. `29 text(%)`
Show Worked Solution
a.i.   `n = 12`  
  `text(Median)` `= (text{6th + 7th})/2`
    `= (24 + 24)/2`
    `= 24`


a.ii.   `text(Mean)` `= (∑\ text{body density})/12`
    `= 1.065\ text(kg/litre)`


b.i.   `text(Weight)`

♦ Mean mark b.ii. 29%.
MARKER’S COMMENT: Most students did not round correctly.

b.ii.   `text(Slope) = -0.00112\ text{(by CAS)}`


c.   `r` `= -0.53847\ text{(by CAS)}`
  `r^2` `= 0.289…`

 
`:. 29 text(%)`

Filed Under: Correlation and Regression Tagged With: Band 2, Band 3, Band 4, Band 5, smc-265-10-r / r^2 and Association, smc-265-20-Find LSRL Equation/Gradient, smc-265-75-Explanatory / Response

CORE, FUR2 2020 VCAA 3

In a study of the association between BMI and neck size, 250 men were grouped by neck size (below average, average and above average) and their BMI recorded.

Five-number summaries describing the distribution of BMI for each group are displayed in the table below along with the group size.

The associated boxplots are shown below the table.
 

  1. What percentage of these 250 men are classified as having a below average neck size?   (1 mark)

    --- 2 WORK AREA LINES (style=lined) ---

  2. What is the interquartile range (IQR) of BMI for the men with an average neck size?   (1 mark)

    --- 2 WORK AREA LINES (style=lined) ---

  3. People with a BMI of 30 or more are classified as being obese.
  4. Using this criterion, how many of these 250 men would be classified as obese? Assume that the BMI values were all rounded to one decimal place.   (1 mark)

    --- 3 WORK AREA LINES (style=lined) ---

  5. Do the boxplots support the contention that BMI is associated with neck size? Refer to the values of an appropriate statistic in your response.   (2 marks)

    --- 4 WORK AREA LINES (style=lined) ---

Show Answers Only
  1. `20 text(%)`
  2. `2.6`
  3. `23`
  4. `text(See Worked Solutions)`
Show Worked Solution
a.    `text(Percentage)` `= 50/250 xx 100`
    `= 20text(%)`


b.    `text(IQR)` `= 26.0-23.4`
    `= 2.6`


c.   `text{Outliers in average neck size}\ (text(BMI) >= 30) = 4`

♦♦ Mean mark part c. 22%.
COMMENT: Many students incorrectly counted the two “above average” outliers twice.

`:.\ text(Number classified as obese)`

`= 4 + 1/4 xx 76`

`= 23`


d.   `text(The boxplots support a strong association between)`

♦ Mean mark 49%.
MARKER’S COMMENT: General statement of change = 1 mark. Median or IQR values need to be quoted directly for the second mark.

`text(BMI and neck size as median BMI values increase)`

`text(as neck size increases.)`

`text(Below average neck sizes have a BMI of 21.6, which)`

`text(increases to 24.6 for average neck sizes and increases)`

`text(further to 28.1 for above average neck sizes.)`

Filed Under: Graphs - Stem/Leaf and Boxplots Tagged With: Band 2, Band 3, Band 5, smc-643-20-Parallel Box-Plots, smc-643-60-Outliers

CORE, FUR2 2020 VCAA 2

The neck size, in centimetres, of 250 men was recorded and displayed in the dot plot below.
 

  1. Write down the modal neck size, in centimetres, for these 250 men.   (1 mark)

    --- 1 WORK AREA LINES (style=lined) ---

  2. Assume that this sample of 250 men has been drawn at random from a population of men whose neck size is normally distributed with a mean of 38 cm and a standard deviation of 2.3 cm.
  3.  i. How many of these 250 men are expected to have a neck size that is more than three standard deviations above or below the mean? Round your answer to the nearest whole number.   (1 mark)

    --- 2 WORK AREA LINES (style=lined) ---

  4. ii. How many of these 250 men actually have a neck size that is more than three standard deviations above or below the mean?   (1 mark)

    --- 2 WORK AREA LINES (style=lined) ---

  5. The five-number summary for this sample of neck sizes, in centimetres, is given below.
     

    Use the five-number summary to construct a boxplot, showing any outliers if appropriate, on the grid below.   (2 marks)

    --- 3 WORK AREA LINES (style=lined) ---

Show Answers Only

a.    `text(Mode) = 38\ text(cm)`

b.i.   `1`

b.ii. `1`

c.    `text(See Worked Solutions)`

Show Worked Solution

a.   `text(Mode) = 38\ text(cm)`


♦ Mean mark part b.i. 40%.
b.i.   `text(Expected number of men)` `= (1-0.997) xx 250`
    `= 0.75`
    `= 1\ text{(nearest whole)}`


♦ Mean mark part b.ii. 42%.
b.ii.   `text(When)\ \ z = +- 3`
  `text(Neck size limits)` `= 38 +- (2.3 xx 3)`
    `= 44.9 or 31.1`

 
`:.\ text(1 man has neck size outside 3 s.d.)`
 

c.   `IQR = 39-36=3`

`text(Upper fence)\ =Q_3 + 1.5 xx 3=39 + 4.5=43.5`

`text(Lower fence)\ =Q_1-1.5 xx 3=36-4.5=31.5`


Filed Under: Graphs - Stem/Leaf and Boxplots, Normal Distribution Tagged With: Band 2, Band 4, Band 5, smc-600-20-z-score Intervals, smc-643-10-Single Box-Plots

Number, NAPX-p169217v02 SA

Karl picked 102 apples from his family orchard and packed them into small boxes.

Each box can hold 12 apples.

What is the smallest number of boxes Karl needs to make sure all the apples are packed?

Show Answers Only

`text(9)`

Show Worked Solution
`text(Boxes needed)` `= 102 ÷ 12`
  `= 8\ text(remainder 6)`
  `= 9\ text{boxes (round up)}`

Filed Under: Basic Concepts and Calculations Tagged With: Band 5, NAPX-SingleAnswer

Number, NAPX-p169217v01 SA

George has 84 toys in his collection.

He wanted to pack them into containers which can hold 5 toys each.

What is the smallest number of containers George needs to make sure all the toys are packed away?

Show Answers Only

`text(17)`

Show Worked Solution
`text(Containers needed)` `= 84 ÷ 5`
  `= 16\ text(remainder 4)`
  `~~ 17\ text{boxes (round up)}`

Filed Under: Basic Concepts and Calculations Tagged With: Band 5, NAPX-SingleAnswer

Measurement, NAPX-p169212v02

At the start of an experiment, Stephanie has 215 millilitres of chemical solution in a flask.

Stephanie then used some of the solution in the experiment.

The image below shows the volume of the chemical solution left in the flask.


How much of the solution was used?

 
  15 millilitres
 
100 millilitres
 
115 millilitres
 
150 millilitres

Show Answers Only

`115\ text(ml)`

Show Worked Solution
`text(Volume used)` `= 215 – 100`
  `= 115\ text(millilitres)`

Filed Under: Units of Measurement Tagged With: Band 5, NAPX-MultipleChoice

Measurement, NAPX-p169212v01

Rosa started with 227 millilitres of chemical solution in a flask.

She then poured some of the chemical solution into a test tube.

The level of chemical solution left in the flask is shown in the image below.


How much solution did Rosa pour into the test tube?

 
    27 millilitres
 
    40 millilitres
 
    47 millilitres
 
  220 millilitres

Show Answers Only

`text(27 millimetres)`

Show Worked Solution
`text(Volume)` `= 227 – 200`
  `= 27\ text(millilitres)`

Filed Under: Units of Measurement Tagged With: Band 5, NAPX-MultipleChoice

Number, NAPX-p168201v02

Jackson has 97 blocks.

He builds identical shapes that take 14 blocks each.

He had 13 blocks left.

How many shapes did Jackson made

 
   5
 
   6
 
   7
 
   9
Show Answers Only

`6`

Show Worked Solution

`97 \div 14 = 6 \ text{remainder} \ 13`

`therefore \ text{Jackson made 6 shapes.}`

Filed Under: Basic Concepts and Calculations, TESTLET AN Tagged With: Band 5, NAPX-MultipleChoice

Number, NAPX-p168201v01

Owen has 84 lego pieces.

He built identical shapes that each used 11 lego pieces.

He had over 7 lego pieces left.

How many shapes did Owen made

 
  10
 
  12
 
    8
 
    7
Show Answers Only

`7`

Show Worked Solution

`84 \div 11 = 7 \ text{remainder} \ 7`

`therefore \ text{Owen made 7 shapes.}`

Filed Under: Basic Concepts and Calculations Tagged With: Band 5, NAPX-MultipleChoice

Measurement, NAPX-p168199v02

The picture below is a shape made with 7 equilateral triangles. 

What is its perimeter?


    16 cm
 
    18 cm
 
    19 cm
 
    20 cm
Show Answers Only

`text{18 cm}`

Show Worked Solution

`text(Equilateral triangle → all sides are equal.)`

`text{Perimeter}` `= text{Number of sides} xx 2 \ text{cm}`
  `= 9 xx 2`
  `= 18 \ text{cm}`

Filed Under: Perimeter, Area and Volume, TESTLET C Tagged With: Band 5, NAPX-MultipleChoice

Measurement, NAPX-p168199v01

The picture below is a shape made with 4 rhombuses.

What is its perimeter?


  18 cm
 
  20 cm
 
  22 cm
 
  24 cm
Show Answers Only

`text{20 cm}`

Show Worked Solution

`text(Rhombus → all sides are equal length.)`

`text{Perimeter}` `= text{Number of sides} xx 2 \ text{cm}`
  `= 10 xx 2`
  `= 20 \ text{cm}`

Filed Under: Perimeter, Area and Volume, TESTLET C Tagged With: Band 5, NAPX-MultipleChoice

Number, NAPX-p168197v02

Which of these rectangles has the largest fraction of its area shaded?


Show Answers Only

Show Worked Solution

`text{2nd option has} \ frac{3}{4} \ text{of its area shaded (the most).}`

Filed Under: Fractions, TESTLET C Tagged With: Band 5, NAPX-MultipleChoice

Number, NAPX-p168197v01

Which of these circles has the largest fraction of its area shaded?


Show Answers Only

Show Worked Solution

`text{2nd option has the largest area shaded.}`

Filed Under: Fractions and Decimals Tagged With: Band 5, NAPX-MultipleChoice

Statistics, NAPX-p168030v02

8 of the tallest buildings in the United States are listed in the table below.

How much taller is New York’s 2nd tallest building than Chicago’s shortest building on this list?

 
    98 m
 
    83 m
 
  197 m
 
    37 m
Show Answers Only

`text{83 m}`

Show Worked Solution

`text{One Vanderbilt’s height – 875 North Michigan Avenue’s height}`

`= 427 – 344`

`= 83 \ text{m}`

Filed Under: Data and Statistics, TESTLET C Tagged With: Band 5, NAPX-MultipleChoice

Statistics, NAPX-p168030v01

7 of the world's longest rivers are listed in the table below.


How much shorter is China's longest river compared to Brazil's longest river?

 
    460 km
 
  1296 km
 
  2410 km
 
  2512 km
Show Answers Only

`text{460 km}`

Show Worked Solution

`text{Amazon River – Yangtze}`

`= 6760 – 6300`

`= 460 \ text{km}`

Filed Under: Data and Statistics Tagged With: Band 5, NAPX-MultipleChoice

Probability, NAPX-p168032v02

Marie flips an unbiased coin for 126 times.

Which result is most likely?

 
  38 heads
 
  52 heads
 
  60 heads
 
  79 tails
Show Answers Only

`text{60 heads}`

Show Worked Solution

`text{The expected result is 63 heads or tails (half of total).}`

`therefore \ text{Most likely result is 60 heads.}`

Filed Under: Probability, TESTLET C Tagged With: Band 5, NAPX-MultipleChoice

Probability, NAPX-p168032v01

Marie rolls a fair die 60 times.

Which result is most likely?

 
  5 rolls of number two
 
  7 rolls of number two
 
  9 rolls of number two
 
  13 rolls of number two
Show Answers Only

`text{8 rolls of number two}`

Show Worked Solution

`text{The expected result is 10 rolls for each number.}`

`therefore \ text{Most likely result is 9 rolls of number two.}`

Filed Under: Probability Tagged With: Band 5, NAPX-MultipleChoice

Algebra, NAPX-p168016v02

Amelia is making a pattern using nails.

The table below shows the number of nails she needs for the pattern to be complete.


   12
 
   15
 
   16
 
   18
Show Answers Only

`15`

Show Worked Solution

`text{Each new pattern adds the new pattern number to the previous total.}`

`text{Pattern # 5 is}`

`therefore \ text{Nails needed = 5 + 10 = 15}`

Filed Under: Patterns and Coordinate Geometry, TESTLET C Tagged With: Band 5, NAPX-MultipleChoice

Algebra, NAPX-p168016v01

Amelia is making a pattern using flowers

The table below shows the number of flowers she needs for the pattern to be complete.


  10
 
    9
 
  12
 
    5
Show Answers Only

`10`

Show Worked Solution

`text{The pattern is “increase by 2 each time.}`

`text{Pattern # 5 is}`

`therefore \ text{10 flowers are needed for pattern #5.}`

Filed Under: Patterns and The Number Plane Tagged With: Band 5, NAPX-MultipleChoice

  • « Previous Page
  • 1
  • …
  • 45
  • 46
  • 47
  • 48
  • 49
  • …
  • 81
  • Next Page »

Copyright © 2014–2025 SmarterEd.com.au · Log in