SmarterEd

Aussie Maths & Science Teachers: Save your time with SmarterEd

  • Login
  • Get Help
  • About

Statistics, 2ADV S2 2024 HSC 16

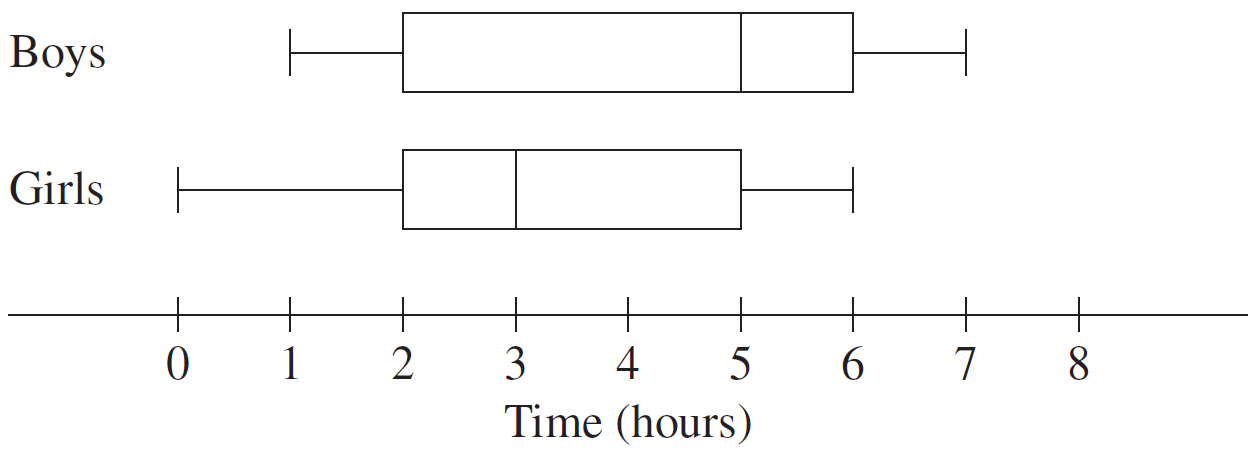
Flowers were planted in two gardens (Garden A and Garden B).

On a particular day, 25 flowers were randomly selected from each garden and their heights measured in millimetres.

The data are represented in parallel box-plots.
 

Compare the two datasets by examining the skewness of the distributions, and the measures of central tendency and spread.   (3 marks)

--- 8 WORK AREA LINES (style=lined) ---

Show Answers Only

\(\text{Skewness comparison:}\)

\(\rightarrow\ \text{Garden A is negatively skewed while Garden B is positively skewed.}\)
  

\(\text{Measures of central tendency comparison:}\)

\(\rightarrow\ \text{IQR (A)}\ \approx 17\ \text{ is greater than IQR (B)}\ \approx 9\)

\(\rightarrow\ \text{This means the middle 50% of data points of B are more closely clustered} \)
     \(\text{around the median than A.}\)

\(\text{Spread comparison:}\)

\(\rightarrow\ \text{Range (A)}\ \approx 39\ \text{is less than range (B)}\ \approx 28\)

\(\rightarrow\ \text{This means the spread of data points of A is wider than the spread of data points of B.}\)

\(\text{Overall, flowers from Garden B will tend to be higher than Garden A flowers as well as exhibiting}\)
\(\text{a larger range of heights.}\)

Show Worked Solution

\(\text{Skewness comparison:}\)

\(\rightarrow\ \text{Garden A is negatively skewed while Garden B is positively skewed.}\)
  

\(\text{Measures of central tendency comparison:}\)

\(\rightarrow\ \text{IQR (A)}\ \approx 17\ \text{ is greater than IQR (B)}\ \approx 9\)

\(\rightarrow\ \text{This means the middle 50% of data points of B are more closely clustered}\)
    \(\text{around the median than A.}\)
 

\(\text{Spread comparison:}\)

\(\rightarrow\ \text{Range (A)}\ \approx 39\ \text{is less than range (B)}\ \approx 28\)

\(\rightarrow\ \text{This means the spread of data points of A is wider than the spread of data points of B.}\)
 

\(\text{Overall, flowers from Garden B will tend to be higher than Garden A flowers as well as exhibiting}\)
\(\text{a larger range of heights.}\)

Filed Under: Summary Statistics - Box Plots (Y12) Tagged With: 2adv-std2-common, Band 4, smc-1000-20-Parallel Box-Plots

Statistics, STD2 S1 2019 HSC 39

Two netball teams, Team A and Team B, each played 15 games in a tournament. For each team, the number of goals scored in each game was recorded.

The frequency table shows the data for Team A.


The data for Team B was analysed to create the box-plot shown.


Compare the distributions of the number of goals scored by the two teams. Support your answer with the construction of a box-plot for the data for Team A.  (5 marks)

--- 8 WORK AREA LINES (style=lined) ---

Show Answers Only

`text(See Worked Solution)`

Show Worked Solution

`text(Team A: High = 28, Low = 19,)\ Q_1 = 23, Q_3 = 27,\ text{Median = 26}`
 

`text(Team A’s distribution is negatively skewed while)`

♦♦ Mean mark 28%.

`text(Team B’s distribution is slightly positively skewed.)`

`text(The standard deviation of Team A’s distribution is)`

`text(smaller than Team B, as both its IQR and range is)`

`text(smaller.)`

`text(Team B is a more successful team at scoring goals)`

`text(as each value in its 5-point summary is higher than)`

`text(Team A’s equivalent value.)`

Filed Under: Summary Statistics - Box Plots (Std 2), Summary Statistics - Box Plots (Std2-2027), Summary Statistics - Box Plots (Y12) Tagged With: Band 5, common-content, smc-1000-20-Parallel Box-Plots, smc-1000-30-Draw Box-Plots, smc-6313-20-Parallel Box Plots, smc-6313-30-Draw Box Plots, smc-825-20-Parallel Box-Plots, smc-825-30-Draw Box-Plots

Statistics, STD2 S1 2016 HSC 22 MC

The box-and-whisker plots show the results of a History test and a Geography test.
 

In History, 112 students completed the test. The number of students who scored above 30 marks was the same for the History test and the Geography test.

How many students completed the Geography test?

  1. 8
  2. 50
  3. 56
  4. 112
Show Answers Only

`=> C`

Show Worked Solution

`text{In History} \ => \  text{Q}_3 = 30\ \text{marks}`

`:.\ text{Scoring over 30}\ = 25text(%) xx 112 = 28\ \text{students}`
 

`text{In Geography} \ => \ text{Median}\ = 30\ \text{marks}`

`:.\ text{Students completing Geography}\ =2 xx 28 = 56\ \text{students}`

`=> C`

Filed Under: Box Plots and 5-Number Summary, Stem & Leaf, Box & Whisker, Summary Statistics - Box Plots (Std 2), Summary Statistics - Box Plots (Std2-2027), Summary Statistics - Box Plots (Y12), Summary Statistics (Std 1) Tagged With: Band 4, common-content, num-title-ct-corea, num-title-qs-hsc, smc-1000-20-Parallel Box-Plots, smc-1131-35-Box Plots, smc-5021-60-Box plots (parallel), smc-6313-20-Parallel Box Plots, smc-825-20-Parallel Box-Plots

Statistics, STD2 S1 2005 HSC 22 MC

Two groups of people were surveyed about their weekly wages. The results are shown in the box-and-whisker plots.
 

Which of the following statements is true for the people surveyed?

  1. The same percentage of people in each group earned more than $325 per week.
  2. Approximately 75% of people under 21 years earned less than $350 per week.
  3. Approximately 75% of people 21 years and older earned more than $350 per week.
  4. Approximately 50% of people in each group earned between $325 and $350 per week.
Show Answers Only

`B`

Show Worked Solution

`text{Option A: 50% of Under 21 group earned over $325 and 75%}`

`text{of Over 21 group did. NOT TRUE.}`
 

`text{Option B: 75% of Under 21 group earned below $350 is TRUE.}`
 

`text{Options C and D: can both be proven to be untrue using their}`

`text{median and quartile values.}`

`=>  B`

Filed Under: Box Plots and 5-Number Summary, Stem & Leaf, Box & Whisker, Summary Statistics - Box Plots (Std 2), Summary Statistics - Box Plots (Std2-2027), Summary Statistics - Box Plots (Y12) Tagged With: Band 6, common-content, num-title-ct-corea, num-title-qs-hsc, smc-1000-20-Parallel Box-Plots, smc-5021-60-Box plots (parallel), smc-6313-20-Parallel Box Plots, smc-825-20-Parallel Box-Plots

Statistics, STD2 S1 2008 HSC 10 MC

The marks for a Science test and a Mathematics test are presented in box-and-whisker plots.
 

 Which measure must be the same for both tests?

  1. Mean
  2. Range
  3. Median
  4. Interquartile range
Show Answers Only

`D`

Show Worked Solution

`text(IQR)=text(Upper Quartile)-text(Lower Quartile)`

`text{In both box plots, IQR = 3 intervals (against bottom scale)}`

`=>  D`

Filed Under: Box Plots and 5-Number Summary, Stem & Leaf, Box & Whisker, Summary Statistics - Box Plots (Std 2), Summary Statistics - Box Plots (Std2-2027), Summary Statistics - Box Plots (Y12), Summary Statistics (Std 1) Tagged With: Band 4, common-content, num-title-ct-corea, num-title-qs-hsc, smc-1000-20-Parallel Box-Plots, smc-1131-35-Box Plots, smc-5021-60-Box plots (parallel), smc-6313-20-Parallel Box Plots, smc-825-20-Parallel Box-Plots

Statistics, STD2 S1 2014 HSC 29c

Terry and Kim each sat twenty class tests. Terry’s results on the tests are displayed in the box-and-whisker plot shown in part (i).
 

  1. Kim’s  5-number summary for the tests is  67,  69,  71,  73,  75.


    Draw a box-and-whisker plot to display Kim’s results below that of Terry’s results.   (1 mark)


  2. What percentage of Terry’s results were below 69?     (1 mark)

    --- 1 WORK AREA LINES (style=lined) ---

  3. Terry claims that his results were better than Kim’s. Is he correct?


    Justify your answer by referring to the summary statistics and the skewness of the distributions.    (4 marks)

    --- 8 WORK AREA LINES (style=lined) ---

Show Answers Only
  1. `text(See Worked Solutions)`
  2. `text(50%)`
  3. `text(See Worked Solutions)`
Show Worked Solution
i.    


♦ Mean mark 39%

ii.  `text(50%)`


iii.  `text(Terry’s results are more positively skewed than)`

♦♦ Mean mark 29%
COMMENT: Examiners look favourably on using language of location in answers, particularly the areas they have specifically pointed students towards (skewness in this example).

`text(Kim’s and also have a higher limit high.)`

`text(However, Kim’s results are more consistent,)`

`text(showing a tighter IQR. They also have a)`

`text(significantly higher median than Terry’s and)`

`text(are evenly skewed.)`

`:.\ text(Kim’s results were better.)`

Filed Under: Stem & Leaf, Box & Whisker, Summary Statistics - Box Plots (Std 2), Summary Statistics - Box Plots (Std2-2027), Summary Statistics - Box Plots (Y12) Tagged With: Band 3, Band 5, common-content, smc-1000-20-Parallel Box-Plots, smc-1000-30-Draw Box-Plots, smc-6313-20-Parallel Box Plots, smc-6313-30-Draw Box Plots, smc-825-20-Parallel Box-Plots, smc-825-30-Draw Box-Plots

Statistics, STD2 S1 2010 HSC 27b

The graphs show the distribution of the ages of children in Numbertown in 2000 and 2010.
  

  1. In 2000 there were 1750 children aged 0–18 years.


    How many children were aged 12–18 years in 2000?   (1 mark)

    --- 1 WORK AREA LINES (style=lined) ---

  2. The number of children aged 12–18 years is the same in both 2000 and 2010.


    How many children aged 0–18 years are there in 2010?    (1 mark)

    --- 1 WORK AREA LINES (style=lined) ---

  3. Identify TWO changes in the distribution of ages between 2000 and 2010. In your answer, refer to measures of location or spread or the shape of the distributions.   (2 marks)

    --- 5 WORK AREA LINES (style=lined) ---

  4. What would be ONE possible implication for government planning, as a consequence of this change in the distribution of ages?   (1 mark)

    --- 2 WORK AREA LINES (style=lined) ---

Show Answers Only

i.    `875`

ii.    `3500`

iii.  `text{Changes in distribution (include 2 of the following):}`

  • `text(the lower quartile age is lower in 2010)`
  • `text(the median is lower in 2010)`
  • `text(the upper quartile age is lower in 2010)`
  • `text(the interquartile range is greater in 2010)`
  • `text(2010 is positively skewed while 2000 is negatively)`

iv.  `text(Implication for government planning:)`

`text(Since the children are getting younger in 2010,)`

  • `text(Approve and build more childcare facilities)`
  • `text(Build more school and public playgrounds)`
Show Worked Solution

i.    `text{Since the median = 12 years}`

♦ Mean mark (i) 45%

`=>\ text{50% of children are aged 12–18 years}`

`:.\ text{Children aged 12–18}\ = 50\text{%}\ xx 1750 = 875`


♦♦ Mean mark (ii) 25%

ii.   `text{Upper quartile (2010) = 12 years}`

`text{Children in upper quartile = 875 (from part (i))}`

`:.\ text{Children aged 0–18}\ =4 xx 875= 3500`
 

iii.  `text{Changes in distribution (include 2 of the following):}`

♦ Mean mark (iii) 35%
MARKER’S COMMENT: A number of students incorrectly identified “positive” skew as “negative” skew here.
  • `text(the lower quartile age is lower in 2010)`
  • `text(the median is lower in 2010)`
  • `text(the upper quartile age is lower in 2010)`
  • `text(the interquartile range is greater in 2010)`
  • `text(2010 is positively skewed while 2000 is negatively)`

iv.  `text(Implication for government planning:)`

♦ Mean mark (iv) 46%
MARKER’S COMMENT: Answers should reflect the 1 mark allocation.

`text(Since the children are getting younger in 2010,)`

  • `text(Approve and build more childcare facilities)`
  • `text(Build more school and public playgrounds)`

Filed Under: Box Plots and 5-Number Summary, Stem & Leaf, Box & Whisker, Summary Statistics - Box Plots (Std 2), Summary Statistics - Box Plots (Std2-2027), Summary Statistics - Box Plots (Y12) Tagged With: Band 5, common-content, num-title-ct-corea, num-title-qs-hsc, smc-1000-20-Parallel Box-Plots, smc-5021-60-Box plots (parallel), smc-5021-80-Inferences from dataset, smc-6313-20-Parallel Box Plots, smc-825-20-Parallel Box-Plots

Statistics, STD2 S1 2009 HSC 26a

In a school, boys and girls were surveyed about the time they usually spend on the internet over a weekend. These results were displayed in box-and-whisker plots, as shown below. 
 

2UG-2009-26a

  1. Find the interquartile range for boys.   (1 mark)

    --- 1 WORK AREA LINES (style=lined) ---

  2. What percentage of girls usually spend 5 or less hours on the internet over a weekend?  (1 mark)

    --- 1 WORK AREA LINES (style=lined) ---

  3. Jenny said that the graph shows that the same number of boys as girls usually spend between 5 and 6 hours on the internet over a weekend.


    Under what circumstances would this statement be true?    (1 mark)

    --- 2 WORK AREA LINES (style=lined) ---

Show Answers Only
  1. `4`
  2. `text(75% of girls spend 5 hours or less)`
  3. `text(5-6 hours for girls accounts for 25% of all girls.)`
  4. `text(5-6 hours for boys accounts for 25% of all boys,)`
  5. `text(as median to upper quartile is 25%.)`
     
  6. `=>\ text(This will be the same number only if the number of)`
  7. `text(all girls surveyed equals the number of boys surveyed.)`
Show Worked Solution
i.    `text(Interquartile range)` `= 6` `- 2`
    `= 4`


♦♦ Mean mark part ii: 31%
ii.    `text(Upper quartile = 5`
  `:.\ text(75% of girls spend 5 or less hours)`


♦♦♦ Mean mark part iii: 9%
iii.    `text(5-6 hours for girls accounts for 25% of all girls.)`
  `text(5-6 hours for boys accounts for 25% of all boys,)`
  `text{(median to the upper quartile represents 25%.)}`
  `=>\ text(This will only be the same number if the number of)`
  `text(all girls surveyed equals the number of boys surveyed.)`

Filed Under: Stem & Leaf, Box & Whisker, Summary Statistics - Box Plots (Std 2), Summary Statistics - Box Plots (Std2-2027), Summary Statistics - Box Plots (Y12) Tagged With: Band 4, Band 5, Band 6, common-content, smc-1000-20-Parallel Box-Plots, smc-6313-20-Parallel Box Plots, smc-825-20-Parallel Box-Plots

Statistics, STD2 S1 2012 HSC 28d

The test results in English and Mathematics for a class were recorded and displayed in the box-and-whisker plots.
 

  1. What is the interquartile range for English?  (1 mark)

    --- 1 WORK AREA LINES (style=lined) ---

  2. Compare and contrast the two data sets by referring to the skewness of the distributions and the measures of location and spread.   (3 marks)

    --- 6 WORK AREA LINES (style=lined) ---

Show Answers Only

i.    `text{IQR}_text{(English)}\ = 80-50=30`

ii.  `text(Skewness)`

  • `text(English has greater negative skew)`
  • `text(Maths is more normally distributed)`

`text(Location and Spread)`

  • `text(English has a range of 85, Maths has 40.)`
  • `text{English has larger IQR than Maths (30 vs 15)}`
  • `text{Maths’ median (75) is higher than English (70)}`
  • `text{Same upper quartile marks (80)}`
  • `text(English has highest and lowest individual mark)`
Show Worked Solution

i.    `text{IQR}_text{(English)}\ = 80-50=30`

♦ Mean mark (ii) 35%
MARKER’S COMMENT: Markers are looking for students to use the correct language of location and spread such as mean, median, interquartile range, standard deviation and skewness.

ii.  `text(Skewness)`

  • `text(English has greater negative skew)`
  • `text(Maths is more normally distributed)`

`text(Location and Spread)`

  • `text(English has a range of 85, Maths has 40.)`
  • `text{English has larger IQR than Maths (30 vs 15)}`
  • `text{Maths’ median (75) is higher than English (70)}`
  • `text{Same upper quartile marks (80)}`
  • `text(English has highest and lowest individual mark)`

Filed Under: Stem & Leaf, Box & Whisker, Summary Statistics - Box Plots (Std 2), Summary Statistics - Box Plots (Std2-2027), Summary Statistics - Box Plots (Y12) Tagged With: Band 4, Band 5, common-content, smc-1000-20-Parallel Box-Plots, smc-6313-20-Parallel Box Plots, smc-825-20-Parallel Box-Plots

Copyright © 2014–2025 SmarterEd.com.au · Log in