SmarterEd

Aussie Maths & Science Teachers: Save your time with SmarterEd

  • Login
  • Get Help
  • About

HMS, HAG NSE-Bank 13 MC

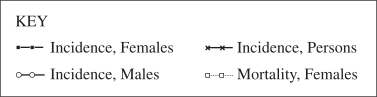
The graph shows incidence and mortality rates (per 100 000 of the selected group) for a chronic disease.
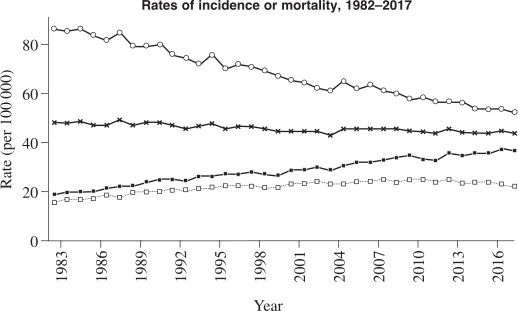
 

To which chronic disease does the graph relate?

  1. Diabetes
  2. Lung cancer
  3. Breast cancer
  4. Cardiovascular disease
Show Answers Only

B

Show Worked Solution
  • B is correct: Lung cancer has relatively similar incidence and mortality rates due to its comparatively low survival rate.

Other options:

  • A is incorrect: Diabetes has a much lower mortality rate compared with its prevalence in the population.
  • C is incorrect: Breast cancer has a much higher incidence rate than mortality rate due to relatively high survival rates.
  • D is incorrect: Cardiovascular disease generally has a much higher incidence than mortality rate.

Filed Under: Chronic Conditions, Diseases and Injury Tagged With: Band 5, smc-5477-10-Cancer, smc-5477-30-Groups and Changing Patterns, smc-5477-50-Stimulus

HMS, HAG 2018 HSC 12 MC

Two images of blood flow are shown.

Image \(A\) represents healthy blood flow.

What condition does Image \(B\) represent?

  1. Arteriosclerosis
  2. Atherosclerosis
  3. Low blood pressure
  4. Low cholesterol levels
Show Answers Only

\(B\)

Show Worked Solution

  • B is correct: Atherosclerosis involves plaque buildup narrowing arteries, contrasting with healthy blood flow.

Other Options:

  • A is incorrect: Arteriosclerosis involves artery hardening, not necessarily visible narrowing.
  • C is incorrect: Low blood pressure is a measurement, not a structural blood vessel condition.
  • D is incorrect: Low cholesterol levels are protective, not a disease condition shown in images.

♦♦ Mean mark 46%.

Filed Under: Chronic Conditions, Diseases and Injury Tagged With: Band 5, smc-5477-05-Cardiovascular disease, smc-5477-50-Stimulus

HMS, HAG 2021 HSC 19 MC

The graph shows the trends in the incidence of a type of cancer for males and females in Australia from 2004 to 2019.

Which row of the table identifies the type of cancer represented in the graph and the most effective strategy for the federal government to implement in order to reduce its overall expenditure on this type of cancer by 2040?

Show Answers Only

\(C\)

Show Worked Solution
  • C is correct: Graph pattern matches skin cancer trends; prevention most cost-effective.

Other Options:

  • A is incorrect: Screening less effective than prevention for skin cancer.
  • B is incorrect: Pattern doesn’t match lung cancer epidemiology trends.
  • D is incorrect: Letters less effective than comprehensive prevention programs.

♦ Mean mark 55%.

Filed Under: Chronic Conditions, Diseases and Injury Tagged With: Band 5, smc-5477-10-Cancer, smc-5477-30-Groups and Changing Patterns, smc-5477-50-Stimulus

HMS, HAG 2021 HSC 13 MC

The chance of being alive for five years after being diagnosed with a condition, compared with the general population, is called the 5-year relative survival rate.

The table shows data for breast cancer and lung cancer in Australia, 2011-2015.

\begin{array} {|l|c|}
\hline
\rule{0pt}{2.5ex}\ \ \textit{Cancer}\ \ \rule[-1ex]{0pt}{0pt} & \textit{5-year relative survival rate}\\
\hline
\rule{0pt}{2.5ex}\text{Breast}\rule[-1ex]{0pt}{0pt} & \text{90.8%}\\
\hline
\rule{0pt}{2.5ex}\text{Lung}\rule[-1ex]{0pt}{0pt} & \text{17.4%}\\
\hline
\end{array}

Which of the following provides the most likely reason for the difference in these 5-year relative survival rates?

  1. Health promotion strategies in schools have been more effective in reducing risk factors for lung cancer compared to breast cancer.
  2. There was a higher hospitalisation rate and greater demand for emerging treatments for lung cancer compared to breast cancer.
  3. There was a higher demand for palliative care services when individuals were diagnosed with breast cancer compared to lung cancer.
  4. Technology advancements have increased early detection and provided more successful treatment options for breast cancer compared to lung cancer.
Show Answers Only

\(D\)

Show Worked Solution
  • D is correct: Early detection technology improves breast cancer survival rates.

Other Options:

  • A is incorrect: School strategies less effective for lung cancer.
  • B is incorrect: Higher demand doesn’t improve survival outcomes.
  • C is incorrect: Breast cancer has better prognosis requiring less palliative care.

Filed Under: Chronic Conditions, Diseases and Injury Tagged With: Band 2, smc-5477-10-Cancer, smc-5477-50-Stimulus

HMS, HAG 2022 HSC 20 MC

The table shows the incidence rate and mortality rate for two types of cancer \((X, Y)\) with the highest mortality rate for females in Australia in 2017.

\begin{array} {|c|c|c|}
\hline
\rule{0pt}{2.5ex}\textit{Type of cancer}\rule[-1ex]{0pt}{0pt} & \textit{Incidence rate} & \textit{Mortality rate} \\ & \textit{per 100 000} & \textit{per 100 000}\\
\hline
\rule{0pt}{2.5ex} X \rule[-1ex]{0pt}{0pt} & 36.2 & 21.8 \\
\hline
\rule{0pt}{2.5ex} Y \rule[-1ex]{0pt}{0pt} & 124.8 & 19.2 \\
\hline
\end{array}

Which statement best explains why cancer Y has a lower mortality rate than cancer X ?

  1. Government funding has increased for research into treatment options for cancer Y.
  2. Health services have been reoriented so that cancer Y is detected and treated earlier.
  3. Individuals have enhanced their personal skills to effectively address the modifiable risk factors for cancer Y.
  4. An increased number of out-patient health services for cancer Y has improved access for the priority population group.
Show Answers Only

\( B \)

Show Worked Solution

  • B is correct: Earlier detection and treatment improves survival rates despite higher incidence.

Other Options:

  • A is incorrect: Research funding doesn’t directly explain current mortality differences.
  • C is incorrect: Personal skills affect incidence, not mortality-to-incidence ratio.
  • D is incorrect: Outpatient services don’t explain lower mortality with higher incidence.

Filed Under: Chronic Conditions, Diseases and Injury Tagged With: Band 4, smc-5477-10-Cancer, smc-5477-50-Stimulus

HMS, HAG 2023 HSC 6 MC

The following table represents the number of deaths per 100 000 population in males aged 55-64 years in 1980 and again in 2020 for a range of conditions.
 

Conditions Male deaths per 100 000 population
aged 55–64
1980 2020
J 14 7
K 100 20
L 173 53
M 600 79

 
Which condition is represented by the letter \(J\) in the table? 

  1. Skin cancer
  2. Lung cancer
  3. Coronary heart disease
  4. Cerebrovascular disease
Show Answers Only

\(A\)

Show Worked Solution
  • A is correct: Data shows condition J had smallest number of deaths per 100,000 in both 1980 and 2020, consistent with skin cancer mortality patterns.

Other Options:

  • B is incorrect: Would show higher mortality rates than displayed for condition J.
  • C is incorrect: Has significantly higher mortality rates than shown.
  • D is incorrect: Higher mortality rate than condition J.

♦♦ Mean mark 41%.

Filed Under: Chronic Conditions, Diseases and Injury, Current Health Status Tagged With: Band 5, smc-5474-10-Morbidity and Mortality, smc-5474-50-Data Interpretation, smc-5477-10-Cancer, smc-5477-30-Groups and Changing Patterns, smc-5477-50-Stimulus

HMS, HAG 2024 HSC 14 MC

The graph shows the number of deaths of Australian females over time for TWO cancers, X and Y, that resulted in more deaths than for any other forms of cancer.

Which cancer is represented by cancer Y?

  1. Breast
  2. Cervical
  3. Lung
  4. Skin
Show Answers Only

\(C\)

Show Worked Solution
  • C is correct: Cancer Y represents lung cancer, a leading cause of cancer deaths in Australian females, with numbers declining since 2000.

Other Options:

  • A is incorrect: Breast cancer would likely show as the higher line (X).
  • B is incorrect: Cervical cancer has much lower mortality numbers.
  • D is incorrect: Skin cancer mortality is significantly lower than lung cancer.

♦♦♦ Mean mark 34%.

Filed Under: Chronic Conditions, Diseases and Injury Tagged With: Band 5, smc-5477-10-Cancer, smc-5477-30-Groups and Changing Patterns, smc-5477-50-Stimulus

Copyright © 2014–2026 SmarterEd.com.au · Log in