SmarterEd

Aussie Maths & Science Teachers: Save your time with SmarterEd

  • Login
  • Get Help
  • About

HMS, HAG EQ-Bank 122

Australia's Health 2024 data shows that disease burden varies significantly across the lifespan, with mental health conditions and substance use disorders causing the greatest burden in ages 5-44, while musculoskeletal, cardiovascular and cancer become leading causes in ages 45-84. Neurological conditions, particularly dementia, dominate burden in those aged 65 and over.

Analyse how this age-related disease burden data reflects the changing health needs of Australia's population and its implications for healthcare system planning.   (12 marks)

--- 30 WORK AREA LINES (style=lined) ---

Show Answers Only

Overview Statement

  • The age-related disease burden patterns show clear relationships between different life stages, ageing processes and healthcare needs. 
  • Thus revealing how Australia’s changing population directly affects health system planning and service delivery.

Component Relationship 1

  • Mental health and substance use disorders being highest in younger age groups reflects the major challenges and pressures experienced during school, work and relationship formation.
  • Educational stress, starting careers, family pressures and social expectations create mental health problems that appear as anxiety, depression and drug use patterns.
  • This relationship shows how early life experiences significantly influence future health outcomes and require early mental health support services.
  • The implications show that investing in youth mental health programs can prevent more expensive chronic disease treatment later, suggesting that prevention strategies produce better health and cost savings for the healthcare system.

Component Relationship 2

  • The shift to heart disease, cancer and muscle problems in middle age shows how lifestyle choices and work exposures over many years combine with natural ageing processes.
  • Years of diet patterns, exercise habits, work stress and environmental factors build up to chronic disease development during working age years.
  • This change reveals the strong connection between earlier lifestyle choices and later health problems, showing how decisions made in youth directly affect middle-age health status.
  • The importance of this pattern shows that chronic disease prevention programmes must focus on younger people before diseases develop, requiring healthcare systems to change focus from treating illness to preventing it.

Implications and Synthesis

  • These connected age-related patterns show that effective healthcare planning must prepare for population changes and develop approaches that focus on prevention in young people, chronic disease care in middle age, and managing multiple conditions in older populations.
Show Worked Solution

Overview Statement

  • The age-related disease burden patterns show clear relationships between different life stages, ageing processes and healthcare needs. 
  • Thus revealing how Australia’s changing population directly affects health system planning and service delivery.

Component Relationship 1

  • Mental health and substance use disorders being highest in younger age groups reflects the major challenges and pressures experienced during school, work and relationship formation.
  • Educational stress, starting careers, family pressures and social expectations create mental health problems that appear as anxiety, depression and drug use patterns.
  • This relationship shows how early life experiences significantly influence future health outcomes and require early mental health support services.
  • The implications show that investing in youth mental health programs can prevent more expensive chronic disease treatment later, suggesting that prevention strategies produce better health and cost savings for the healthcare system.

Component Relationship 2

  • The shift to heart disease, cancer and muscle problems in middle age shows how lifestyle choices and work exposures over many years combine with natural ageing processes.
  • Years of diet patterns, exercise habits, work stress and environmental factors build up to chronic disease development during working age years.
  • This change reveals the strong connection between earlier lifestyle choices and later health problems, showing how decisions made in youth directly affect middle-age health status.
  • The importance of this pattern shows that chronic disease prevention programmes must focus on younger people before diseases develop, requiring healthcare systems to change focus from treating illness to preventing it.

Implications and Synthesis

  • These connected age-related patterns show that effective healthcare planning must prepare for population changes and develop approaches that focus on prevention in young people, chronic disease care in middle age, and managing multiple conditions in older populations.

Filed Under: Current Health Status Tagged With: Band 6, smc-5474-10-Morbidity and Mortality, smc-5474-50-Data Interpretation

HMS, HAG EQ-Bank 121

Recent epidemiological data shows that Australian life expectancy decreased for the first time since the mid-1900s during 2020-2022, while simultaneously showing that males experience higher total disease burden than females across most age groups.

Explain how this data reflects current challenges in Australian population health.   (5 marks)

--- 15 WORK AREA LINES (style=lined) ---

Show Answers Only
  • The decrease in life expectancy during 2020-2022 demonstrates that infectious diseases can still significantly impact population health, as evidenced by COVID-19 becoming the third leading cause of death and disrupting decades of steady improvement.
  • This reveals that Australia’s health system faced unprecedented challenges during the pandemic, resulting in increased mortality from both COVID-19 infections and other causes due to delayed medical treatments and healthcare service disruptions.
  • The higher disease burden experienced by males across most age groups indicates that persistent gender-based health inequities remain unresolved, reflecting significant differences in health-seeking behaviours, workplace risk exposures and lifestyle choices.
  • This pattern shows that males are more likely to experience fatal burden from preventable conditions like cardiovascular disease and intentional injuries, while females experience more non-fatal burden from anxiety disorders and chronic musculoskeletal conditions.
  • The combination of these contrasting trends demonstrates that Australian population health faces both emerging infectious disease threats and entrenched chronic disease inequities that require comprehensive, multi-faceted public health interventions and targeted prevention strategies.
Show Worked Solution
  • The decrease in life expectancy during 2020-2022 demonstrates that infectious diseases can still significantly impact population health, as evidenced by COVID-19 becoming the third leading cause of death and disrupting decades of steady improvement.
  • This reveals that Australia’s health system faced unprecedented challenges during the pandemic, resulting in increased mortality from both COVID-19 infections and other causes due to delayed medical treatments and healthcare service disruptions.
  • The higher disease burden experienced by males across most age groups indicates that persistent gender-based health inequities remain unresolved, reflecting significant differences in health-seeking behaviours, workplace risk exposures and lifestyle choices.
  • This pattern shows that males are more likely to experience fatal burden from preventable conditions like cardiovascular disease and intentional injuries, while females experience more non-fatal burden from anxiety disorders and chronic musculoskeletal conditions.
  • The combination of these contrasting trends demonstrates that Australian population health faces both emerging infectious disease threats and entrenched chronic disease inequities that require comprehensive, multi-faceted public health interventions and targeted prevention strategies.

Filed Under: Current Health Status Tagged With: Band 4, smc-5474-20-Life Expectancy and Trends, smc-5474-30-Gender Inequities, smc-5474-50-Data Interpretation

HMS, HAG EQ-Bank 120

A health report shows that coronary heart disease mortality rates have declined by more than 80% since the 1960s, while cancer mortality rates have decreased by 32% over the last 30 years. However, chronic conditions now represent the vast majority of deaths in Australia.

Explain what this data reveals about Australia's health transition.   (3 marks)

--- 9 WORK AREA LINES (style=lined) ---

Show Answers Only
  • The declining mortality rates demonstrate that medical advances and prevention strategies have successfully reduced deaths from coronary heart disease and cancer.
  • However, this creates a paradox where chronic conditions still dominate mortality statistics because Australians live longer and develop multiple age-related conditions.
  • This reveals that Australia has experienced an epidemiological transition where improved survival leads to increased chronic disease burden in older populations.
Show Worked Solution
  • The declining mortality rates demonstrate that medical advances and prevention strategies have successfully reduced deaths from coronary heart disease and cancer.
  • However, this creates a paradox where chronic conditions still dominate mortality statistics because Australians live longer and develop multiple age-related conditions.
  • This reveals that Australia has experienced an epidemiological transition where improved survival leads to increased chronic disease burden in older populations.

Filed Under: Current Health Status Tagged With: Band 3, smc-5474-20-Life Expectancy and Trends, smc-5474-50-Data Interpretation

HMS, HAG EQ-Bank 7 MC

When comparing the leading causes of disease burden with the leading causes of death in Australia, which statement BEST demonstrates the relationship between morbidity and mortality patterns?

  1. Conditions causing the highest disease burden may differ from those causing the most deaths
  2. Mental health conditions rank equally high in both disease burden and mortality statistics
  3. Cancer leads both disease burden and mortality as the primary health concern
  4. Cardiovascular diseases have minimal impact on both disease burden and mortality rates
Show Answers Only

\(A\)

Show Worked Solution
  • A is correct: Mental health ranks high in burden but not in top mortality causes.

Other Options:

  • B is incorrect: Mental health high in burden, not in top death causes.
  • C is incorrect: Cancer leads burden but coronary heart disease leads deaths.
  • D is incorrect: Cardiovascular diseases feature prominently in both measures.

Filed Under: Current Health Status Tagged With: Band 6, smc-5474-10-Morbidity and Mortality, smc-5474-50-Data Interpretation

HMS, HAG EQ-Bank 6 MC

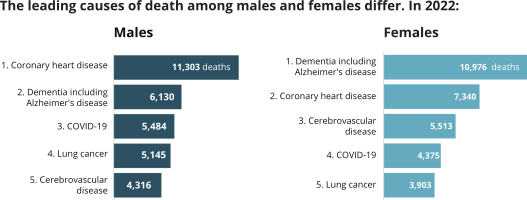
Based on Australia's Health 2024 mortality data, which statement BEST explains the pattern of leading causes of death between males and females in 2022?

  1. Males and females share identical top 5 causes of death in the same ranking order
  2. The same 5 conditions cause the most deaths but males have higher absolute numbers for coronary heart disease
  3. Infectious diseases rank higher for females than males in the top 5 causes
  4. Cancer-related deaths affect males significantly more than females across all types
Show Answers Only

\(B\)

Show Worked Solution
  • B is correct: Same 5 causes but males have 11,303 coronary deaths vs 10,976 females.

Other Options:

  • A is incorrect: Same causes but different ranking order between genders.
  • C is incorrect: COVID-19 ranks similarly for both genders.
  • D is incorrect: Lung cancer affects both genders in top 5.

Filed Under: Current Health Status Tagged With: Band 5, smc-5474-10-Morbidity and Mortality, smc-5474-30-Gender Inequities, smc-5474-50-Data Interpretation

HMS, HAG EQ-Bank 4 MC

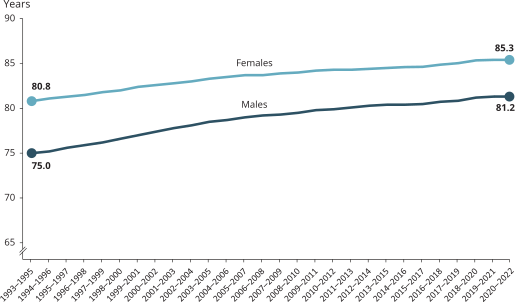
The graph below shows life expectancy trends in Australia from 1993-2022. 

Based on this data trend, which statement BEST describes what the epidemiological data reveals about recent Australian health patterns?

  1. Life expectancy has remained constant for both males and females since 1993
  2. The gender gap in life expectancy has increased significantly over this period
  3. Life expectancy steadily increased until 2020-2022 when it showed a slight decline
  4. Males consistently have higher life expectancy than females throughout this period
Show Answers Only

\(C\)

Show Worked Solution
  • C is correct: Graph shows steady increase until recent slight decline in 2020-2022.

Other Options:

  • A is incorrect: Clear upward trend visible from 1993 to 2020.
  • B is incorrect: Gender gap appears relatively stable throughout period.
  • D is incorrect: Females consistently higher than males throughout graph.

Filed Under: Current Health Status Tagged With: Band 3, smc-5474-20-Life Expectancy and Trends, smc-5474-50-Data Interpretation

HMS, HAG 2018 HSC 15 MC

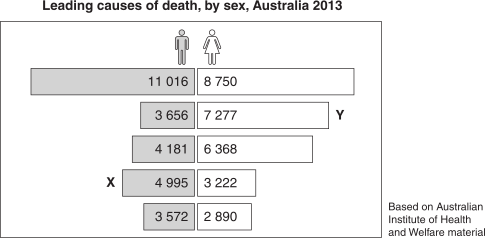
The table shows the data related to leading causes of death, by sex, in Australia in 2013.
 

What are the causes labelled by X and Y?
 

  X Y
A.   Coronary heart disease Cerebrovascular disease
B. Cerebrovascular disease Coronary heart disease
C. Dementia/Alzheimer’s disease Lung cancer
D. Lung cancer Dementia/Alzheimer’s disease
Show Answers Only

\(D\)

Show Worked Solution

  • D is correct: X represents lung cancer (higher in males), Y represents dementia (higher in females).

Other Options:

  • A is incorrect: Coronary heart disease typically has higher male rates, not matching Y pattern.
  • B is incorrect: Pattern doesn’t match cerebrovascular disease gender distribution for these positions.
  • C is incorrect: Reverses the correct gender patterns for these conditions.

♦♦ Mean mark 29%.

Filed Under: Current Health Status Tagged With: Band 6, smc-5474-10-Morbidity and Mortality, smc-5474-30-Gender Inequities, smc-5474-50-Data Interpretation

HMS, HAG 2020 HSC 19 MC

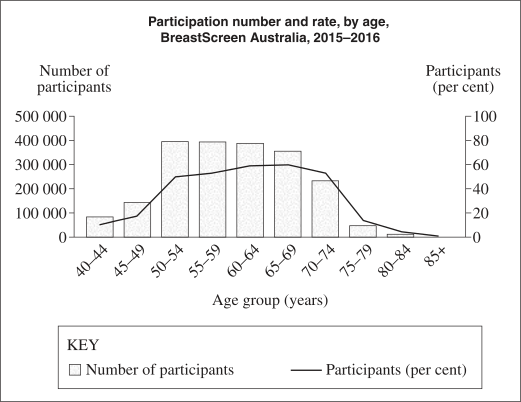
The graph shows the number of women who participated in BreastScreen Australia services, by age, in 2015-2016. The graph also shows the participation rate which is based on the number of women screened as a percentage of the eligible female population.


Which of the following conclusions is best supported by the data provided?

  1. The breast cancer mortality rate decreases with age.
  2. The incidence of breast cancer will increase for women aged over 75 years.
  3. The participation rate of women aged under 50 years may result in increased risk of breast cancer mortality for this age group.
  4. The participation rate of women aged 50-69 years may result in lower rates of hospitalisation for breast cancer for this age group.
Show Answers Only

\(C\)

Show Worked Solution
  • C is correct: Low participation rates under 50 increase mortality risk through missed detection.

Other Options:

  • A is incorrect: Graph shows participation rates not mortality rate trends.
  • B is incorrect: Graph shows participation not incidence rate predictions.
  • D is incorrect: Graph shows participation not hospitalisation rate outcomes.

♦♦♦♦ Mean mark 38%.

Filed Under: Current Health Status Tagged With: Band 5, smc-5474-10-Morbidity and Mortality, smc-5474-50-Data Interpretation

HMS, HAG 2023 HSC 6 MC

The following table represents the number of deaths per 100 000 population in males aged 55-64 years in 1980 and again in 2020 for a range of conditions.
 

Conditions Male deaths per 100 000 population
aged 55–64
1980 2020
J 14 7
K 100 20
L 173 53
M 600 79

 
Which condition is represented by the letter \(J\) in the table? 

  1. Skin cancer
  2. Lung cancer
  3. Coronary heart disease
  4. Cerebrovascular disease
Show Answers Only

\(A\)

Show Worked Solution
  • A is correct: Data shows condition J had smallest number of deaths per 100,000 in both 1980 and 2020, consistent with skin cancer mortality patterns.

Other Options:

  • B is incorrect: Would show higher mortality rates than displayed for condition J.
  • C is incorrect: Has significantly higher mortality rates than shown.
  • D is incorrect: Higher mortality rate than condition J.

♦♦ Mean mark 41%.

Filed Under: Chronic Conditions, Diseases and Injury, Current Health Status Tagged With: Band 5, smc-5474-10-Morbidity and Mortality, smc-5474-50-Data Interpretation, smc-5477-10-Cancer, smc-5477-30-Groups and Changing Patterns, smc-5477-50-Stimulus

Copyright © 2014–2026 SmarterEd.com.au · Log in