SmarterEd

Aussie Maths & Science Teachers: Save your time with SmarterEd

  • Login
  • Get Help
  • About

HMS, HAG NSE-Bank 13 MC

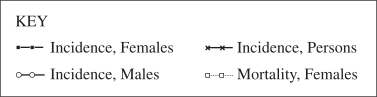
The graph shows incidence and mortality rates (per 100 000 of the selected group) for a chronic disease.
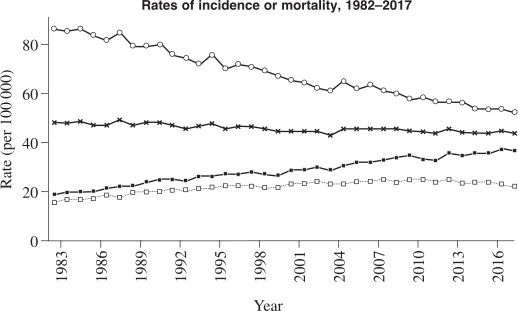
 

To which chronic disease does the graph relate?

  1. Diabetes
  2. Lung cancer
  3. Breast cancer
  4. Cardiovascular disease
Show Answers Only

B

Show Worked Solution
  • B is correct: Lung cancer has relatively similar incidence and mortality rates due to its comparatively low survival rate.

Other options:

  • A is incorrect: Diabetes has a much lower mortality rate compared with its prevalence in the population.
  • C is incorrect: Breast cancer has a much higher incidence rate than mortality rate due to relatively high survival rates.
  • D is incorrect: Cardiovascular disease generally has a much higher incidence than mortality rate.

Filed Under: Chronic Conditions, Diseases and Injury Tagged With: Band 5, smc-5477-10-Cancer, smc-5477-30-Groups and Changing Patterns, smc-5477-50-Stimulus

HMS, HAG EQ-Bank 140

Research shows that five-year survival rates for major cancers have improved significantly, with prostate cancer increasing from 89% to 96% and breast cancer from 79% to 92%. However, certain population groups continue to experience poorer cancer outcomes.

Analyse how improvements in cancer detection and treatment interact with health inequities to create different cancer outcomes across Australian populations.   (12 marks)

--- 30 WORK AREA LINES (style=lined) ---

Show Answers Only

Overview Statement

  • Cancer detection and treatment improvements show complex relationships with health inequities across Australian populations.
  • They reveal important connections between healthcare access, early intervention and survival outcomes.

Component Relationship 1

  • Advanced cancer detection methods create substantial survival improvements for populations with good healthcare access, demonstrated through dramatically improved five-year survival rates across major cancer types.
  • Routine screening programs, enhanced imaging techniques and early intervention strategies enable cancers to be detected at treatable stages when outcomes are most favourable.
  • This relationship shows that technological advances and systematic screening approaches directly contribute to better survival rates by identifying cancers before they progress to advanced stages.
  • The significance of this pattern reveals that early detection remains the most critical factor in determining positive cancer outcomes across different cancer types and patient populations.

Component Relationship 2

  • However, health inequities create barriers that prevent certain population groups from accessing these improved detection and treatment services equally.
  • Aboriginal and Torres Strait Islander peoples, socioeconomically disadvantaged communities and those in remote areas experience lower participation in cancer screening programs and face difficulties accessing specialist cancer treatment services.
  • This connection illustrates how healthcare improvements can actually widen health gaps when access remains unequal across different population groups.
  • The implications show that while overall cancer outcomes improve, persistent inequities mean that vulnerable populations continue to experience higher mortality rates and lower survival rates compared to advantaged groups with better healthcare access.

Component Relationship 3

  • Geographic location compounds these inequities by limiting access to both screening services and specialised cancer treatment facilities.
  • People in remote areas have the lowest cancer survival rates despite needing the same detection and treatment services as urban populations.
  • This relationship demonstrates how distance from healthcare centres creates multiple disadvantages including delayed diagnosis, limited treatment options and reduced access to follow-up care.
  • The significance reveals that healthcare improvements must be systematically delivered across all geographic areas to ensure equitable cancer outcomes for Australian populations regardless of location.

Implications and Synthesis

  • These interconnected improvement and inequity patterns demonstrate that cancer outcome improvements require both advanced medical technology and equitable access strategies.
  • Effective cancer policy must address systematic barriers to ensure all Australians benefit from detection and treatment advances.
Show Worked Solution

Overview Statement

  • Cancer detection and treatment improvements show complex relationships with health inequities across Australian populations.
  • They reveal important connections between healthcare access, early intervention and survival outcomes.

Component Relationship 1

  • Advanced cancer detection methods create substantial survival improvements for populations with good healthcare access, demonstrated through dramatically improved five-year survival rates across major cancer types.
  • Routine screening programs, enhanced imaging techniques and early intervention strategies enable cancers to be detected at treatable stages when outcomes are most favourable.
  • This relationship shows that technological advances and systematic screening approaches directly contribute to better survival rates by identifying cancers before they progress to advanced stages.
  • The significance of this pattern reveals that early detection remains the most critical factor in determining positive cancer outcomes across different cancer types and patient populations.

Component Relationship 2

  • However, health inequities create barriers that prevent certain population groups from accessing these improved detection and treatment services equally.
  • Aboriginal and Torres Strait Islander peoples, socioeconomically disadvantaged communities and those in remote areas experience lower participation in cancer screening programs and face difficulties accessing specialist cancer treatment services.
  • This connection illustrates how healthcare improvements can actually widen health gaps when access remains unequal across different population groups.
  • The implications show that while overall cancer outcomes improve, persistent inequities mean that vulnerable populations continue to experience higher mortality rates and lower survival rates compared to advantaged groups with better healthcare access.

Component Relationship 3

  • Geographic location compounds these inequities by limiting access to both screening services and specialised cancer treatment facilities.
  • People in remote areas have the lowest cancer survival rates despite needing the same detection and treatment services as urban populations.
  • This relationship demonstrates how distance from healthcare centres creates multiple disadvantages including delayed diagnosis, limited treatment options and reduced access to follow-up care.
  • The significance reveals that healthcare improvements must be systematically delivered across all geographic areas to ensure equitable cancer outcomes for Australian populations regardless of location.

Implications and Synthesis

  • These interconnected improvement and inequity patterns demonstrate that cancer outcome improvements require both advanced medical technology and equitable access strategies.
  • Effective cancer policy must address systematic barriers to ensure all Australians benefit from detection and treatment advances.

Filed Under: Chronic Conditions, Diseases and Injury Tagged With: Band 4, Band 5, Band 6, smc-5477-10-Cancer, smc-5477-30-Groups and Changing Patterns

HMS, HAG EQ-Bank 139

Explain the apparent paradox between increasing cancer incidence rates and decreasing cancer mortality rates in Australia.   (5 marks)

--- 15 WORK AREA LINES (style=lined) ---

Show Answers Only
  • Cancer incidence rates are increasing because Australia has an ageing population, and cancer risk rises significantly with age, resulting in more people reaching ages where cancer commonly develops.
  • This occurs alongside improved detection methods such as routine screening programs, enhanced imaging techniques and better diagnostic technology that identify cancers earlier and more frequently than in previous decades.
  • However, this creates decreasing mortality rates because advances in cancer treatment, surgical techniques and early intervention strategies have dramatically improved survival rates for many cancer types.
  • The relationship demonstrates that while more cancers are being detected, patients are living longer after diagnosis due to better medical care and treatment options compared to previous generations.
  • Therefore, the paradox reflects successful healthcare improvements where enhanced detection capabilities combine with better treatment outcomes to reduce deaths despite increasing the number of diagnosed cases across Australian populations.
Show Worked Solution
  • Cancer incidence rates are increasing because Australia has an ageing population, and cancer risk rises significantly with age, resulting in more people reaching ages where cancer commonly develops.
  • This occurs alongside improved detection methods such as routine screening programs, enhanced imaging techniques and better diagnostic technology that identify cancers earlier and more frequently than in previous decades.
  • However, this creates decreasing mortality rates because advances in cancer treatment, surgical techniques and early intervention strategies have dramatically improved survival rates for many cancer types.
  • The relationship demonstrates that while more cancers are being detected, patients are living longer after diagnosis due to better medical care and treatment options compared to previous generations.
  • Therefore, the paradox reflects successful healthcare improvements where enhanced detection capabilities combine with better treatment outcomes to reduce deaths despite increasing the number of diagnosed cases across Australian populations.

Filed Under: Chronic Conditions, Diseases and Injury Tagged With: Band 4, smc-5477-10-Cancer, smc-5477-30-Groups and Changing Patterns

HMS, HAG EQ-Bank 138

Analyse the relationship between injury patterns and suicide trends in Australia, and their implications for population health outcomes across different age groups.   (8 marks)

--- 24 WORK AREA LINES (style=lined) ---

Show Answers Only

Overview Statement

  • Injury patterns and suicide trends show clear relationships with age-specific mortality causes in Australia.
  • They reveal important connections between life stage challenges and population health outcomes.

Component Relationship 1

  • Injuries serve as the leading cause of death for people aged 1-44, demonstrating how external causes dominate mortality in younger populations rather than chronic diseases.
  • This relationship shows that preventable deaths from accidents, violence and self-harm represent major lost years of life among working-age Australians.
  • The significance of this pattern reveals that injury prevention strategies could have substantial impact on overall population health outcomes by reducing premature mortality.
  • This connection illustrates how younger populations face different health risks compared to older age groups where chronic diseases become more prominent causes of death.

Component Relationship 2

  • Suicide patterns demonstrate complex relationships with gender, age and life stage challenges across Australian populations.
  • Males experience much higher suicide rates than females, particularly middle-aged and older men who face the highest rates.
  • This relationship reveals that suicide affects different population groups in distinct ways, with intentional self-harm hospitalisations being highest among young females while fatal outcomes predominate among older males.
  • The implications of this pattern show that targeted prevention approaches must address different risk factors and intervention points for various demographic groups to effectively reduce both fatal and non-fatal self-harm across the population.

Implications and Synthesis

  • These interconnected injury and suicide patterns demonstrate that effective population health strategies require age-specific and gender-specific approaches.
  • Prevention programs must target different risk factors and intervention methods for various life stages and demographic groups.
Show Worked Solution

Overview Statement

  • Injury patterns and suicide trends show clear relationships with age-specific mortality causes in Australia.
  • They reveal important connections between life stage challenges and population health outcomes.

Component Relationship 1

  • Injuries serve as the leading cause of death for people aged 1-44, demonstrating how external causes dominate mortality in younger populations rather than chronic diseases.
  • This relationship shows that preventable deaths from accidents, violence and self-harm represent major lost years of life among working-age Australians.
  • The significance of this pattern reveals that injury prevention strategies could have substantial impact on overall population health outcomes by reducing premature mortality.
  • This connection illustrates how younger populations face different health risks compared to older age groups where chronic diseases become more prominent causes of death.

Component Relationship 2

  • Suicide patterns demonstrate complex relationships with gender, age and life stage challenges across Australian populations.
  • Males experience much higher suicide rates than females, particularly middle-aged and older men who face the highest rates.
  • This relationship reveals that suicide affects different population groups in distinct ways, with intentional self-harm hospitalisations being highest among young females while fatal outcomes predominate among older males.
  • The implications of this pattern show that targeted prevention approaches must address different risk factors and intervention points for various demographic groups to effectively reduce both fatal and non-fatal self-harm across the population.

Implications and Synthesis

  • These interconnected injury and suicide patterns demonstrate that effective population health strategies require age-specific and gender-specific approaches.
  • Prevention programs must target different risk factors and intervention methods for various life stages and demographic groups.

Filed Under: Chronic Conditions, Diseases and Injury Tagged With: Band 6, smc-5477-15-Other Conditions and Injury, smc-5477-30-Groups and Changing Patterns

HMS, HAG EQ-Bank 137

Discuss how diabetes trends in Australia demonstrate both the successes and challenges of chronic disease management in modern healthcare.   (6 marks)

--- 20 WORK AREA LINES (style=lined) ---

Show Answers Only

Successes in diabetes management

  • [P] Australia has achieved significant success in reducing new cases of type 2 diabetes through improved prevention measures.
  • [E] The age-standardised incidence rate for type 2 diabetes has declined substantially over recent decades, demonstrating effective preventive healthcare strategies.
  • [Ev] This decline reflects successful public health campaigns promoting healthy lifestyle choices, early screening programs and increased awareness of diabetes risk factors among healthcare providers and the community.
  • [L] Therefore, prevention-focused approaches have proven effective in reducing the development of new diabetes cases across Australian populations.

Challenges in diabetes management

  • [P] However, the total number of people living with diabetes continues to increase, creating ongoing healthcare system pressures.
  • [E] This occurs because improved medical treatments allow people with diabetes to live longer, increasing the prevalence despite lower incidence rates.
  • [Ev] The healthcare system must now manage growing numbers of people requiring long-term diabetes care, medication management and complication prevention services throughout their extended lifespans.
  • [L] Consequently, while prevention strategies succeed in reducing new cases, the chronic nature of diabetes creates sustained demand for healthcare resources and specialised diabetes management services.
Show Worked Solution

Successes in diabetes management

  • [P] Australia has achieved significant success in reducing new cases of type 2 diabetes through improved prevention measures.
  • [E] The age-standardised incidence rate for type 2 diabetes has declined substantially over recent decades, demonstrating effective preventive healthcare strategies.
  • [Ev] This decline reflects successful public health campaigns promoting healthy lifestyle choices, early screening programs and increased awareness of diabetes risk factors among healthcare providers and the community.
  • [L] Therefore, prevention-focused approaches have proven effective in reducing the development of new diabetes cases across Australian populations.

Challenges in diabetes management

  • [P] However, the total number of people living with diabetes continues to increase, creating ongoing healthcare system pressures.
  • [E] This occurs because improved medical treatments allow people with diabetes to live longer, increasing the prevalence despite lower incidence rates.
  • [Ev] The healthcare system must now manage growing numbers of people requiring long-term diabetes care, medication management and complication prevention services throughout their extended lifespans.
  • [L] Consequently, while prevention strategies succeed in reducing new cases, the chronic nature of diabetes creates sustained demand for healthcare resources and specialised diabetes management services.

Filed Under: Chronic Conditions, Diseases and Injury Tagged With: Band 5, smc-5477-15-Other Conditions and Injury, smc-5477-30-Groups and Changing Patterns

HMS, HAG EQ-Bank 135

Describe the key trends in mental health conditions affecting Australian populations, particularly focusing on age and gender differences.   (4 marks)

--- 12 WORK AREA LINES (style=lined) ---

Show Answers Only
  • Mental health conditions and substance use disorders represent the second leading disease group causing burden in Australia, showing significant increases in recent years.
  • Young people aged 16-24 experience the highest rates of mental illness, with substantial increases in prevalence compared to previous decades, particularly among females.
  • Gender differences are significant, with young females showing much higher rates of mental illness compared to males of the same age group, representing a growing health concern.
  • Anxiety disorders are the most common mental health condition affecting millions of Australians, making it a major contributor to overall disease burden across the population.
  • The burden from mental health conditions is predominantly non-fatal, meaning people live with these conditions rather than dying from them, requiring long-term management and support services throughout their lives.
Show Worked Solution
  • Mental health conditions and substance use disorders represent the second leading disease group causing burden in Australia, showing significant increases in recent years.
  • Young people aged 16-24 experience the highest rates of mental illness, with substantial increases in prevalence compared to previous decades, particularly among females.
  • Gender differences are significant, with young females showing much higher rates of mental illness compared to males of the same age group, representing a growing health concern.
  • Anxiety disorders are the most common mental health condition affecting millions of Australians, making it a major contributor to overall disease burden across the population.
  • The burden from mental health conditions is predominantly non-fatal, meaning people live with these conditions rather than dying from them, requiring long-term management and support services throughout their lives.

Filed Under: Chronic Conditions, Diseases and Injury Tagged With: Band 3, smc-5477-15-Other Conditions and Injury, smc-5477-30-Groups and Changing Patterns

HMS, HAG EQ-Bank 97 MC

The decline in cardiovascular disease mortality rates in Australia is attributed to improvements in both prevention and treatment, including:

  1. Reduction in risk factor levels and improved medical care with better medications
  2. Increased smoking rates and improved surgical techniques only
  3. Focus on treatment rather than prevention strategies
  4. Elimination of all modifiable risk factors from the population
Show Answers Only

\(A\)

Show Worked Solution
  • A is correct: Decline due to reduced risk factors like smoking plus improved medications and surgical interventions.

Other Options:

  • B is incorrect: Smoking rates decreased not increased and improvements include medications not just surgery.
  • C is incorrect: Both prevention and treatment contributed not just treatment focus.
  • D is incorrect: Risk factors reduced but not completely eliminated from the population.

Filed Under: Chronic Conditions, Diseases and Injury Tagged With: Band 4, smc-5477-05-Cardiovascular disease, smc-5477-20-Risk and Protective Factors, smc-5477-30-Groups and Changing Patterns

HMS, HAG EQ-Bank 95 MC

Based on Australia's Health data trends, which pattern is observed for chronic conditions in Australia?

  1. All chronic conditions show decreasing incidence and mortality rates
  2. Mental health conditions and substance use disorders cause greatest burden in ages 5-44
  3. Musculoskeletal conditions are the leading cause of death in older Australians
  4. Chronic conditions contribute to less than 50% of total disease burden
Show Answers Only

\(B\)

Show Worked Solution
  • B is correct: Mental health conditions and substance use disorders cause greatest burden in first half of life ages 5-44.

Other Options:

  • A is incorrect: Different chronic conditions show varying trends some increasing others decreasing.
  • C is incorrect: Neurological conditions like dementia are leading cause in older adults not musculoskeletal.
  • D is incorrect: Chronic conditions account for majority not minority of total disease burden.

Filed Under: Chronic Conditions, Diseases and Injury Tagged With: Band 4, smc-5477-15-Other Conditions and Injury, smc-5477-30-Groups and Changing Patterns

HMS, HAG EQ-Bank 93 MC

The phenomenon of increasing total cancer hospitalisations while experiencing declining age-standardised hospitalisation rates can be explained by:

  1. Australia's ageing population and improved early detection leading to more people at risk
  2. Reduced funding for cancer treatment services in public hospitals
  3. Decreased survival rates requiring more frequent hospital admissions
  4. Changes in diagnostic criteria making cancer easier to identify
Show Answers Only

\(A\)

Show Worked Solution
  • A is correct: Ageing population means more at risk and improved screening leads to early detection requiring hospitalisation.

Other Options:

  • B is incorrect: Funding changes don’t explain the specific pattern of total increases with rate decreases.
  • C is incorrect: Survival rates have improved not decreased as shown in treatment advances.
  • D is incorrect: Diagnostic criteria changes don’t fully explain the age-standardised rate decline pattern.

Filed Under: Chronic Conditions, Diseases and Injury Tagged With: Band 3, smc-5477-10-Cancer, smc-5477-30-Groups and Changing Patterns

HMS, HAG 2013 HSC 8 MC

Which of the following best explains why breast cancer death rates are decreasing while incidence rates are increasing in Australia?

  1. Enhanced early detection and treatment
  2. Increased use and acceptance of alternative medicines
  3. Improved access to and delivery of immunisation programs
  4. Advances in understanding the role of family history in surviving breast cancer after diagnosis
Show Answers Only

\(A\)

Show Worked Solution
  • A is correct: Early detection and treatment improve survival despite higher incidence.

Other Options:

  • B is incorrect: Alternative medicines not primary factor in survival improvement.
  • C is incorrect: No immunisation exists for breast cancer prevention.
  • D is incorrect: Family history understanding doesn’t explain incidence/mortality trends.

Filed Under: Chronic Conditions, Diseases and Injury Tagged With: Band 2, smc-5477-10-Cancer, smc-5477-30-Groups and Changing Patterns

HMS, HAG 2014 HSC 21

Outline TWO groups most at risk of cardiovascular disease in Australia.   (3 marks)

--- 7 WORK AREA LINES (style=lined) ---

Show Answers Only
  • Aboriginal and Torres Strait Islander people experience significantly higher rates of cardiovascular disease compared to non-Indigenous Australians. This increased risk results from higher smoking rates and increased diabetes prevalence. Limited access to healthcare services particularly affects those in remote communities.
  • People from low socioeconomic backgrounds face substantially increased CVD risk due to various interconnected factors. These include limited access to preventive healthcare and regular medical check-ups. Higher stress levels from financial pressures and poor dietary choices also contribute significantly.

Alternative groups at risk: Older people (natural ageing process increases risk), smokers (major modifiable risk factor), people with obesity (contributes to multiple CVD risk factors).

Show Worked Solution
  • Aboriginal and Torres Strait Islander people experience significantly higher rates of cardiovascular disease compared to non-Indigenous Australians. This increased risk results from higher smoking rates and increased diabetes prevalence. Limited access to healthcare services particularly affects those in remote communities.
  • People from low socioeconomic backgrounds face substantially increased CVD risk due to various interconnected factors. These include limited access to preventive healthcare and regular medical check-ups. Higher stress levels from financial pressures and poor dietary choices also contribute significantly.

Alternative groups at risk: Older people (natural ageing process increases risk), smokers (major modifiable risk factor), people with obesity (contributes to multiple CVD risk factors).

Filed Under: Chronic Conditions, Diseases and Injury Tagged With: Band 3, smc-5477-05-Cardiovascular disease, smc-5477-30-Groups and Changing Patterns

HMS, HAG 2014 HSC 5 MC

Which of the following has contributed most to the declining prevalence of cardiovascular disease (CVD) in Australia?

  1. Improved community awareness and treatment of CVD
  2. Improved nutritional quality of food consumed by Australians
  3. Increased levels of organised sport participation and exercise by those at risk of CVD
  4. Increased numbers of alternative health professionals and volunteers working with those at risk of CVD
Show Answers Only

\(A\)

Show Worked Solution
  • A is correct: Community awareness and improved treatment have been primary factors.

Other Options:

  • B is incorrect: Nutrition improvements alone haven’t been the main contributor.
  • C is incorrect: Sport participation increases haven’t been the primary factor.
  • D is incorrect: Alternative health professionals aren’t the main reason for decline.

Filed Under: Chronic Conditions, Diseases and Injury Tagged With: Band 4, smc-5477-05-Cardiovascular disease, smc-5477-30-Groups and Changing Patterns

HMS, HAG 2018 HSC 17 MC

Based on statistics, Australia has a very high incidence of cancer when compared to most developed countries.

To what is this mainly due?

  1. Poor dietary habits
  2. Higher rates of smoking
  3. Successful screening programs
  4. Increased spending on sun protection
Show Answers Only

\(C\)

Show Worked Solution

  • C is correct: Successful screening programs detect more cancers, increasing incidence rates through early detection.

Other Options:

  • A is incorrect: Poor dietary habits would be a risk factor, not explanation for high detection rates.
  • B is incorrect: Higher smoking rates would increase lung cancer but don’t explain overall high incidence.
  • D is incorrect: Sun protection spending would reduce skin cancer incidence, not increase overall rates.

♦♦♦ Mean mark 33%.

Filed Under: Chronic Conditions, Diseases and Injury Tagged With: Band 5, smc-5477-10-Cancer, smc-5477-30-Groups and Changing Patterns

HMS, HAG 2021 HSC 19 MC

The graph shows the trends in the incidence of a type of cancer for males and females in Australia from 2004 to 2019.

Which row of the table identifies the type of cancer represented in the graph and the most effective strategy for the federal government to implement in order to reduce its overall expenditure on this type of cancer by 2040?

Show Answers Only

\(C\)

Show Worked Solution
  • C is correct: Graph pattern matches skin cancer trends; prevention most cost-effective.

Other Options:

  • A is incorrect: Screening less effective than prevention for skin cancer.
  • B is incorrect: Pattern doesn’t match lung cancer epidemiology trends.
  • D is incorrect: Letters less effective than comprehensive prevention programs.

♦ Mean mark 55%.

Filed Under: Chronic Conditions, Diseases and Injury Tagged With: Band 5, smc-5477-10-Cancer, smc-5477-30-Groups and Changing Patterns, smc-5477-50-Stimulus

HMS, HAG 2022 HSC 24

Select ONE of the following conditions to answer BOTH parts (a) and (b) of this question.

  • Diabetes
  • Respiratory disease
  • Injury
  • Mental health problems and illnesses
  1. Outline the extent of this condition in Australia.   (3 marks)

    --- 6 WORK AREA LINES (style=lined) ---

  2. Explain how sociocultural determinants affect ONE group at risk of this condition.   (4 marks)

    --- 12 WORK AREA LINES (style=lined) ---

Show Answers Only

a.    Condition selected – Mental health problems and illnesses

  • Mental health conditions affect approximately one in five Australians, making them highly prevalent. Young people aged 16-24 experience the highest rates, with significantly higher prevalence than older age groups. Anxiety disorders are the most common type.
  • The prevalence has increased significantly among young people, particularly females, over the past decade. Mental health conditions represent one of the leading causes of disease burden in Australia, demonstrating a major public health challenge.

b.    Group at risk: Young people aged 16-24

  • Sociocultural determinants significantly influence mental health outcomes for young people. Social media and peer pressure create unrealistic expectations and comparison culture, leading to anxiety and depression. This occurs because young people are particularly vulnerable to social validation.
  • Family dynamics and socioeconomic status affect access to support systems and professional help. Low-income families often cannot afford private mental health services, resulting in delayed treatment. Social isolation and stigma prevent young people from seeking help.
  • Educational pressures and career uncertainty contribute to stress and anxiety. These factors interact to compound mental health risks, particularly for disadvantaged young people who face multiple sociocultural barriers.
Show Worked Solution

a.    Condition selected – Mental health problems and illnesses

  • Mental health conditions affect approximately one in five Australians, making them highly prevalent. Young people aged 16-24 experience the highest rates, with significantly higher prevalence than older age groups. Anxiety disorders are the most common type.
  • The prevalence has increased significantly among young people, particularly females, over the past decade. Mental health conditions represent one of the leading causes of disease burden in Australia, demonstrating a major public health challenge.

b.    Group at risk: Young people aged 16-24

  • Sociocultural determinants significantly influence mental health outcomes for young people. Social media and peer pressure create unrealistic expectations and comparison culture, leading to anxiety and depression. This occurs because young people are particularly vulnerable to social validation.
  • Family dynamics and socioeconomic status affect access to support systems and professional help. Low-income families often cannot afford private mental health services, resulting in delayed treatment. Social isolation and stigma prevent young people from seeking help.
  • Educational pressures and career uncertainty contribute to stress and anxiety. These factors interact to compound mental health risks, particularly for disadvantaged young people who face multiple sociocultural barriers.

♦ Mean mark (b) 55%.

Filed Under: Chronic Conditions, Diseases and Injury Tagged With: Band 4, Band 5, smc-5477-15-Other Conditions and Injury, smc-5477-30-Groups and Changing Patterns

HMS, HAG 2023 HSC 6 MC

The following table represents the number of deaths per 100 000 population in males aged 55-64 years in 1980 and again in 2020 for a range of conditions.
 

Conditions Male deaths per 100 000 population
aged 55–64
1980 2020
J 14 7
K 100 20
L 173 53
M 600 79

 
Which condition is represented by the letter \(J\) in the table? 

  1. Skin cancer
  2. Lung cancer
  3. Coronary heart disease
  4. Cerebrovascular disease
Show Answers Only

\(A\)

Show Worked Solution
  • A is correct: Data shows condition J had smallest number of deaths per 100,000 in both 1980 and 2020, consistent with skin cancer mortality patterns.

Other Options:

  • B is incorrect: Would show higher mortality rates than displayed for condition J.
  • C is incorrect: Has significantly higher mortality rates than shown.
  • D is incorrect: Higher mortality rate than condition J.

♦♦ Mean mark 41%.

Filed Under: Chronic Conditions, Diseases and Injury, Current Health Status Tagged With: Band 5, smc-5474-10-Morbidity and Mortality, smc-5474-50-Data Interpretation, smc-5477-10-Cancer, smc-5477-30-Groups and Changing Patterns, smc-5477-50-Stimulus

HMS, HAG 2024 HSC 14 MC

The graph shows the number of deaths of Australian females over time for TWO cancers, X and Y, that resulted in more deaths than for any other forms of cancer.

Which cancer is represented by cancer Y?

  1. Breast
  2. Cervical
  3. Lung
  4. Skin
Show Answers Only

\(C\)

Show Worked Solution
  • C is correct: Cancer Y represents lung cancer, a leading cause of cancer deaths in Australian females, with numbers declining since 2000.

Other Options:

  • A is incorrect: Breast cancer would likely show as the higher line (X).
  • B is incorrect: Cervical cancer has much lower mortality numbers.
  • D is incorrect: Skin cancer mortality is significantly lower than lung cancer.

♦♦♦ Mean mark 34%.

Filed Under: Chronic Conditions, Diseases and Injury Tagged With: Band 5, smc-5477-10-Cancer, smc-5477-30-Groups and Changing Patterns, smc-5477-50-Stimulus

HMS, HAG 2020 HSC 22

Complete the table for THREE current leading causes of mortality for males and females in Australia.   (4 marks)

--- 0 WORK AREA LINES (style=blank) ---

\begin{array}{|c|c|c|}
\hline
\rule{0pt}{2.5ex}\textit{Current leading} & \textit{Trend in mortality rate for} & \textit{Trend in mortality rate for}\\
\rule[-1ex]{0pt}{0pt}\quad \textit{cause of mortality} \quad & \textit{males over the last 10 years} & \textit{females over the last 10 years}\\
\hline
\quad & \quad &\quad\\
\hline
\quad & \quad &\quad\\
\hline
\quad & \quad &\quad\\
\hline
\end{array}

 
Show Answers Only

\(\text{Any THREE of the following}\)

\begin{array}{|l|c|c|}
\hline
\rule{0pt}{2.5ex}\quad \quad \textit{Current leading} & \textit{Trend in mortality} & \textit{Trend in mortality }\\
\quad \ \  \textit{cause of mortality} \quad & \textit{rates for males over} & \textit{rate for females }\\
\rule[-1ex]{0pt}{0pt}\quad \quad & \textit{the last 10 years} & \textit{over the last 10 years}\\
\hline
\rule{0pt}{2.5ex}\text{Coronary heart disease} \rule[-1ex]{0pt}{0pt}& \text{Decreased} & \text{Decreased} \\
\hline
\rule{0pt}{2.5ex}\text{Dementia and Alzheimer’s } & \text{Increased} & \text{Increased} \\
\rule[-1ex]{0pt}{0pt}\text{disease} & \text{} & \text{} \\
\hline
\rule{0pt}{2.5ex}\text{Cerebrovascular disease} \rule[-1ex]{0pt}{0pt}& \text{Decreased} & \text{Decreased} \\
\hline
\rule{0pt}{2.5ex}\text{Lung cancer} \rule[-1ex]{0pt}{0pt}& \text{Decreased} & \text{Decreased} \\
\hline
\rule{0pt}{2.5ex}\text{Chronic obstructive} & \text{Decreased} & \text{Decreased} \\
\rule[-1ex]{0pt}{0pt}\text{pulmonary disease} & \text{} & \text{} \\
\hline
\rule{0pt}{2.5ex}\text{Diabetes} \rule[-1ex]{0pt}{0pt}& \text{Increased} & \text{Increased} \\
\hline
\rule{0pt}{2.5ex}\text{Cardiovascular disease} \rule[-1ex]{0pt}{0pt}& \text{Decreased} & \text{Decreased} \\
\hline
\rule{0pt}{2.5ex}\text{Mental health (suicide)} \rule[-1ex]{0pt}{0pt}& \text{Increased} & \text{Increased} \\
\hline
\end{array}

Show Worked Solution

\(\text{Any THREE of the following}\)

\begin{array}{|l|c|c|}
\hline
\rule{0pt}{2.5ex}\quad \quad \textit{Current leading} & \textit{Trend in mortality} & \textit{Trend in mortality }\\
\quad \ \  \textit{cause of mortality} \quad & \textit{rates for males over} & \textit{rate for females }\\
\rule[-1ex]{0pt}{0pt}\quad \quad & \textit{the last 10 years} & \textit{over the last 10 years}\\
\hline
\rule{0pt}{2.5ex}\text{Coronary heart disease} \rule[-1ex]{0pt}{0pt}& \text{Decreased} & \text{Decreased} \\
\hline
\rule{0pt}{2.5ex}\text{Dementia and Alzheimer’s } & \text{Increased} & \text{Increased} \\
\rule[-1ex]{0pt}{0pt}\text{disease} & \text{} & \text{} \\
\hline
\rule{0pt}{2.5ex}\text{Cerebrovascular disease} \rule[-1ex]{0pt}{0pt}& \text{Decreased} & \text{Decreased} \\
\hline
\rule{0pt}{2.5ex}\text{Lung cancer} \rule[-1ex]{0pt}{0pt}& \text{Decreased} & \text{Decreased} \\
\hline
\rule{0pt}{2.5ex}\text{Chronic obstructive} & \text{Decreased} & \text{Decreased} \\
\rule[-1ex]{0pt}{0pt}\text{pulmonary disease} & \text{} & \text{} \\
\hline
\rule{0pt}{2.5ex}\text{Diabetes} \rule[-1ex]{0pt}{0pt}& \text{Increased} & \text{Increased} \\
\hline
\rule{0pt}{2.5ex}\text{Cardiovascular disease} \rule[-1ex]{0pt}{0pt}& \text{Decreased} & \text{Decreased} \\
\hline
\rule{0pt}{2.5ex}\text{Mental health (suicide)} \rule[-1ex]{0pt}{0pt}& \text{Increased} & \text{Increased} \\
\hline
\end{array}


♦♦ Mean mark 47%.

Filed Under: Chronic Conditions, Diseases and Injury, Current Health Status Tagged With: Band 5, smc-5474-10-Morbidity and Mortality, smc-5474-20-Life Expectancy and Trends, smc-5477-15-Other Conditions and Injury, smc-5477-30-Groups and Changing Patterns

Copyright © 2014–2026 SmarterEd.com.au · Log in