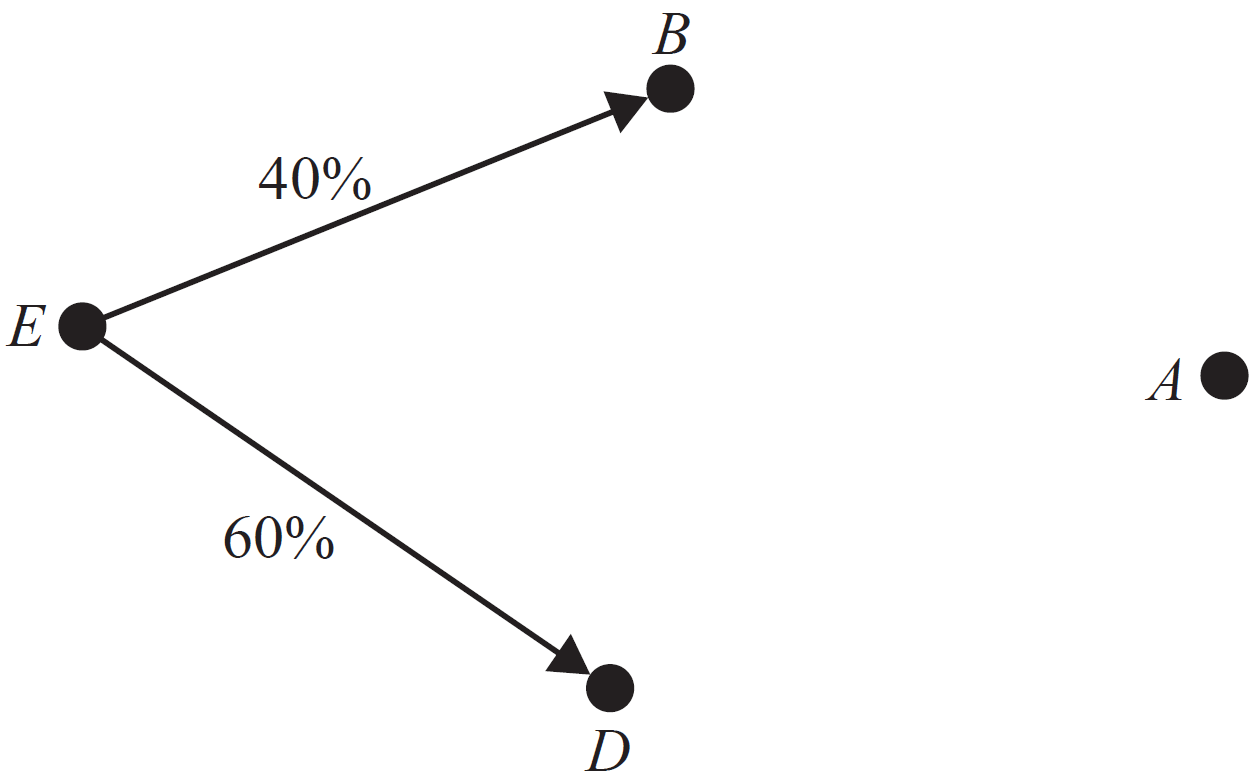
When the construction company established the construction site at the beginning of 2023, it employed 390 staff to work on the site. The staff comprised 330 construction workers \((C)\), 50 foremen \((F)\) and 10 managers \((M)\). At the beginning of each year, staff can choose to stay in the same job, move to a different job on the site, or leave the site \((L)\) and not return. The transition diagram below shows the proportion of staff who are expected to change their job at the site each year. This situation can be modelled by the recurrence relation \(S_{n+1}=T S_n\), where \(T\) is the transitional matrix, \(S_0=\left[\begin{array}{c}330 \\ 50 \\ 10 \\ 0\end{array}\right] \begin{aligned} & C \\ & F \\ & M \\ & L \end{aligned}\) and \(n\) is the number of years after 2023. --- 4 WORK AREA LINES (style=lined) --- --- 2 WORK AREA LINES (style=lined) --- To encourage more construction workers \((C)\) to stay, the construction company has given workers an incentive to move into the job of foreman \((F)\). Matrix \(R\) below shows the ways in which staff are expected to change their jobs from year to year with this new incentive in place. \begin{aligned} The site always requires at least 330 construction workers. To ensure that this happens, the company hires an additional 190 construction workers \((C)\) at the beginning of 2024 and each year thereafter. The matrix \(V_{n+1}\) will then be given by \(V_{n+1}=R V_n+Z\), where \(V_0=\left[\begin{array}{c}330 \\ 50 \\ 10 \\ 0\end{array}\right] \begin{aligned} & C \\ & F \\ & M \\ & L\end{aligned} \quad\quad\quad Z=\left[\begin{array}{c}190 \\ 0 \\ 0 \\ 0\end{array}\right] \begin{aligned} & C \\ & F \\ & M \\ & L\end{aligned} \ \ \) and \(n\) is the number of years after 2023. --- 4 WORK AREA LINES (style=lined) --- --- 4 WORK AREA LINES (style=lined) ---

& \quad \quad \ \ \textit{this year} \\
& \quad C \quad \ \ F \quad \ \ M \quad L\\
R = & \begin{bmatrix}
0.4 & 0.2 & 0 & 0 \\
0.4 & 0.2 & 0.4 & 0 \\
0 & 0.2 & 0.3 & 0 \\
0.2 & 0.4 & 0.3 & 1
\end{bmatrix}\begin{array}{l}
C\\
F\\
M\\
L
\end{array} \quad \textit{next year}
\end{aligned}
Matrices, GEN1 2024 VCAA 29 MC
A tennis team consists of five players: Quinn, Rosie, Siobhan, Trinh and Ursula.
When the team competes, players compete in the order of first, then second, then third, then fourth.
The fifth player has a bye (does not compete).
On week 1 of the competition, the players competed in the following order.
\begin{array}{|c|c|c|c|c|}
\hline
\rule{0pt}{2.5ex} \quad\textbf{First} \quad\rule[-1ex]{0pt}{0pt}& \quad \textbf{Second} \quad& \quad\textbf{Third} \quad& \quad\textbf{Fourth}\quad & \quad\textbf{Bye} \quad\\
\hline
\rule{0pt}{2.5ex} \text{Quinn} \rule[-1ex]{0pt}{0pt}& \text {Rosie} & \text {Siobhan} & \text { Trinh } & \text {Ursula} \\
\hline
\end{array}
This information can be represented by matrix \(G_1\), shown below.
\(G_1=\begin{bmatrix} Q & R & S & T & U \end{bmatrix}\)
Let \(G_n\) be the order of play in week \(n\).
The playing order changes each week and can be determined by the rule \(G_{n+1}=G_n \times P\)
\(\text{where}\quad \\P=\begin{bmatrix}
0 & 1 & 0 & 0 & 0 \\
0 & 0 & 0 & 0 & 1 \\
1 & 0 & 0 & 0 & 0 \\
0 & 0 & 1 & 0 & 0 \\
0 & 0 & 0 & 1 & 0 \end{bmatrix}\)
Which player has a bye in week 4 ?
- Quinn
- Rosie
- Siobhan
- Trinh
MATRICES, FUR2 2020 VCAA 3
An offer to buy the Westmall shopping centre was made by a competitor.
One market research project suggested that if the Westmall shopping centre were sold, each of the three centres (Westmall, Grandmall and Eastmall) would continue to have regular shoppers but would attract and lose shoppers on a weekly basis.
Let `S_n` be the state matrix that shows the expected number of shoppers at each of the three centres `n` weeks after Westmall is sold.
A matrix recurrence relation that generates values of `S_n` is
`S_(n+1) = T xx S_n`
`{:(quad qquad qquad qquad qquad qquad qquad qquad text(this week)),(qquad qquad qquad qquad qquad qquad quad \ W qquad quad G qquad quad \ E),(text(where)\ T = [(quad 0.80, 0.09, 0.10),(quad 0.12, 0.79, 0.10),(quad 0.08, 0.12, 0.80)]{:(W),(G),(E):}\ text(next week,) qquad qquad S_0 = [(250\ 000), (230\ 000), (200\ 000)]{:(W),(G),(E):}):}`
- Calculate the state matrix, `S_1`, to show the expected number of shoppers at each of the three centres one week after Westmall is sold. (1 mark)
--- 3 WORK AREA LINES (style=lined) ---
Using values from the recurrence relation above, the graph below shows the expected number of shoppers at Westmall, Grandmall and Eastmall for each of the 10 weeks after Westmall is sold.

- What is the difference in the expected weekly number of shoppers at Westmall from the time Westmall is sold to 10 weeks after Westmall is sold?
- Give your answer correct to the nearest thousand. (1 mark)
--- 2 WORK AREA LINES (style=lined) ---
- Grandmall is expected to achieve its maximum number of shoppers sometime between the fourth and the tenth week after Westmall is sold.
- Write down the week number in which this is expected to occur. (1 mark)
--- 4 WORK AREA LINES (style=lined) ---
- In the long term, what is the expected weekly number of shoppers at Westmall?
- Round your answer to the nearest whole number. (1 mark)
--- 3 WORK AREA LINES (style=lined) ---
MATRICES, FUR1 2020 VCAA 10 MC
Consider the matrix recurrence relation below.
`S_0 = [(30),(20),(40)], quad S_(n+1) = TS_n qquad text(where)\ T = [(j, 0.3, l),(0.2, m, 0.3),(0.4, 0.2, n)]`
Matrix `T` is a regular transition matrix.
Given the information above and that `S_1 = [(42),(28),(20)]`, which one of the following is true?
- `m >l`
- `j + l = 0.7`
- `j = n`
- `j > m`
- `l = m + n`
MATRICES, FUR1 2020 VCAA 7 MC
A small shopping centre has two coffee shops: Fatima’s (F) and Giorgio’s (G).
The percentage of coffee-buyers at each shop changes from day to day, as shown in the transition matrix `T`.
`{:(quadqquadqquadqquadquad t\oday),(qquadqquadqquadquad F quadqquad G),(T = [(0.85,0.35),(0.15,0.65)]{:(F),(G):}qquad t\omo\rrow):}`
On a particular Monday, 40% of coffee-buyers bought their coffees at Fatima’s.
The matrix recursion relation `S_(n+1) = TS_n` is used to model this situation.
The percentage of coffee-buyers who are expected to buy their coffee at Giorgio’s on Friday of the same week is closest to
- 31%
- 32%
- 34%
- 45%
- 68%
MATRICES, FUR2-NHT 2019 VCAA 2
Three television channels, `C_1, C_2` and `C_3`, will broadcast the International Games in Gillen.
Gillen’s 2000 residents are expected to change television channels from hour to hour as shown in the transition matrix `T` below.
The option for residents not to watch television (NoTV) at that time is also indicated in the transition matrix.
`{:(qquadqquadqquadqquadqquadquadtext(this hour)),(qquadqquadqquad \ C_1 quadquad \ C_2 quadqquad C_3 quad \ NoTV),(T = [(0.50,0.05,0.10,0.20),(0.10,0.60,0.20,0.20),(0.25,0.10,0.50,0.10),(0.15,0.25,0.20,0.50)]{:(C_1),(C_2),(C_3),(NoTV):}text(next hour)):}`
The state matrix `G_0` below lists the number of Gillen residents who are expected to watch the games on each of the channels at the start of a particular day (9.00 am).
Also shown is the number of Gillen residents who are not expected to watch television at that time.
`G_0 = [(100), (400), (100), (1400)]{:(C_1), (C_2), (C_3), (NoTV):}`
- Complete the calculation below to show that 835 Gillen residents are not expected to watch television (NoTV) at 10.00 am that day. (1 mark)
--- 0 WORK AREA LINES (style=lined) ---
|
|
`xx 100 +` |
|
`xx 400 +` |
|
`xx 100 ` |
| `+\ \ ` |
|
`xx 1400 ` | `= 835` |
- Determine the number of residents expected to watch the games on `C_3` at 11.00 am that day. (1 mark)
--- 3 WORK AREA LINES (style=lined) ---
MATRICES, FUR1-NHT 2019 VCAA 5 MC
A population of birds feeds at two different locations, `A` and `B`, on an island.
The change in the percentage of the birds at each location from year to year can be determined from the transition matrix `T` shown below.
`{:(),(),(T=):}{:(qquadtext(this year)),((qquadA,\ B)),([(0.8,0.4),(0.2,0.6)]):}{:(),(),({:(A),(B):}):}{:(),(),(text(next year)):}`
In 2018, 55% of the birds fed at location `B`.
In 2019, the percentage of the birds that are expected to feed at location `A` is
- 32%
- 42%
- 48%
- 58%
- 62%
MATRICES, FUR2 2019 VCAA 2
The theme park has four locations, Air World `(A)`, Food World `(F)`, Ground World `(G)` and Water World `(W)`.
The number of visitors at each of the four locations is counted every hour.
By 10 am on Saturday the park had reached its capacity of 2000 visitors and could take no more visitors.
The park stayed at capacity until the end of the day
The state matrix, `S_0`, below, shows the number of visitors at each location at 10 am on Saturday.
`S_0 = [(600), (600), (400), (400)] {:(A),(F),(G),(W):}`
- What percentage of the park’s visitors were at Water World `(W)` at 10 am on Saturday? (1 mark)
--- 2 WORK AREA LINES (style=lined) ---
Let `S_n` be the state matrix that shows the number of visitors expected at each location `n` hours after 10 am on Saturday.
The number of visitors expected at each location `n` hours after 10 am on Saturday can be determined by the matrix recurrence relation below.
`{:(qquad qquadqquadqquadqquadqquadqquadqquadqquadqquadqquadqquadqquadqquadqquadqquadqquadqquadqquadqquadqquadqquadqquad text( this hour)),(qquadqquadqquadqquadqquadqquadqquadqquadqquadqquadqquadqquadqquadqquadqquadqquadqquadqquadqquad qquad qquad quad A qquad quad F qquad \ G \ quad quad W),({:S_0 = [(600), (600), (400), (400)], qquad S_(n+1) = T xx S_n quad quad qquad text(where):}\ T = [(0.1,0.2,0.1,0.2),(0.3,0.4,0.6,0.3),(0.1,0.2,0.2,0.1),(0.5,0.2,0.1,0.4)]{:(A),(F),(G),(W):}\ text(next hour)):}`
- Complete the state matrix, `S_1`, below to show the number of visitors expected at each location at 11 am on Saturday. (1 mark)
--- 0 WORK AREA LINES (style=lined) ---
`S_1 = [(\ text{______}\ ), (\ text{______}\ ), (300),(\ text{______}\ )]{:(A),(F),(G),(W):}`
- Of the 300 visitors expected at Ground World `(G)` at 11 am, what percentage was at either Air World `(A)` or Food World `(F)` at 10 am? (1 mark)
--- 3 WORK AREA LINES (style=lined) ---
- The proportion of visitors moving from one location to another each hour on Sunday is different from Saturday.
Matrix `V`, below, shows the proportion of visitors moving from one location to another each hour after 10 am on Sunday.
`qquad qquad {:(qquadqquadqquadqquadqquadtext(this hour)),(qquad qquad qquad \ A qquad quad F qquad \ G \ quad quad W),(V = [(0.3,0.4,0.6,0.3),(0.1,0.2,0.1,0.2),(0.1,0.2,0.2,0.1),(0.5,0.2,0.1,0.4)]{:(A),(F),(G),(W):}\ text(next hour)):}`
Matrix `V` is similar to matrix `T` but has the first two rows of matrix `T` interchanged. - The matrix product that will generate matrix `V` from matrix `T` is
- `qquad qquad V = M xx T`
- where matrix `M` is a binary matrix.
- Write down matrix `M`. (1 mark)
--- 4 WORK AREA LINES (style=lined) ---
MATRICES, FUR2 2018 VCAA 3
The Hiroads company has a contract to maintain and improve 2700 km of highway.
Each year sections of highway must be graded `(G)`, resurfaced `(R)` or sealed `(S)`.
The remaining highway will need no maintenance `(N)` that year.
Let `S_n` be the state matrix that shows the highway maintenance schedule for the `n`th year after 2018.
The maintenance schedule for 2018 is shown in matrix `S_0` below.
`S_0 = [(700),(400),(200),(1400)]{:(G),(R),(S),(N):}`
The type of maintenance in sections of highway varies from year to year, as shown in the transition matrix `T`, below.
`{:(qquad qquad qquad qquad qquad quad text(this year)),(qquad qquad quad quad G qquad quad R qquad quad S quad quad \ N),(T = [(0.2,0.1,0.0,0.2),(0.1,0.1,0.0,0.2),(0.2,0.1,0.2,0.1),(0.5, 0.7,0.8,0.5)]{:(G),(R),(S),(N):} \ text (next year)):}`
- Of the length of highway that was graded `(G)` in 2018, how many kilometres are expected to be resurfaced `(R)` the following year? (1 mark)
--- 2 WORK AREA LINES (style=lined) ---
- Show that the length of highway that is to be graded `(G)` in 2019 is 460 km by writing the appropriate numbers in the boxes below. (1 mark)
--- 0 WORK AREA LINES (style=lined) ---
|
|
`× 700 +` |
|
`× 400 +` |
|
`× 200 +` |
|
`× 1400 = 460` |
The state matrix describing the highway maintenance schedule for the nth year after 2018 is given by
`S_(n + 1) = TS_n`
- Complete the state matrix, `S_1`, below for the highway maintenance schedule for 2019 (one year after 2018). (1 mark)
--- 0 WORK AREA LINES (style=lined) ---
`qquad qquad S_1 = [(460),(text{____}),(text{____}),(1490)]{:(G),(R),(S),(N):}`
- In 2020, 1536 km of highway is expected to require no maintenance `(N)`
- Of these kilometres, what percentage is expected to have had no maintenance `(N)` in 2019?
- Round your answer to one decimal place. (1 mark)
--- 3 WORK AREA LINES (style=lined) ---
- In the long term, what percentage of highway each year is expected to have no maintenance `(N)`?
- Round your answer to one decimal place. (1 mark)
--- 4 WORK AREA LINES (style=lined) ---
MATRICES, FUR2 2017 VCAA 3
Senior students at a school choose one elective activity in each of the four terms in 2018.
Their choices are communication (`C`), investigation (`I`), problem-solving (`P`) and service (`S`).
The transition matrix `T` shows the way in which senior students are expected to change their choice of elective activity from term to term.
`{:(qquadqquadqquadqquadquadtext(this term)),(qquadqquadqquad\ CqquadquadIqquadquadPqquad\ S),(T = [(0.4,0.2,0.3,0.1),(0.2,0.4,0.1,0.3),(0.2,0.3,0.3,0.4),(0.2,0.1,0.3,0.2)]{:(C),(I),(P),(S):}qquadtext(next term)):}`
Let `S_n` be the state matrix for the number of senior students expected to choose each elective activity in Term `n`.
For the given matrix `S_1`, a matrix rule that can be used to predict the number of senior students in each elective activity in Terms 2, 3 and 4 is
`S_1 = [(300),(200),(200),(300)],qquadS_(n + 1) = TS_n`
- How many senior students will not change their elective activity from Term 1 to Term 2? (1 mark)
--- 2 WORK AREA LINES (style=lined) ---
- Complete `S_2`, the state matrix for Term 2, below. (1 mark)
--- 3 WORK AREA LINES (style=lined) ---

- Of the senior students expected to choose investigation (`I`) in Term 3, what percentage chose service (`S`) in Term 2? (2 marks)
--- 5 WORK AREA LINES (style=lined) ---
- What is the maximum number of senior students expected in investigation (`I`) at any time during 2018? (1 mark)
--- 3 WORK AREA LINES (style=lined) ---
MATRICES, FUR2 2017 VCAA 2
Junior students at a school must choose one elective activity in each of the four terms in 2018.
Students can choose from the areas of performance (`P`), sport (`S`) and technology (`T`).
The transition diagram below shows the way in which junior students are expected to change their choice of elective activity from term to term.

- Of the junior students who choose performance (`P`) in one term, what percentage are expected to choose sport (`S`) the next term? (1 mark)
--- 1 WORK AREA LINES (style=lined) ---
Matrix `J_1` lists the number of junior students who will be in each elective activity in Term 1.
`J_1 = [(300),(240),(210)]{:(P),(S),(T):}`
- 306 junior students are expected to choose sport (`S`) in Term 2.
Complete the calculation below to show this. (1 mark)
--- 0 WORK AREA LINES (style=lined) ---

- In Term 4, how many junior students in total are expected to participate in performance (`P`) or sport (`S`) or technology (`T`)? (1 mark)
--- 3 WORK AREA LINES (style=lined) ---
MATRICES, FUR1 2017 VCAA 8 MC
Consider the matrix recurrence relation below.
`S_0 = [(40),(15),(20)], \ S_(n + 1) = TS_n` where `T = [(0.3,0.2,V),(0.2,0.2,W),(X,Y,Z)]`
Matrix `T` is a regular transition matrix.
Given the above and that `S_1 = [(29),(13),(33)]`, which of the following expressions is not true?
- `W > Z`
- `Y > X`
- `V > Y`
- `V + W + Z = 1`
- `X + Y + Z > 1`
MATRICES, FUR2 2006 VCAA 2
A new shopping centre called Shopper Heaven (`S`) is about to open. It will compete for customers with Eastown (`E`) and Noxland (`N`).
Market research suggests that each shopping centre will have a regular customer base but attract and lose customers on a weekly basis as follows.
80% of Shopper Heaven customers will return to Shopper Heaven next week
12% of Shopper Heaven customers will shop at Eastown next week
8% of Shopper Heaven customers will shop at Noxland next week
76% of Eastown customers will return to Eastown next week
9% of Eastown customers will shop at Shopper Heaven next week
15% of Eastown customers will shop at Noxland next week
85% of Noxland customers will return to Noxland next week
10% of Noxland customers will shop at Shopper Heaven next week
5% of Noxland customers will shop at Eastown next week
- Enter this information into transition matrix `T` as indicated below (express percentages as proportions, for example write 76% as 0.76). (2 marks)
--- 0 WORK AREA LINES (style=lined) ---
`qquad{:(qquadqquadqquadtext(this week)),((qquadqquadqquad S,qquad E, quad N)),(T = [(qquadqquadqquadqquadqquadqquad),(),()]{:(S),(E),(N):}{:qquadtext(next week):}):}`
During the week that Shopper Heaven opened, it had 300 000 customers.
In the same week, Eastown had 120 000 customers and Noxland had 180 000 customers.
- Write this information in the form of a column matrix, `K_0`, as indicated below. (1 mark)
--- 0 WORK AREA LINES (style=lined) ---
`qquadK_0 = [(quadqquadqquadqquadqquad),(),()]{:(S),(E),(N):}`
- Use `T` and `K_0` to write and evaluate a matrix product that determines the number of customers expected at each of the shopping centres during the following week. (2 marks)
--- 4 WORK AREA LINES (style=lined) ---
- Show by calculating at least two appropriate state matrices that, in the long term, the number of customers expected at each centre each week is given by the matrix (2 marks)
- `qquadK = [(194\ 983),(150\ 513),(254\ 504)]`
--- 5 WORK AREA LINES (style=lined) ---
MATRICES, FUR2 2007 VCAA 2
To study the life-and-death cycle of an insect population, a number of insect eggs (`E`), juvenile insects (`J`) and adult insects (`A`) are placed in a closed environment. The initial state of this population can be described by the column matrix `S_0 = [(400),(200),(100),(0)]{:(E),(J),(A),(D):}` A row has been included in the state matrix to allow for insects and eggs that die (`D`). --- 1 WORK AREA LINES (style=lined) --- In this population In this population, the adult insects have been sterilised so that no new eggs are produced. In these circumstances, the life-and-death cycle of the insects can be modelled by the transition matrix `{:(qquadqquadqquadqquadquadtext(this week)),((qquadqquadqquadE,quad\ J,quadA,\ D)),(T = [(0.4,0,0,0),(0.5,0.4,0,0),(0,0.5,0.8,0),(0.1,0.1,0.2,1)]{:(E),(J),(A),(D):}):}` --- 1 WORK AREA LINES (style=lined) --- --- 1 WORK AREA LINES (style=lined) --- --- 3 WORK AREA LINES (style=lined) --- --- 1 WORK AREA LINES (style=lined) --- --- 4 WORK AREA LINES (style=lined) --- --- 3 WORK AREA LINES (style=lined) --- --- 3 WORK AREA LINES (style=lined) --- --- 3 WORK AREA LINES (style=lined) ---
MATRICES, FUR2 2009 VCAA 3
In 2009, the school entered a Rock Eisteddfod competition.
When rehearsals commenced in February, all students were asked whether they thought the school would make the state finals. The students’ responses, ‘yes’, ‘no’ or ‘undecided’ are shown in the initial state matrix `S_0`.
`S_0 = [(160),(120),(220)]{:(text(yes)),(text(no)),(text(undecided)):}`
- How many students attend this school? (1 mark)
--- 2 WORK AREA LINES (style=lined) ---
Each week some students are expected to change their responses. The changes in their responses from one week to the next are modelled by the transition matrix `T` shown below.
`{:(qquadqquadqquadtext( response this week)),(qquadqquadquadtext( yes no undecided)),(T = [(0.85quad,0.35quad,0.60),(0.10quad,0.40quad,0.30),(0.05quad,0.25quad,0.10)]{:(text(yes)),(text(no)),(text(undecided)):}qquad{:(text(response)),(text(next week)):}):}`
The following diagram can also be used to display the information represented in the transition matrix `T`.

-
- Complete the diagram above by writing the missing percentage in the shaded box. (1 mark)
--- 0 WORK AREA LINES (style=lined) ---
- Of the students who respond ‘yes’ one week, what percentage are expected to respond ‘undecided’ the next week when asked whether they think the school will make the state finals? (1 mark)
--- 1 WORK AREA LINES (style=lined) ---
- In total, how many students are not expected to have changed their response at the end of the first week? (2 marks)
--- 2 WORK AREA LINES (style=lined) ---
- Complete the diagram above by writing the missing percentage in the shaded box. (1 mark)
- Evaluate the product `S_1 = TS_0`, where `S_1` is the state matrix at the end of the first week. (1 mark)
--- 3 WORK AREA LINES (style=lined) ---
- How many students are expected to respond ‘yes’ at the end of the third week when asked whether they think the school will make the state finals? (1 mark)
--- 3 WORK AREA LINES (style=lined) ---
MATRICES, FUR2 2010 VCAA 4
The Dinosaurs (`D`) and the Scorpions (`S`) are two basketball teams that play in different leagues in the same city.
The matrix `A_1` is the attendance matrix for the first game. This matrix shows the number of people who attended the first Dinosaur game and the number of people who attended the first Scorpion game.
`A_1 = [(2000),(1000)]{:(D),(S):}`
The number of people expected to attend the second game for each team can be determined using the matrix equation
`A_2 = GA_1`
where `G` is the matrix `{:(qquadqquadqquadtext(this game)),((qquadqquadqquadD,qquad\ S)),(G = [(1.2,-0.3),(0.2,0.7)]{:(D),(S):}qquad{:text(next game):}):}`
-
- Determine `A_2`, the attendance matrix for the second game. (1 mark)
--- 2 WORK AREA LINES (style=lined) ---
- Every person who attends either the second Dinosaur game or the second Scorpion game will be given a free cap. How many caps, in total, are expected to be given away? (1 mark)
--- 2 WORK AREA LINES (style=lined) ---
- Determine `A_2`, the attendance matrix for the second game. (1 mark)
Assume that the attendance matrices for successive games can be determined as follows.
`A_3 = GA_2`
`A_4 = GA_3`
and so on such that `A_(n + 1) = GA_n`
- Determine the attendance matrix (with the elements written correct to the nearest whole number) for game 10. (1 mark)
--- 3 WORK AREA LINES (style=lined) ---
- Describe the way in which the number of people attending the Dinosaurs’ games is expected to change over the next 80 or so games. (1 mark)
--- 3 WORK AREA LINES (style=lined) ---
The attendance at the first Dinosaur game was 2000 people and the attendance at the first Scorpion game was 1000 people.
Suppose, instead, that 2000 people attend the first Dinosaur game, and 1800 people attend the first Scorpion game.
- Describe the way in which the number of people attending the Dinosaurs’ games is expected to change over the next 80 or so games. (1 mark)
--- 3 WORK AREA LINES (style=lined) ---
MATRICES, FUR2 2010 VCAA 2
The 300 players in Oscar’s league are involved in a training program. In week one, 90 players are doing heavy training (`H`), 150 players are doing moderate training (`M`) and 60 players are doing light training (`L`). The state matrix, `S_1`, shows the number of players who are undertaking each type of training in the first week
`S_1 = [(90),(150),(60)]{:(H),(M),(L):}`
The percentage of players that remain in the same training program, or change their training program from week to week, is shown in the transition diagram below.

- What information does the 20% in the diagram above provide? (1 mark)
--- 2 WORK AREA LINES (style=lined) ---
The information in the transition diagram above can also be written as the transition matrix `T`.
`{:(qquadqquadqquadquad\ text(this week)),((qquadqquadqquadH,quadM,\ L)),(T = [(0.5,0.1,0.1),(0.2,0.6,0.5),(0.3,0.3,0.4)]{:(H),(M),(L):}qquad{:text(next week):}):}`
- Determine how many players will be doing heavy training in week two. (1 mark)
--- 3 WORK AREA LINES (style=lined) ---
- Determine how many fewer players will be doing moderate training in week three than in week one. (1 mark)
--- 4 WORK AREA LINES (style=lined) ---
- Show that, after seven weeks, the number of players (correct to the nearest whole number) who are involved in each type of training will not change. (1 mark)
--- 4 WORK AREA LINES (style=lined) ---
MATRICES, FUR2 2013 VCAA 2
10 000 trout eggs, 1000 baby trout and 800 adult trout are placed in a pond to establish a trout population.
In establishing this population
-
- eggs (`E`) may die (`D`) or they may live and eventually become baby trout (`B`)
- baby trout (`B`) may die (`D`) or they may live and eventually become adult trout (`A`)
- adult trout (`A`) may die (`D`) or they may live for a period of time but will eventually die.
From year to year, this situation can be represented by the transition matrix `T`, where
`{:(qquadqquadqquadqquadqquadtext(this year)),((qquadqquadqquadE,quad\ B,quad\ A,\ D)),(T = [(0,0,0,0),(0.4,0,0,0),(0,0.25,0.5,0),(0.6,0.75,0.5,1)]):}{:(),(),(E),(B),(A),(D):}{:(),(),(qquadtext(next year)):}`
- Use the information in the transition matrix `T` to
- determine the number of eggs in this population that die in the first year. (1 mark)
--- 2 WORK AREA LINES (style=lined) ---
- complete the transition diagram below, showing the relevant percentages. (2 marks)
--- 0 WORK AREA LINES (style=lined) ---
- determine the number of eggs in this population that die in the first year. (1 mark)

The initial state matrix for this trout population, `S_0`, can be written as
`S_0 = [(10\ 000),(1000),(800),(0)]{:(E),(B),(A),(D):}`
Let `S_n` represent the state matrix describing the trout population after `n` years.
- Using the rule `S_n = T S_(n-1)`, determine each of the following.
- `S_1` (1 mark)
--- 3 WORK AREA LINES (style=lined) ---
- the number of adult trout predicted to be in the population after four years (1 mark)
--- 3 WORK AREA LINES (style=lined) ---
- `S_1` (1 mark)
- The transition matrix `T` predicts that, in the long term, all of the eggs, baby trout and adult trout will die.
- How many years will it take for all of the adult trout to die (that is, when the number of adult trout in the population is first predicted to be less than one)? (1 mark)
--- 2 WORK AREA LINES (style=lined) ---
- What is the largest number of adult trout that is predicted to be in the pond in any one year? (1 mark)
--- 3 WORK AREA LINES (style=lined) ---
- How many years will it take for all of the adult trout to die (that is, when the number of adult trout in the population is first predicted to be less than one)? (1 mark)
- Determine the number of eggs, baby trout and adult trout that, if added to or removed from the pond at the end of each year, will ensure that the number of eggs, baby trout and adult trout in the population remains constant from year to year. (2 marks)
--- 4 WORK AREA LINES (style=lined) ---
The rule `S_n = T S_(n – 1)` that was used to describe the development of the trout in this pond does not take into account new eggs added to the population when the adult trout begin to breed.
- To take breeding into account, assume that 50% of the adult trout lay 500 eggs each year.
- The matrix describing the population after one year, `S_1`, is now given by the new rule
- `S_1 = T S_0 + 500\ M\ S_0`
- where `T=[(0,0,0,0),(0.40,0,0,0),(0,0.25,0.50,0),(0.60,0.75,0.50,1.0)], M=[(0,0,0.50,0),(0,0,0,0),(0,0,0,0),(0,0,0,0)]\ text(and)\ S_0=[(10\ 000),(1000),(800),(0)]`
- Use this new rule to determine `S_1`. (1 mark)
--- 4 WORK AREA LINES (style=lined) ---
- Use this new rule to determine `S_1`. (1 mark)
- This pattern continues so that the matrix describing the population after `n` years, `S_n`, is given by the rule
- `S_n = T\ S_(n-1) + 500\ M\ S_(n-1)`
- Use this rule to determine the number of eggs in the population after two years (2 marks)
--- 6 WORK AREA LINES (style=lined) ---
- Use this rule to determine the number of eggs in the population after two years (2 marks)
Show Worked Solution
a.i. `text(60% of eggs die in 1st year,)`
`:.\ text(Eggs that die in year 1)`
`= 0.60 xx 10\ 000`
`= 6000`
MARKER’S COMMENT: A 100% cycle drawn at `D` was a common omission. Do not draw loops and edges of 0%!
| a.ii. |
|

| b.i. | `S_1` | `= TS_0` |
| `= [(0,0,0,0),(0.4,0,0,0),(0,0.25,0.5,0),(0.6,0.75,0.5,1)][(10\ 000),(1000),(800),(0)]= [(0),(4000),(650),(7150)]` |
| b.ii. | `S_4` | `= T^4S_0` |
| `= [(0,0,0,0),(0.4,0,0,0),(0,0.25,0.5,0),(0.6,0.75,0.5,1)]^4[(10\ 000),(1000),(800),(0)]= [(0),(0),(331.25),(11\ 468.75)]` |
`:. 331\ text(trout is the predicted population after 4 years.)`
| c.i. | `S_12 = T^12S_0 = [(0),(0),(1.29),(11\ 791)]` |
`S_13 = T^13S_0 = [(0),(0),(0.65),(11\ 799)]`
`:.\ text{It will take 13 years (when the trout population drops below 1).}`
| c.ii. | `S_1 = TS_0 = [(0),(4000),(650),(7150)]` |
`text(After 1 year, 650 adult trout.)`
`text(Similarly,)`
`S_2 = T^2S_0 = [(0),(0),(1325),(10\ 475)]`
`S_3 = T^3S_0 = [(0),(0),(662.5),(11\ 137.5)]`
`S_4 = T^4S_0 = [(0),(0),(331),(11\ 469)]`
`:.\ text(Largest number of adult trout = 1325.)`
| d. | `S_0-S_1 = [(10\ 000),(1000),(800),(0)]-[(0),(4000),(650),(7150)] = [(10\ 000),(−3000),(150),(−7150)]` |
`:.\ text(Add 10 000 eggs, remove 3000 baby trout and add 150 adult)`
`text(trout to keep the population constant.)`
| e.i. | `S_1` | `= TS_0 + 500MS_0` |
| `= [(0),(4000),(650),(7150)] + 500 xx [(0,0,0.5,0),(0,0,0,0),(0,0,0,0),(0,0,0,0)][(10\ 000),(1000),(800),(0)]` | ||
| `= [(0),(4000),(650),(7150)] + 500[(400),(0),(0),(0)]` | ||
| `= [(200\ 000),(4000),(650),(7150)]` |
| e.ii. | `S_2` | `= TS_1 + 500MS_1` |
|
`= [(0,0,0,0),(0.4,0,0,0),(0,0.25,0.5,0),(0.6,0.75,0.5,1)][(200\ 000),(4000),(650),(7150)]` `+ 500 xx [(0,0,0.5,0),(0,0,0,0),(0,0,0,0),(0,0,0,0)][(200\ 000),(4000),(650),(7150)]` |
||
| `= [(162\ 500),(80\ 000),(1325),(130\ 475)]` |
MATRICES, FUR1 2008 VCAA 7-9 MC
A large population of mutton birds migrates each year to a remote island to nest and breed. There are four nesting sites on the island, A, B, C and D.
Researchers suggest that the following transition matrix can be used to predict the number of mutton birds nesting at each of the four sites in subsequent years. An equivalent transition diagram is also given.
| `{:(qquad qquad qquad qquad {:text(this year):}), (qquad qquad quad quad \ {:(A,\ \ B,\ \ C,\ D):}), (T = [(0.4, 0, 0.2, 0),(0.35, 1, 0.15, 0), (0.15, 0, 0.55, 0), (0.1, 0, 0.1, 1)] {:(A), (B), (C), (D):} quad {:text(next year):}):}` |  |
Part 1
Two thousand eight hundred mutton birds nest at site C in 2008.
Of these 2800 mutton birds, the number that nest at site A in 2009 is predicted to be
A. `560`
B. `980`
C. `1680`
D. `2800`
E. `3360`
Part 2
This transition matrix predicts that, in the long term, the mutton birds will
A. nest only at site A.
B. nest only at site B.
C. nest only at site A and C.
D. nest only at site B and D.
E. continue to nest at all four sites.
Part 3
Six thousand mutton birds nest at site B in 2008.
Assume that an equal number of mutton birds nested at each of the four sites in 2007. The same transition matrix applies.
The total number of mutton birds that nested on the island in 2007 was
A. `6000`
B. `8000`
C. `12\ 000`
D. `16\ 000`
E. `24\ 000`
MATRICES, FUR1 2009 VCAA 9 MC
`T =[[0.8,0.3],[0.2,0.7]]` is a transition matrix.
`S_3 = [[1150],[850]]` is a state matrix.
If `S_3 = TS_2`, then `S_2` equals
A. `[[1000],[1000]]`
B. `[[1090],[940]]`
C. `[[1100],[900]]`
D. `[[1150],[850]]`
E. `[[1175],[825]]`
MATRICES, FUR1 2009 VCAA 7-8 MC
In a country town, people only have the choice of doing their food shopping at a store called Marks (`M`) or at a newly opened store called Foodies (`F`).
In the first week that Foodies opened, only 300 of the town’s 800 shoppers did their food shopping at Marks. The remainder did their food shopping at Foodies.
Part 1
A state matrix `S_1` that can be used to represent this situation is
A. `S_1 = [[300],[800]]{:(M),(F):}`
B. `S_1 = [[500],[300]]{:(M),(F):}`
C. `S_1 = [[800],[300]]{:(M),(F):}`
D. `S_1 = [[300],[500]]{:(M),(F):}`
E. `S_1 = [[800],[500]]{:(M),(F):}`
Part 2
A market researcher predicts that
-
- of those who do their food shopping at Marks this week, 70% will shop at Marks next week and 30% will shop at Foodies
- of those who do their food shopping at Foodies this week, 90% will shop at Foodies next week and 10% will shop at Marks.
A transition matrix that can be used to represent this situation is


MATRICES, FUR1 2011 VCAA 5-6 MC
Two politicians, Rob and Anna, are the only candidates for a forthcoming election. At the beginning of the election campaign, people were asked for whom they planned to vote. The numbers were as follows.

During the election campaign, it is expected that people may change the candidate that they plan to vote for each week according to the following transition diagram.

Part 1
The total number of people who are expected to change the candidate that they plan to vote for one week after the election campaign begins is
A. `828`
B. `1423`
C. `2251`
D. `4269`
E. `6891`
Part 2
The election campaign will run for ten weeks.
If people continue to follow this pattern of changing the candidate they plan to vote for, the expected winner after ten weeks will be
A. Rob by about 50 votes.
B. Rob by about 100 votes.
C. Rob by fewer than 10 votes.
D. Anna by about 100 votes.
E. Anna by about 200 votes.
MATRICES, FUR1 2014 VCAA 7 MC
A transition matrix, `T`, and a state matrix, `S_2`, are defined as follows.
`T=[(0.5,0,0.5),(0.5,0.5,0),(0,0.5,0.5)]\ \ \ \ \ S_2=[(300),(200),(100)]`
If `S_2 = TS_1`, the state matrix `S_1` is
