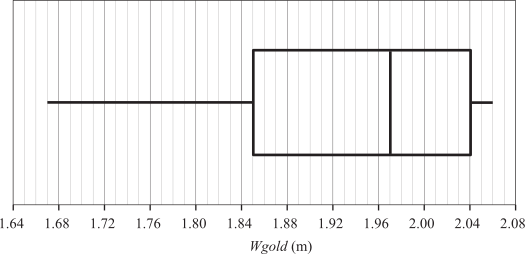
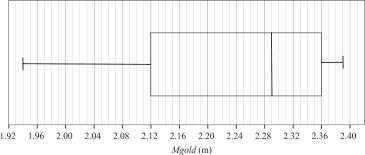
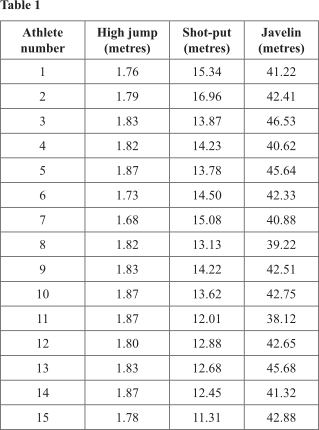
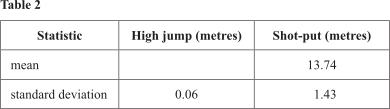
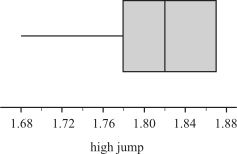
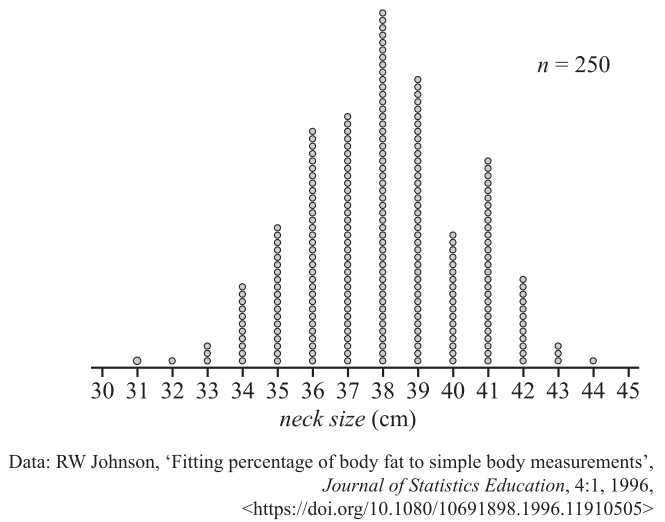
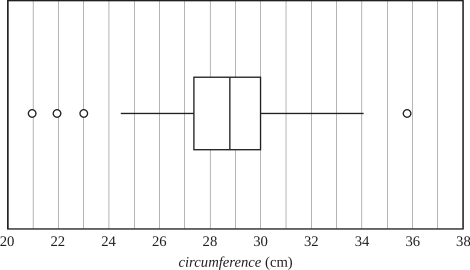
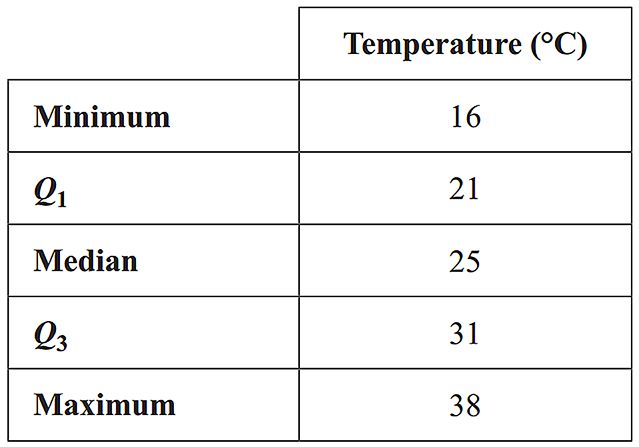
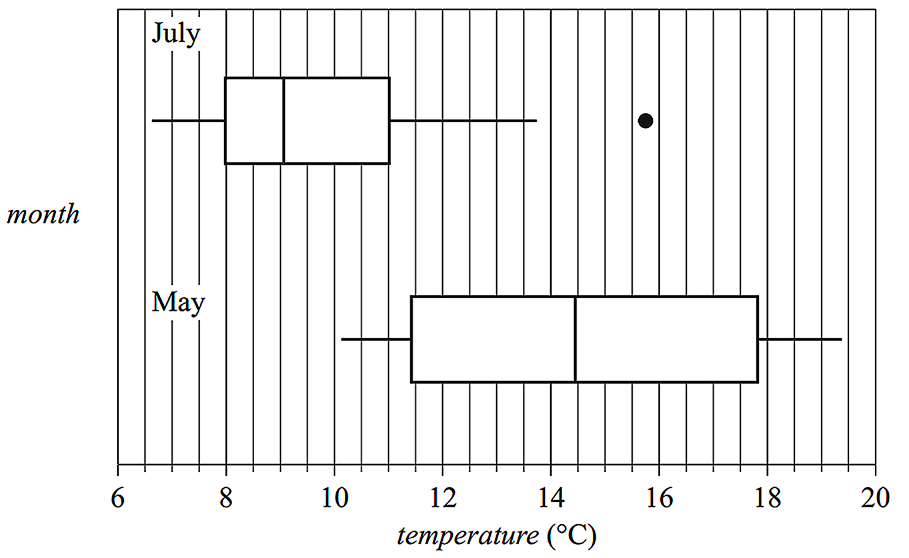
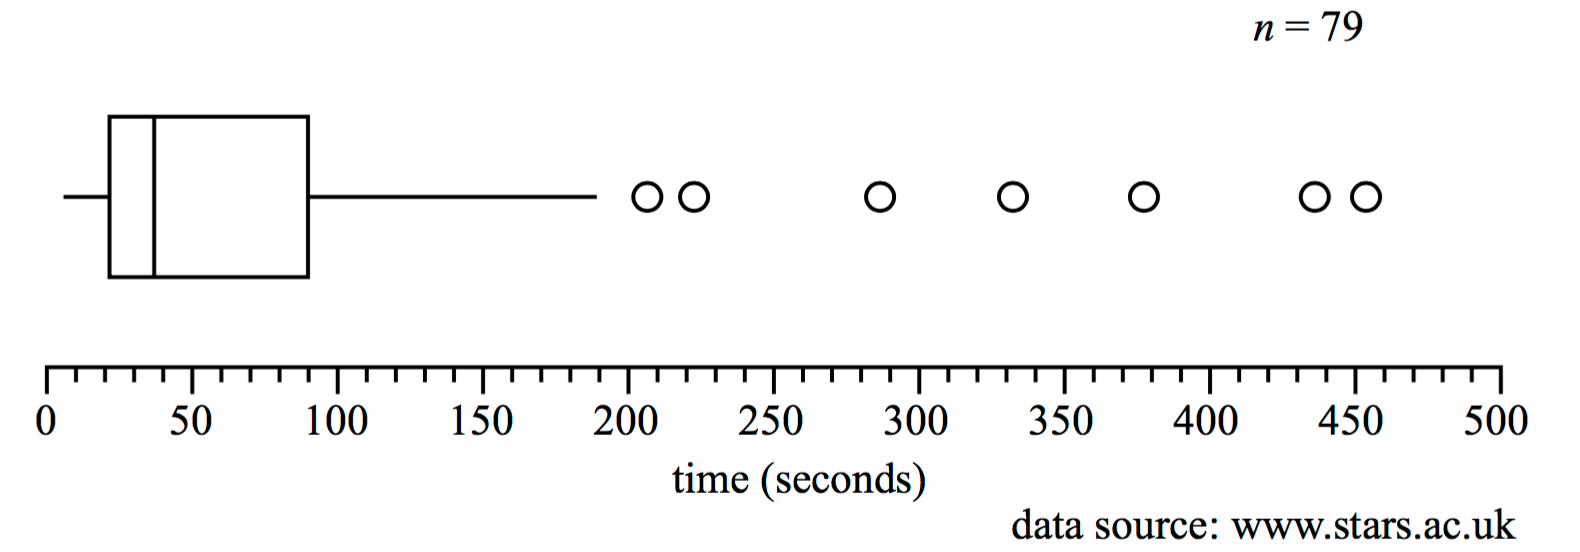
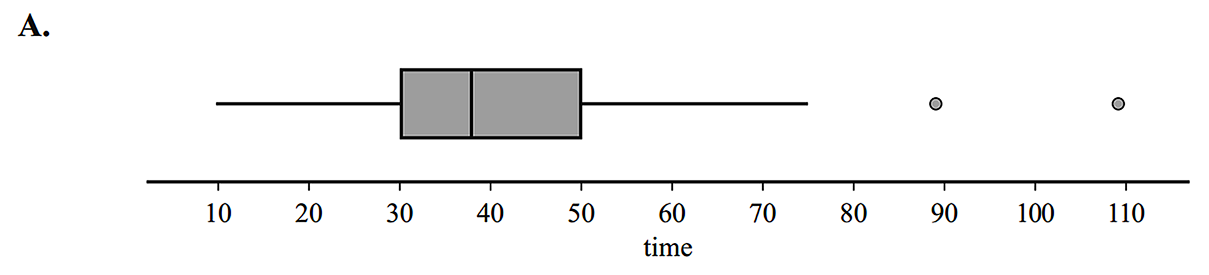
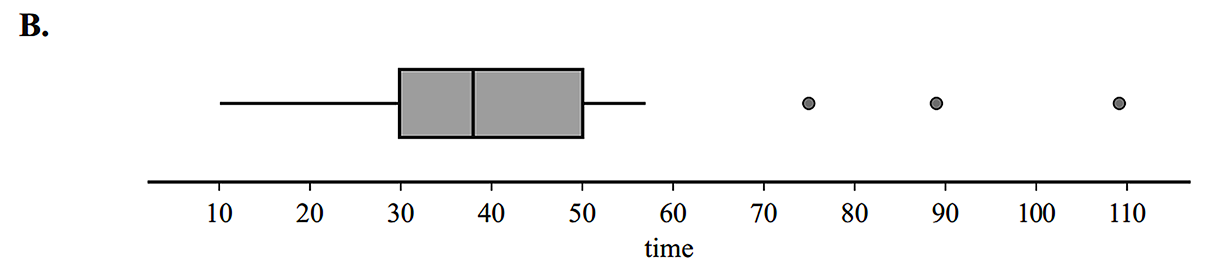
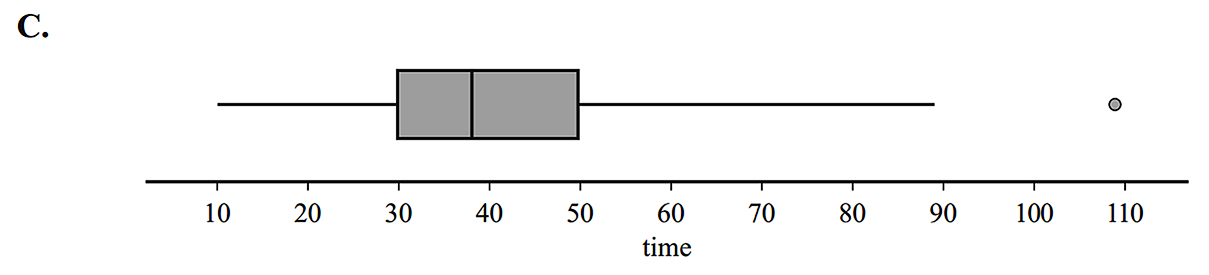
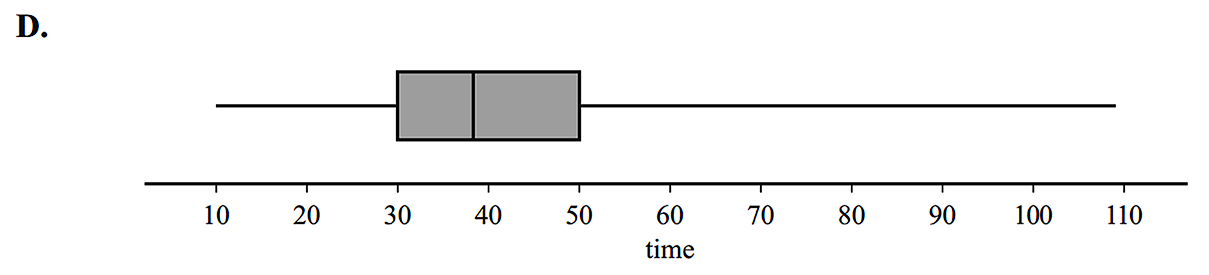
A boxplot for the sale prices of a sample of 203 homes is shown.
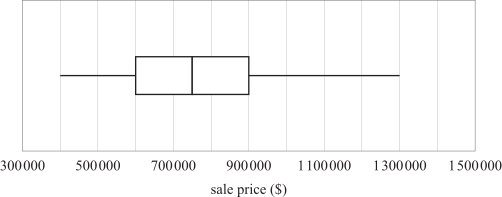
- Calculate the range of the sale price data in the boxplot. (1 mark)
--- 1 WORK AREA LINES (style=lined) ---
- Calculate the upper fence for the sale price data in the boxplot. (1 mark)
--- 3 WORK AREA LINES (style=lined) ---