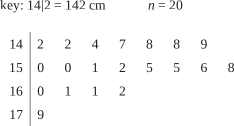
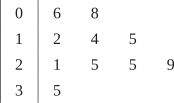
The stem-and-leaf plot shows the age of 24 volunteers at a charity event.
\(\begin{array}{c|l}
\text{Stem} & \quad \quad \text{Leaf} \\
\hline \rule{0pt}{2.5ex}1 & \ 3\ \ \ \ 5 \\
2 & \ 0\ \ \ \ 2\ \ \ \ 5 \\
3 & \ 0\ \ \ \ 2\ \ \ \ 4\ \ \ \ 6 \\
4 & \ 1\ \ \ \ 3\ \ \ \ 3\ \ \ \ 7\ \ \ \ 8\ \ \ \ 9 \\
5 & \ 0\ \ \ \ 2\ \ \ \ 2\ \ \ \ \textbf{X} \\
6 & \ 1\ \ \ \ 4\ \ \ \ 6\ \ \\
7 & \ 0\ \ \ \ 2\ \ \\
\end{array} \qquad \qquad \boxed{\begin{array}{l} \text{KEY:} \\ 3\,|\,2=32 \end{array}}\)
- Describe the shape of the distribution. (1 mark)
--- 2 WORK AREA LINES (style=lined) ---
- It is known that the upper quartile of the dataset is 55.
- Find the value of \(\textbf{X}\). (2 marks)
--- 4 WORK AREA LINES (style=lined) ---