SmarterEd

Aussie Maths & Science Teachers: Save your time with SmarterEd

  • Login
  • Get Help
  • About

Statistics, STD2 S1 2015 HSC 29d*

Data from 200 recent house sales are grouped into class intervals and a cumulative frequency histogram is drawn.
 

2UG 2015 29d1 

  1. Use the graph to estimate the median house price.   (1 mark)

    --- 1 WORK AREA LINES (style=lined) ---

  2. By completing the table, identify the modal class interval for the house price data.   (2 marks)

\begin{array} {|c|c|}
\hline
\rule{0pt}{2.5ex} \text{Class Centre} \rule[-1ex]{0pt}{0pt} & \text{Frequency} \\ \text{(\$'000)} &  \\
\hline
\rule{0pt}{2.5ex}  \rule[-1ex]{0pt}{0pt} &  \\
\hline
\rule{0pt}{2.5ex}  \rule[-1ex]{0pt}{0pt} &  \\
\hline
\rule{0pt}{2.5ex}  \rule[-1ex]{0pt}{0pt} &  \\
\hline
\rule{0pt}{2.5ex}  \rule[-1ex]{0pt}{0pt} & \\
\hline
\end{array}

--- 2 WORK AREA LINES (style=lined) ---

Show Answers Only
a.   

2UG 2015 29d Answer

`text(From the graph, the estimated median house price = $392 500)`

b.

\begin{array} {|c|c|}
\hline
\rule{0pt}{2.5ex} \text{Class Centre} \rule[-1ex]{0pt}{0pt} & \text{Frequency} \\ \text{(\$’000)} &  \\
\hline
\rule{0pt}{2.5ex}  375 \rule[-1ex]{0pt}{0pt} & 30\\
\hline
\rule{0pt}{2.5ex}  385 \rule[-1ex]{0pt}{0pt} &  50 \\
\hline
\rule{0pt}{2.5ex}  395 \rule[-1ex]{0pt}{0pt} & 70 \\
\hline
\rule{0pt}{2.5ex}  405 \rule[-1ex]{0pt}{0pt} & 50 \\
\hline
\end{array}

 
`text{Modal class interval}\ = $390\ 000-$400\ 000\  (\text{or}\ $395\ 000)`
Show Worked Solution
a.   

2UG 2015 29d Answer

`text(From the graph, the estimated median house price = $392 500)`

b.

\begin{array} {|c|c|}
\hline
\rule{0pt}{2.5ex} \text{Class Centre} \rule[-1ex]{0pt}{0pt} & \text{Frequency} \\ \text{(\$’000)} &  \\
\hline
\rule{0pt}{2.5ex}  375 \rule[-1ex]{0pt}{0pt} & 30\\
\hline
\rule{0pt}{2.5ex}  385 \rule[-1ex]{0pt}{0pt} &  50 \\
\hline
\rule{0pt}{2.5ex}  395 \rule[-1ex]{0pt}{0pt} & 70 \\
\hline
\rule{0pt}{2.5ex}  405 \rule[-1ex]{0pt}{0pt} & 50 \\
\hline
\end{array}

 
`text{Modal class interval}\ = $390\ 000-$400\ 000\  (\text{or}\ $395\ 000)`
Filed Under: Data Tagged With: Band 4, smc-6805-20-CF Histogram, smc-6805-30-Find Mode/Median

Statistics, 2ADV S2 2021 HSC 4 MC

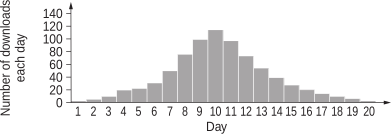
The number of downloads of a song on each of twenty consecutive days is shown in the following graph.
 

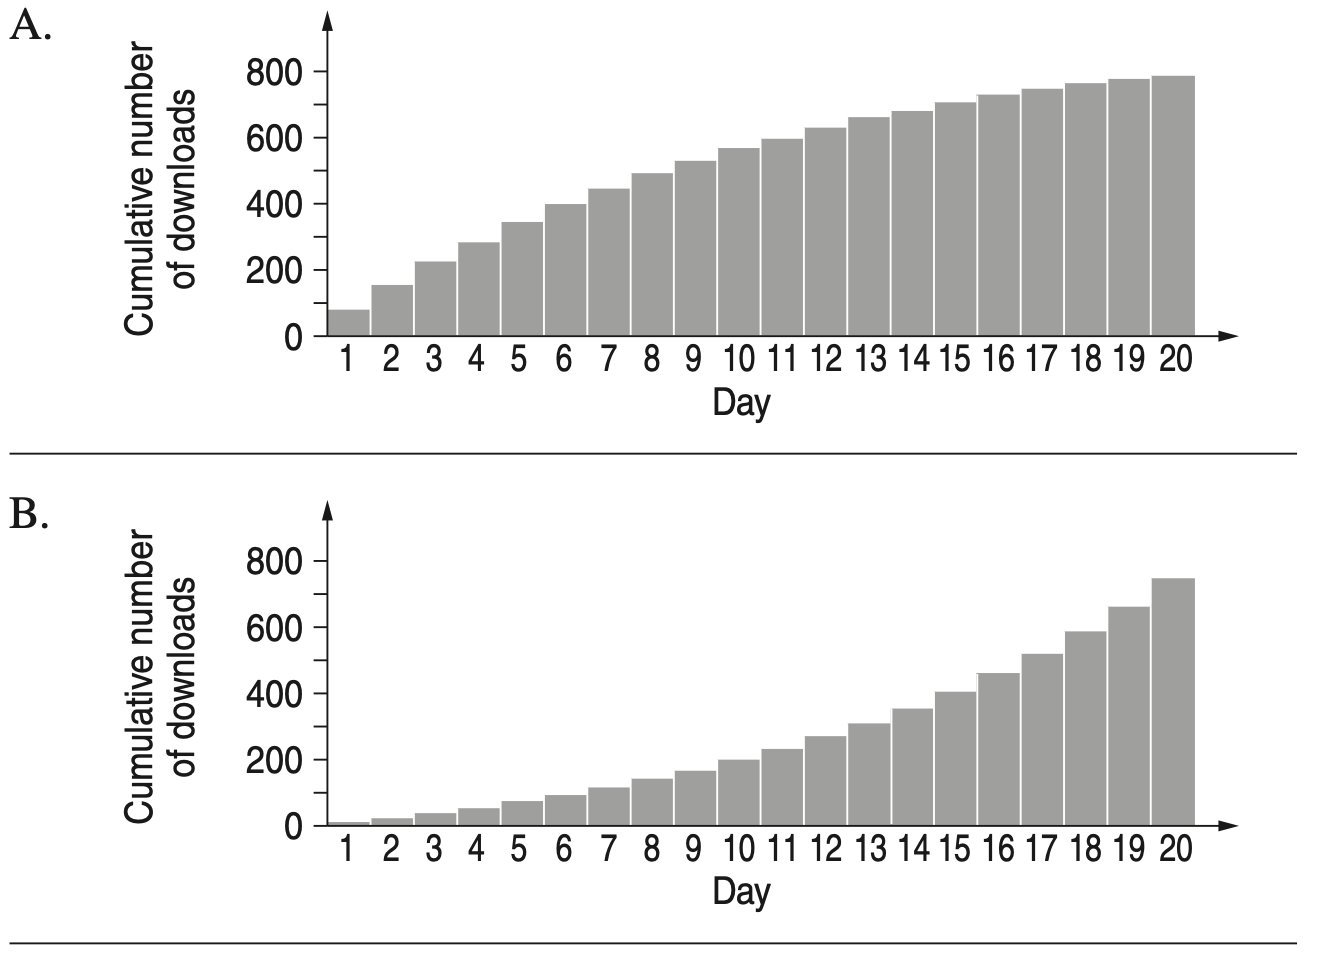
Which of the following graphs best shows the cumulative number of downloads up to and including each day?

Show Answers Only

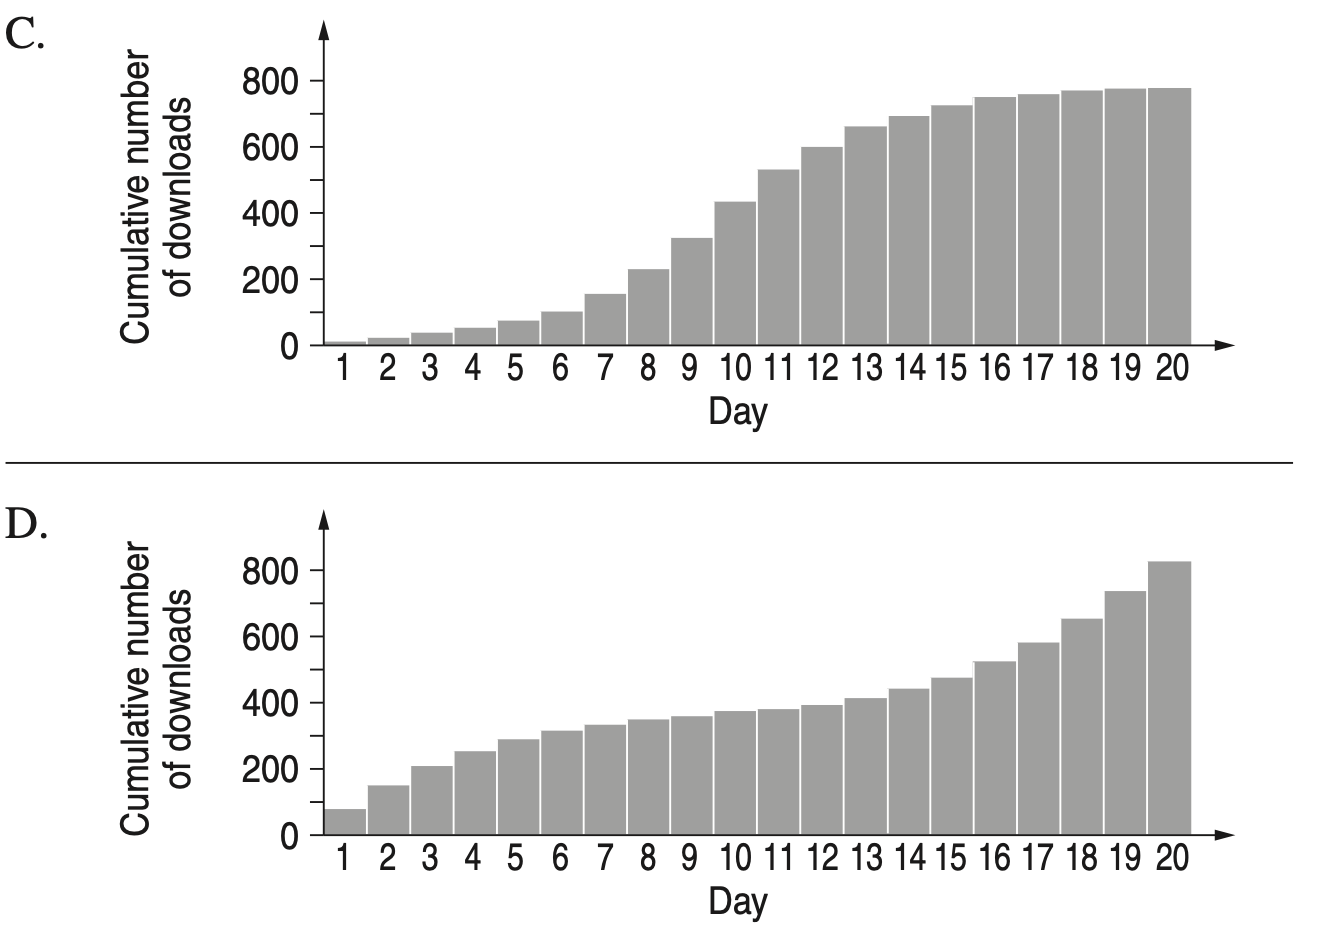
`C`

Show Worked Solution

`text{The gradient of the cumulative frequency histogram}`

`text{will increase gradually, be steepest at day 10 then}`

`text{decrease gradually.}`

`=> C`

Filed Under: Bar Charts and Histograms, Data Tagged With: 2adv-std2-common, Band 3, common-content, smc-6805-20-CF Histogram, smc-997-20-Cumulative Frequency Histograms

Statistics, STD2 S1 2014 HSC 26e

The times taken for 160 music downloads were recorded, grouped into classes and then displayed using the cumulative frequency histogram shown.   


On the diagram, draw the lines that are needed to find the median download time.   (2 marks)

--- 0 WORK AREA LINES (style=lined) ---

Show Answers Only

Show Worked Solution
♦♦♦ Mean mark 17%.

HSC 2014 26ei

Filed Under: Bar Charts and Histograms, Bar Charts and Histograms, Bar Charts and Histograms, Data, Displaying Data - Bar Charts and Histograms Tagged With: Band 6, common-content, smc-6310-30-Cumulative Frequency Histograms, smc-6805-20-CF Histogram, smc-6805-30-Find Mode/Median, smc-821-20-Cumulative Frequency Histograms, smc-997-20-Cumulative Frequency Histograms

Copyright © 2014–2026 SmarterEd.com.au · Log in