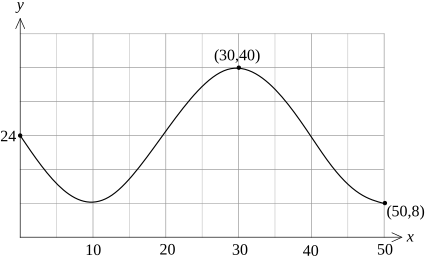
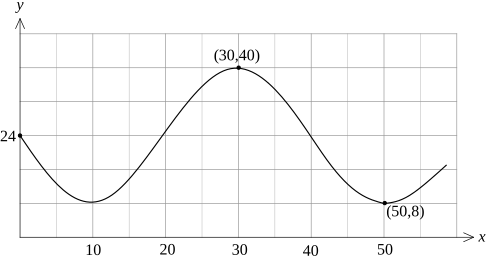
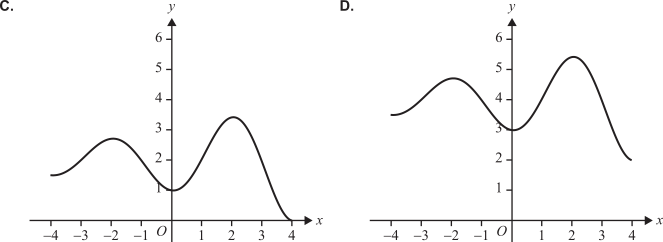
The graph of \(y=f(x)\) is shown below.
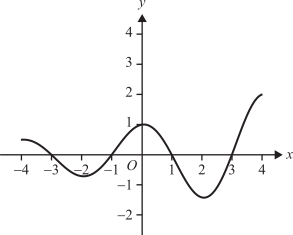
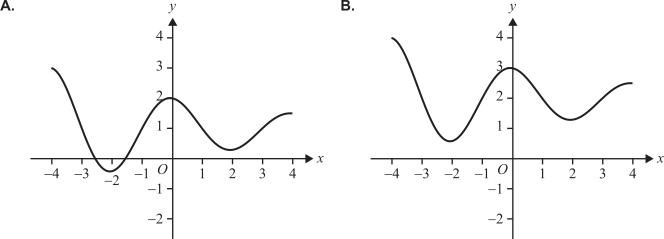
Which one of the following options best represents the graph of \(y=f(-x)+2\) ?
Aussie Maths & Science Teachers: Save your time with SmarterEd
The graph of \(y=f(x)\) is shown below.
Which one of the following options best represents the graph of \(y=f(-x)+2\) ?
A function that has a range of \([6,12]\) is
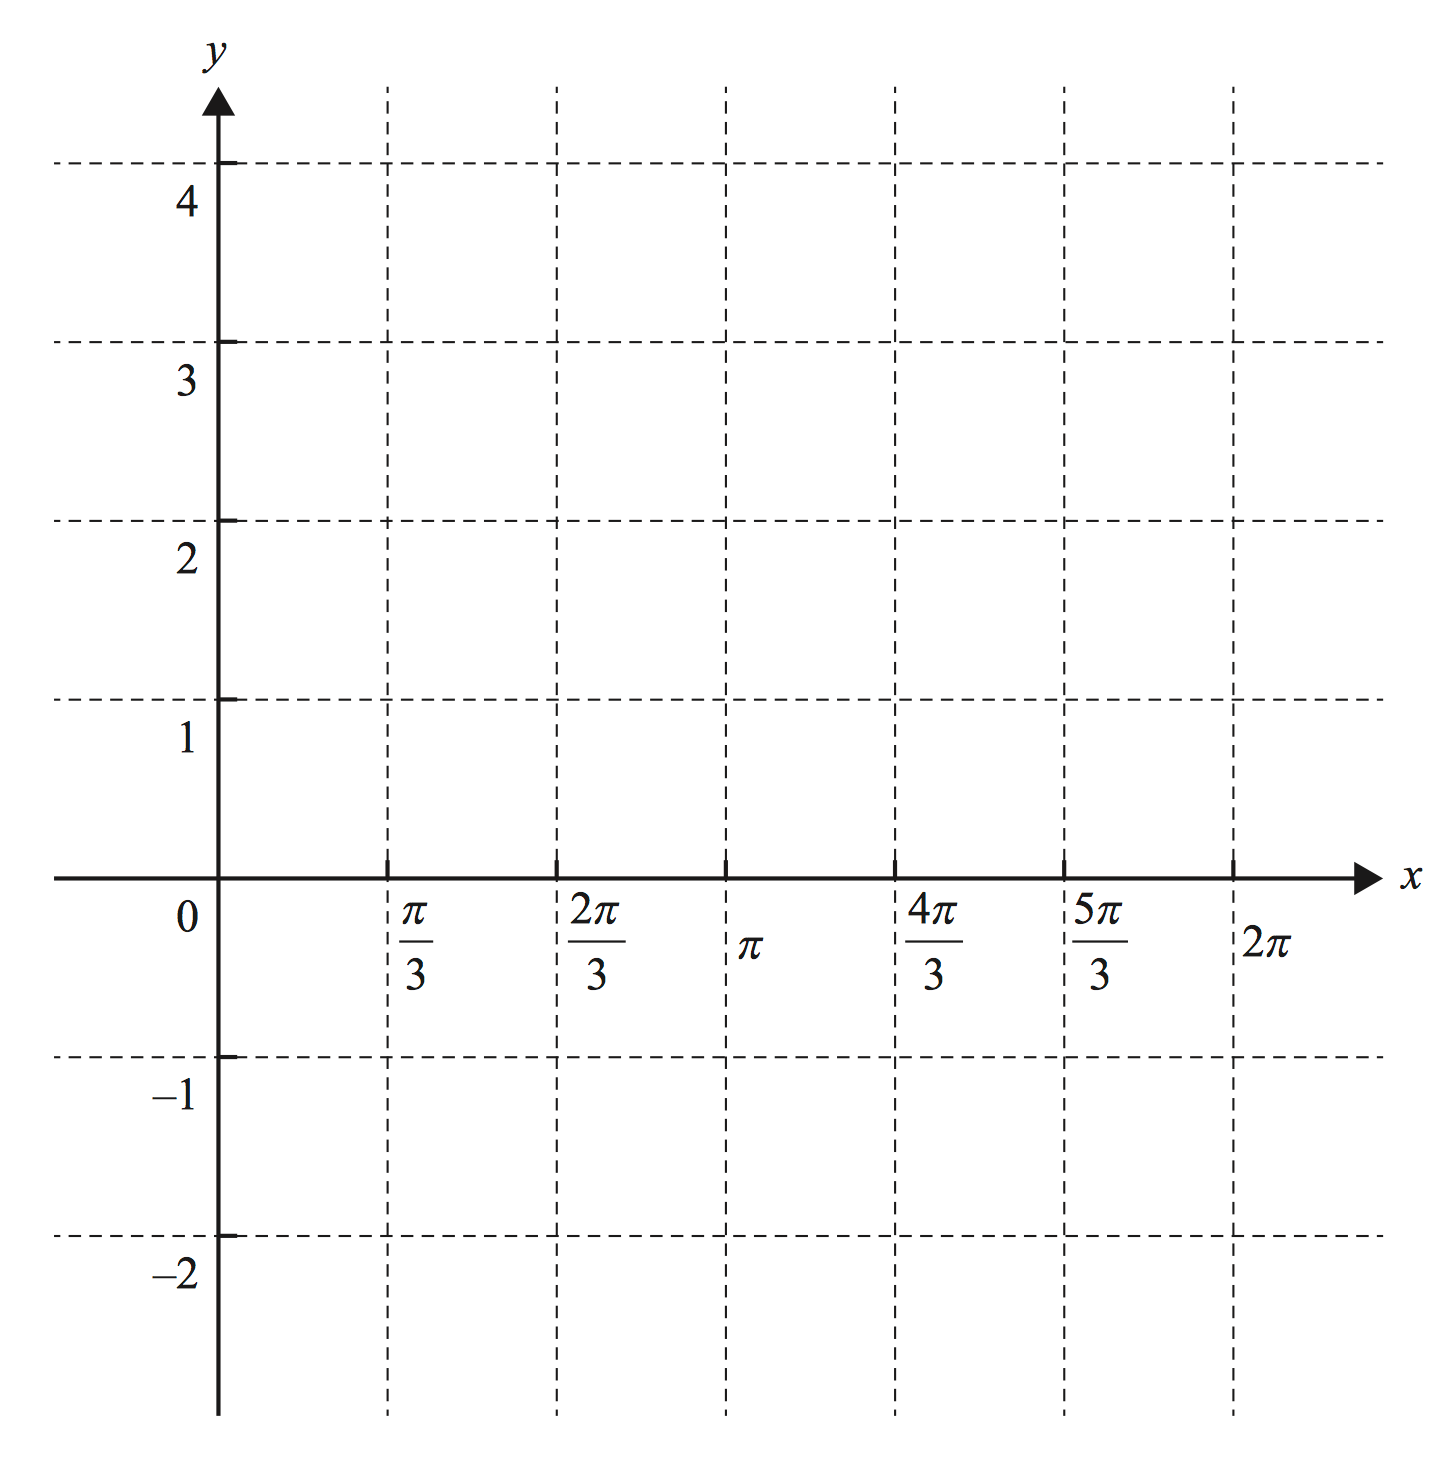
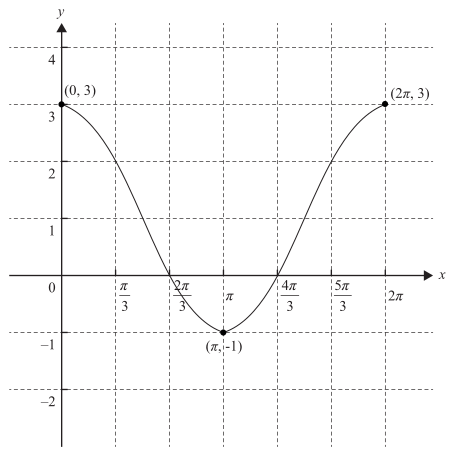
Let \(f(x)=2 \cos (2 x)+1\) over the domain \(x \in\left[0, 2 \pi \right]\).
--- 2 WORK AREA LINES (style=lined) ---
--- 8 WORK AREA LINES (style=lined) ---
--- 0 WORK AREA LINES (style=lined) ---
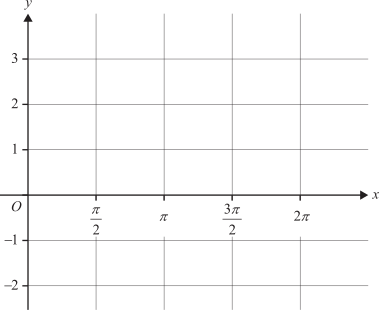
a. \(\text{Range of } f(x):-1 \leqslant y \leqslant 3\)
b. \(x=\dfrac{\pi}{3}, \dfrac{2 \pi}{3}, \dfrac{4 \pi}{3}, \dfrac{5 \pi}{3}\)
c.
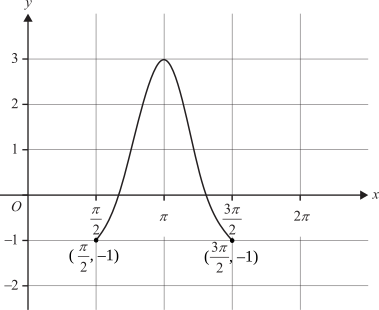
a. \(\text{Amplitude}=2 \ \ \text{about} \ \ y=1.\)
\(\text{Range of } f(x):\ -1 \leqslant y \leqslant 3\)
| b. | \(2 \cos (2 x)+1\) | \(=0\) |
| \(\cos (2 x)\) | \(=-\dfrac{1}{2}\) |
\(\text{Base angle}=\dfrac{\pi}{3}\)
\(2x=\pi-\dfrac{\pi}{3}, \pi+\dfrac{\pi}{3}, \cdots\)
\(2x=\dfrac{2 \pi}{3}, \dfrac{4 \pi}{3}, \dfrac{8 \pi}{3}, \dfrac{10 \pi}{3}\)
\(x=\dfrac{\pi}{3}, \dfrac{2 \pi}{3}, \dfrac{4 \pi}{3}, \dfrac{5 \pi}{3}\)
c.
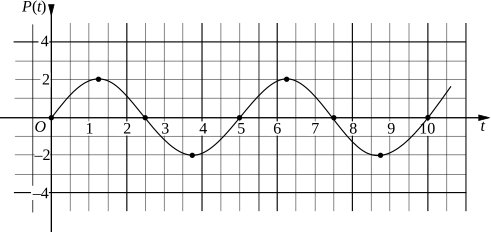
A sound wave can be modelled using a function \(P(t)=k\, \sin a t\), where \(P\) is air pressure in Pascals, \(t\) is time in milliseconds (ms) and \(k\) and \(a\) are constants.
--- 6 WORK AREA LINES (style=lined) ---
--- 5 WORK AREA LINES (style=lined) ---
--- 4 WORK AREA LINES (style=lined) ---
a. \(P_1(t)=2\, \sin \left(\dfrac{2 \pi t}{5}\right)\)
b.
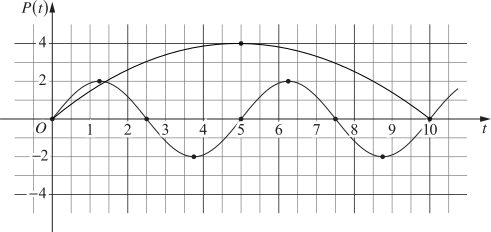
c. \(\text{Both decreasing for} \ \ 6.25<t<8.75\)
a. \(\text{Amplitude}=2 \Rightarrow k=2\)
\(\text{Period}=5\)
| \(\dfrac{2 \pi}{a}\) | \(=5\) |
| \(5a\) | \(=2 \pi\) |
| \(a\) | \(=\dfrac{2 \pi}{5}\) |
\(\therefore P_1(t)=2\, \sin \left(\dfrac{2 \pi t}{5}\right)\)
b.
\(P_2(t)=4\, \sin \left(\dfrac{\pi}{10} t\right)\)
\(\text{Amplitude}=4\)
\(\text{Period}=\dfrac{2 \pi}{\frac{\pi}{10}}=20\)
c. \(\text {By inspection of graph:}\)
\(P_2(t) \ \text {is decreasing for} \ \ 5<t \leq10\)
\(P_1(t) \text { is decreasing for} \ \ 1.25<t<3.75 \ \ \text{and}\ \ 6.25<t<8.75\)
\(\therefore \ \text{Both decreasing for} \ \ 6.25<t<8.75\)
A function is defined as \(f(x)=-2\cos\Big( \dfrac{\pi x}{3} \Big). \)
--- 5 WORK AREA LINES (style=lined) ---
--- 12 WORK AREA LINES (style=lined) ---
a. \(\text{Amplitude}\ = 2\)
\(\text{Period}\ (T) = 6 \)
b.
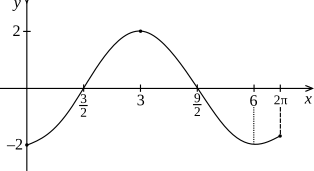
a. \(\text{Amplitude}\ = 2\)
\(\text{Period}\ (T) = \dfrac{2\pi}{n} = \dfrac{2\pi}{\frac{\pi}{3}} = 6 \)
b.
--- 0 WORK AREA LINES (style=blank) --- --- 6 WORK AREA LINES (style=lined) --- a. b. \(x=\dfrac{2\pi}{3}\) a.
 Show Answers Only
 Show Worked Solution
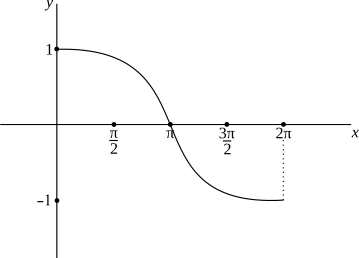
b.
\(\quad y\)
\(=\cos \Big(\dfrac{x}{2}\Big)\)
\(0.5\)
\(=\cos \Big(\dfrac{x}{2}\Big) \)
\(\dfrac{x}{2}\)
\(=\cos^{-1} (0.5) \)
\(\dfrac{x}{2}\)
\(=\dfrac{\pi}{3}, \ \dfrac{5\pi}{3}\)
\(x\)
\(=\dfrac{2\pi}{3}\ \ (0 \leqslant x \leqslant 2 \pi) \)
The graph of `y=k sin (ax)`
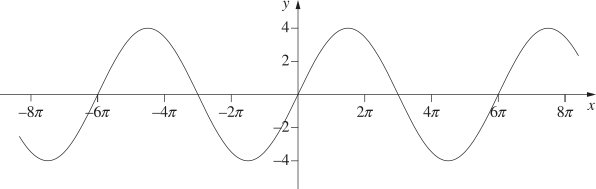
What are the values of `k` and `a`? (2 marks)
--- 4 WORK AREA LINES (style=lined) ---
The period of the function `f(x) = tan((pix)/2)` is
For what values of `x`, in the interval `0 <= x <= pi/4`, does the line `y = 1` intersect the graph of `y = 2sin4x`? (2 marks)
--- 4 WORK AREA LINES (style=lined) ---
Shown below is part of the graph of a period of the function of the form `y = tan(ax + b)`.
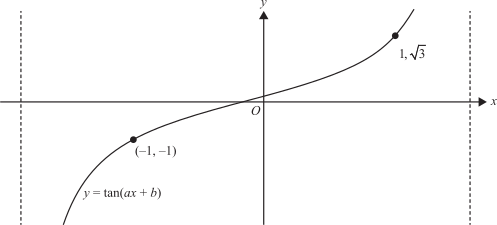
Find the value of `a` and the value of `b`, where `a > 0` and `0 < b < 1`. (3 marks)
--- 6 WORK AREA LINES (style=lined) ---
Which interval gives the range of the function `y = 5 + 2cos3x` ?
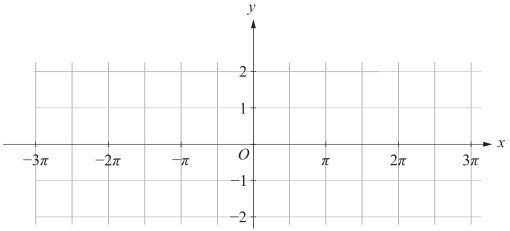
By drawing graphs on the number plane, show how many solutions exist for the equation `cosx = |(x-pi)/4|` in the domain `(-∞, ∞)` (3 marks)
--- 1 WORK AREA LINES (style=lined) ---
`text(4 solutions)`
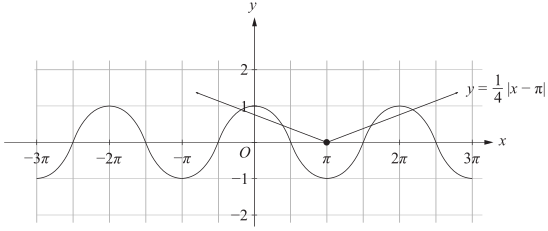
`text(Sketch:)`
| `y` | `= cos x` |
| `y` | `= |(x-pi)/4|` |
`text(Translate)\ pi\ text(units to the right: )`
`y=|x| \ => \ y=|x-pi|`
`text(Multiply by)\ 1/4 :`
`y=|x-pi| \ => \ y= 1/4 |x-pi| = |(x-pi)/4|`
`:.\ text(There are 4 solutions.)`
The function `f(x) = sin x` is transformed into the function `g(x) = (sin(4x))/3`.
Describe in words how the amplitude and period have changed in this transformation. (2 marks)
The diagram below shows one cycle of a circular function.
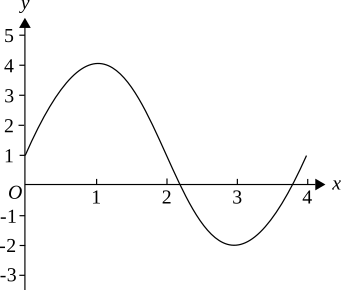
The amplitude and period of this function are respectively
The diagram shows part of the graph of `y = a sin(bx) + 4`.
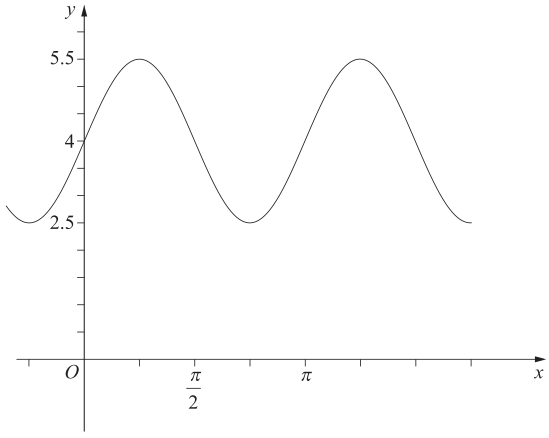
What are the values of `a` and `b`?
For the function `f(x) = 5 cos (2 (x + pi/3)),\ \ \ -pi<=x<=pi`
--- 4 WORK AREA LINES (style=lined) ---
Label endpoints of the graph with their coordinates. (3 marks)
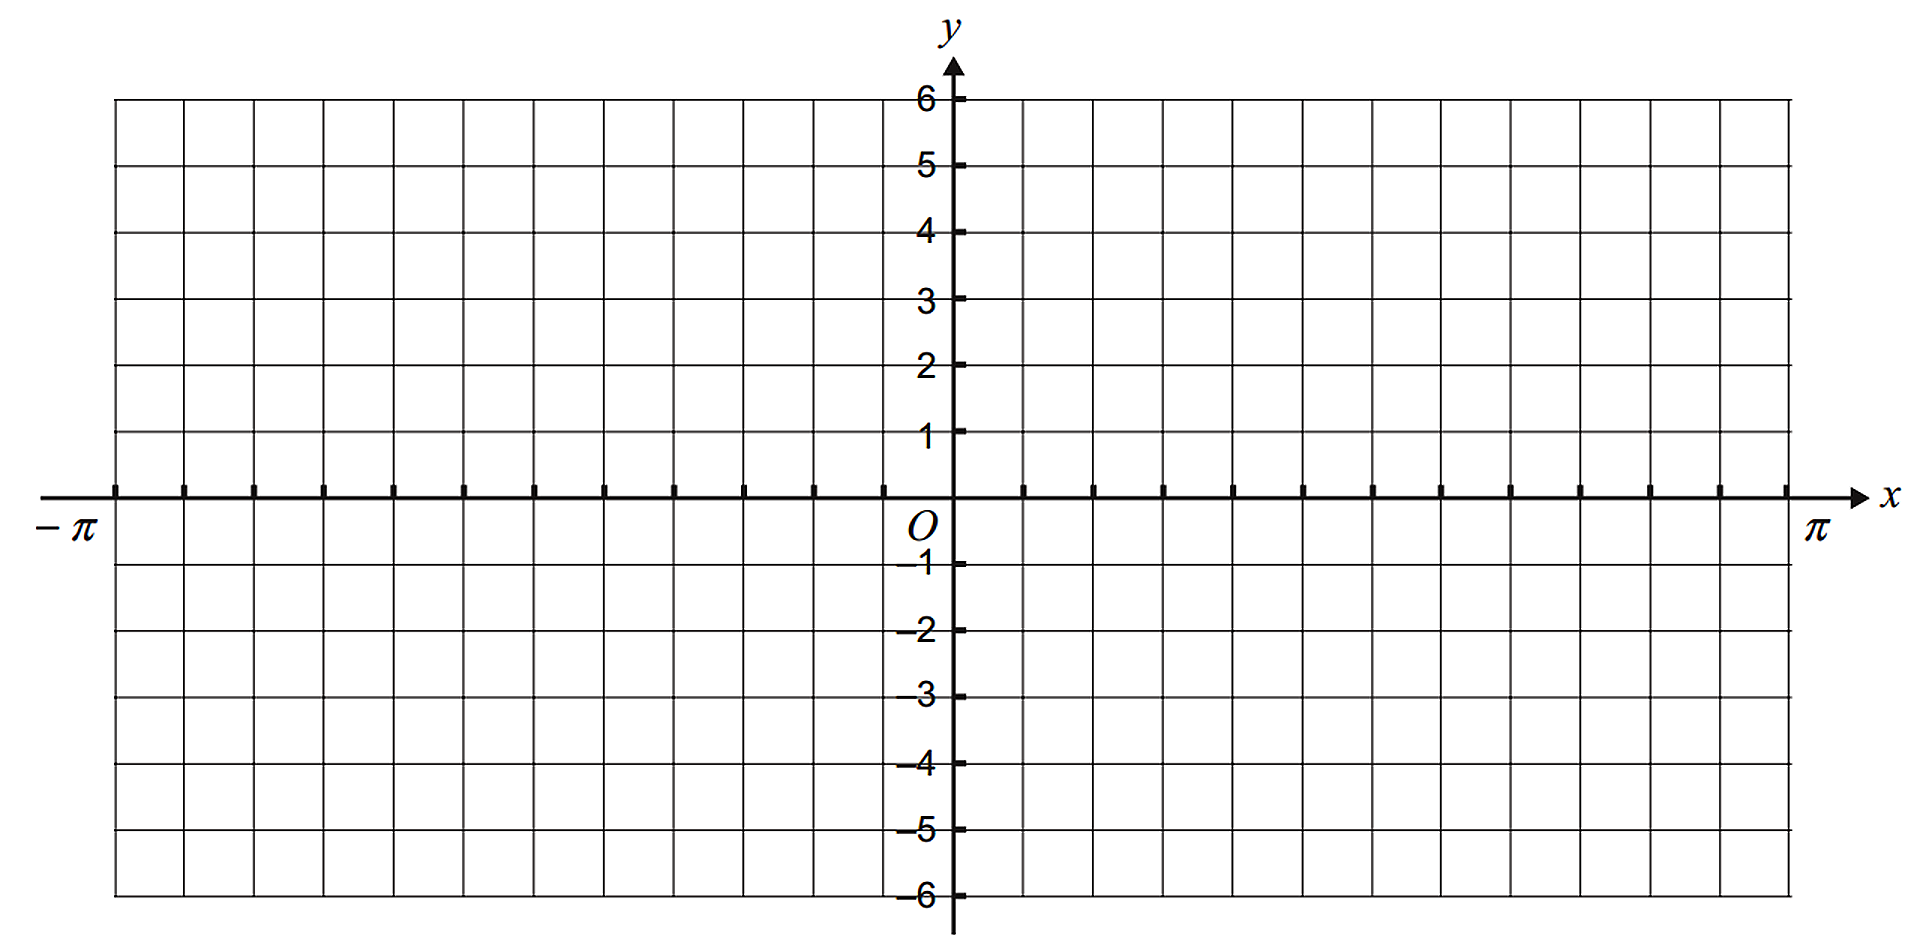
--- 0 WORK AREA LINES (style=lined) ---
a. `text(Amplitude) = 5;\ \ \ text(Period) = pi`
| b. | 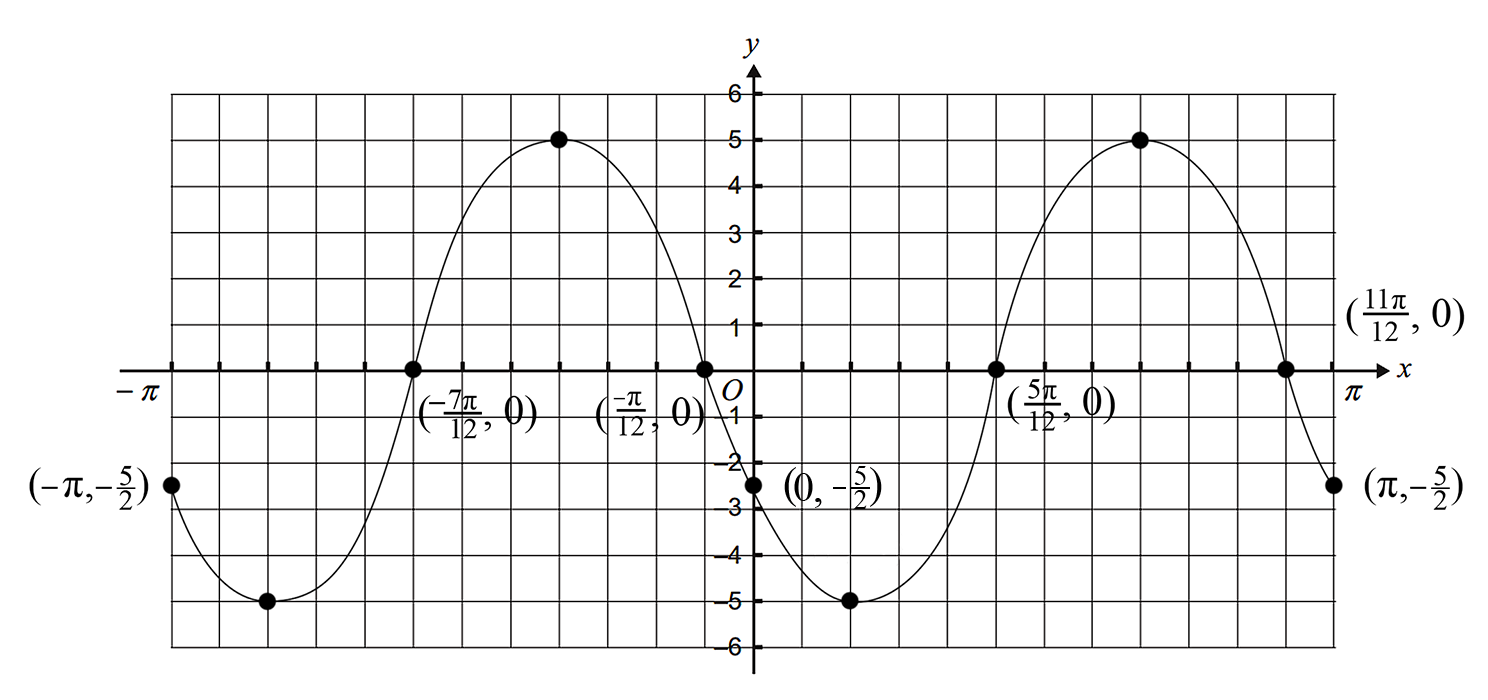 |
a. `text(Amplitude) = 5`
`text(Period) = (2 pi)/2 = pi`
b. `text(Shift)\ \ y = 5 cos (2x)\ \ text(left)\ \ pi/3\ \ text(units).`
`text(Period) = pi`
`text(Endpoints are)\ \ (-pi, -5/2) and (pi,-5/2)`
State the range and period of the function
`h(x) = 4 + 3 cos ((pi x)/2).` (2 marks)
--- 4 WORK AREA LINES (style=lined) ---
Let `f(x) = 2cos(x) + 1` for `0<=x<=2pi`.
--- 4 WORK AREA LINES (style=lined) ---
--- 0 WORK AREA LINES (style=lined) ---
a. `(2pi)/3, (4pi)/3`
b.
| a. | `2cos(x) + 1` | `= 0` |
| `cos(x)` | `=-1/2` |
`=> cos\ pi/3 = 1/2\ text(and cos is negative)`
`text(in 2nd/3rd quadrant)`
| `:.x` | `= pi-pi/3, pi + pi/3` |
| `= (2pi)/3, (4pi)/3` |
| b. | |
`f(x) = 2 sin (2x)` is defined in the domain `{x: \ pi/8 <= x < pi/3)`
What is the range of the function `f(x)`? (2 marks)
--- 6 WORK AREA LINES (style=lined) ---
`sin(2x)_text(max)\ \ text(occurs when)\ \ x=pi/4\ \ text{(within domain)}`
`=> f(x)_text(max) = 2 sin(pi/2) = 2`
`text(Checking endpoints:)`
`text(When)\ \ x=pi/8\ \ =>\ \ y=2 sin(pi/4) = sqrt2`
`text(When)\ \ x=pi/3\ \ =>\ \ y=2 sin((2pi)/3) = sqrt3`

`:.\ text(Range) = [sqrt 2, 2],`

The graph shown could have equation
The function with equation `f(x) = 4 tan (x/3)` has period
A section of the graph of `f(x)` is shown below.
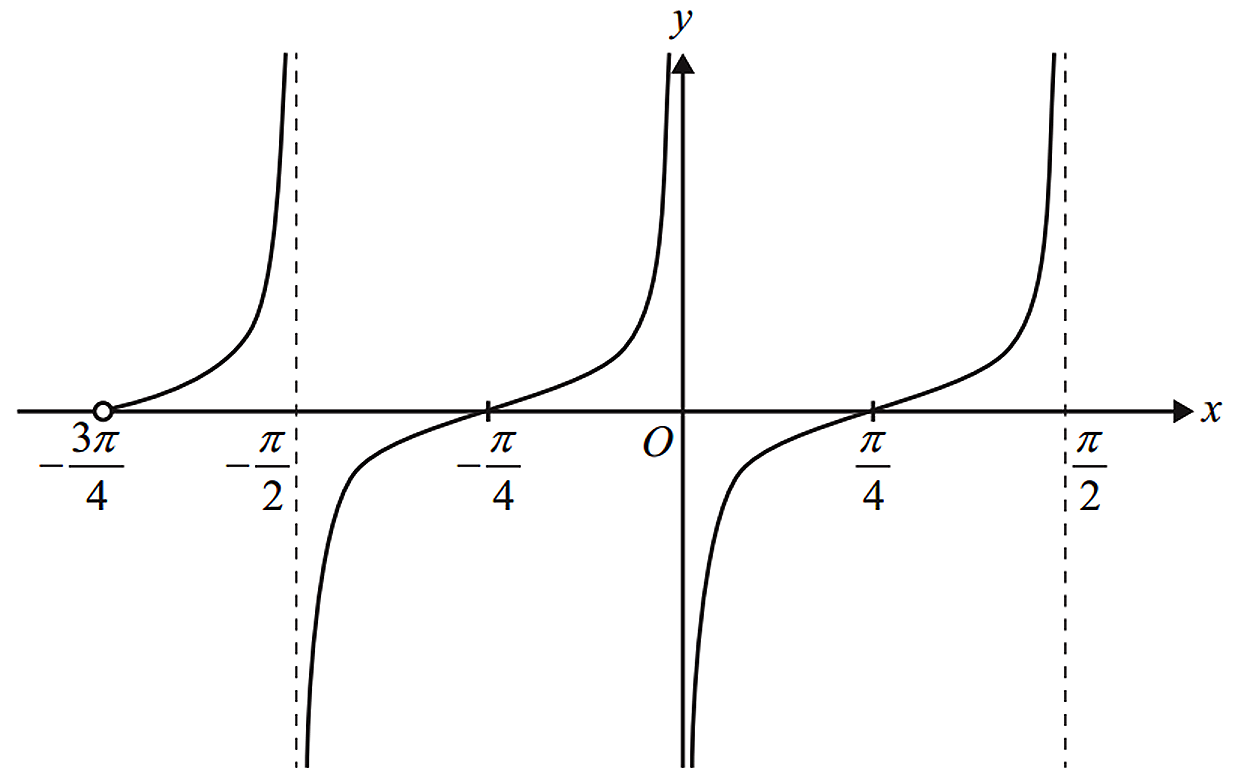
The equation of `f(x)` could be
Let `f (x) = 5sin(2x)-1`.
The period and range of this function are respectively
Let `f(x) = 1-2 cos ({pi x}/2).`
The period and range of this function are respectively
`f(x) = 2sin(3x) - 3`
The period and range of this function are respectively
Sketch the curve `y = 4 + 3 sin 2x` for `0 <= x <= 2 pi`. (3 marks)
--- 8 WORK AREA LINES (style=lined) ---
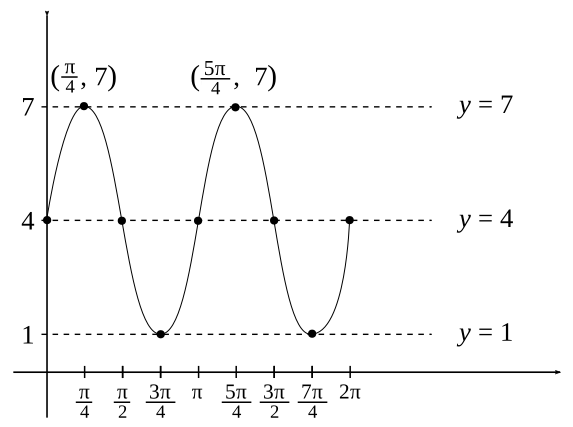
`y = 4 + 3 sin 2x`
`=> text(Amplitude of 3 about)\ \ y = 4`
What is the period of the function `f(x) = tan (3x)?`
A function `f(x)` is defined by `f(x) = 1 + 2 cos x`.
--- 3 WORK AREA LINES (style=lined) ---
--- 7 WORK AREA LINES (style=blank) ---
--- 6 WORK AREA LINES (style=lined) ---
a. `text(Proof)\ \ text{(See Worked Solutions)}`
b.
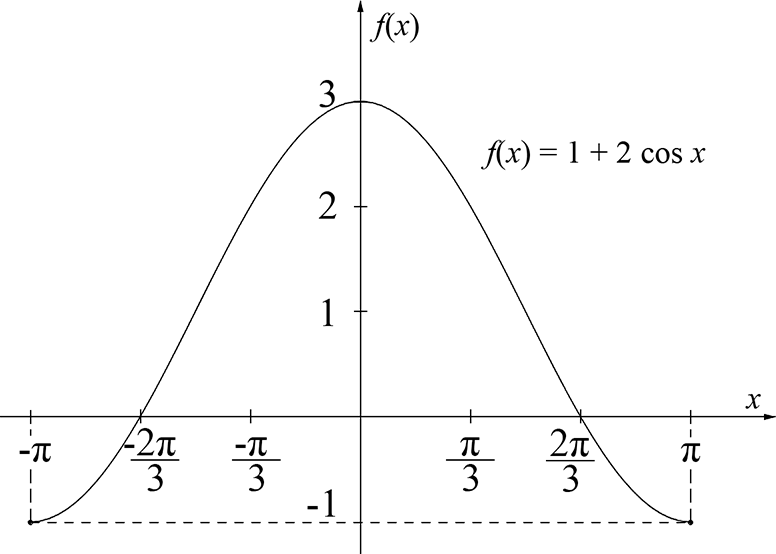
c. `((7 pi)/6 + sqrt 3 + 1)\ text(u²)`
a. `f(x) = 1 + 2 cos x`
`f(x)\ text(cuts the)\ x text(-axis when)\ f(x) = 0`
| `1 + 2 cos x` | `= 0` |
| `2 cos x` | `=-1` |
| `cos x` | `=-1/2` |
`:. x = (2 pi)/3\ …\ text(as required)`
| b. | |
| c. `text(Area)` | `= int_(-pi/2)^((2 pi)/3) 1 + 2 cos x\ \ dx` |
| `= [x + 2 sin x]_(-pi/2)^((2 pi)/3)` | |
| `= [((2 pi)/3 + 2 sin (2 pi)/3)-((-pi)/2 + 2 sin (-pi)/2)]` | |
| `= ((2 pi)/3 + 2 xx sqrt 3/2)-((-pi)/2 +2(- 1))` | |
| `= (2 pi)/3 + sqrt(3) + pi/2 + 2` | |
| `= ((7 pi)/6 + sqrt(3) + 2)\ text(u²)` |
The graph shown is `y = A sin bx`.
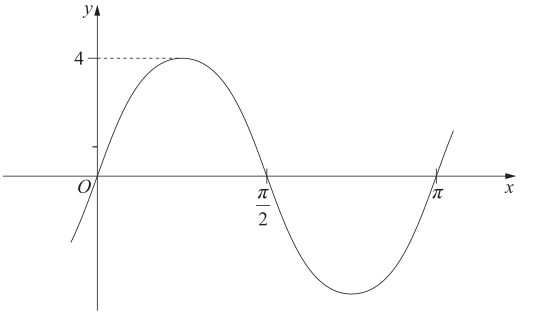
--- 1 WORK AREA LINES (style=lined) ---
--- 3 WORK AREA LINES (style=lined) ---
--- 0 WORK AREA LINES (style=lined) ---
a. `A = 4`
b. `text(S)text(ince the graph passes through)\ \ (pi/4, 4)`
`text(Substituting into)\ \ y = 4 sin bx`
| `4 sin (b xx pi/4)` | `=4` |
| `sin (b xx pi/4)` | `= 1` |
| `b xx pi/4` | `= pi/2` |
| `:. b` | `= 2` |
| c. | 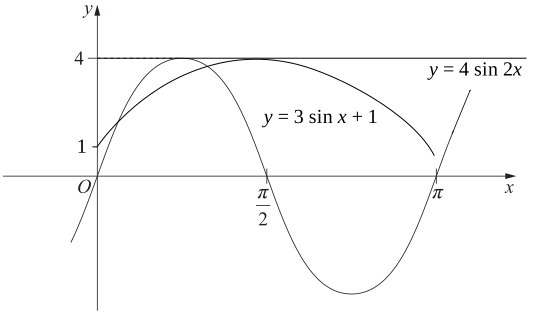 |
Which diagram shows the graph `y=sin(2x + pi/3)`?