In the two weeks leading up to a half marathon, Rogan ran the following distances, in kilometres.
`15, \ 21, \ 17, \ 9, \ 17, \ 25, \ 11`
What was his mean distance, in kilometres? Give your answer correct to 2 decimal places? (2 marks)
Aussie Maths & Science Teachers: Save your time with SmarterEd
In the two weeks leading up to a half marathon, Rogan ran the following distances, in kilometres.
`15, \ 21, \ 17, \ 9, \ 17, \ 25, \ 11`
What was his mean distance, in kilometres? Give your answer correct to 2 decimal places? (2 marks)
The points scored by an AFL team in their first 13 games of the season is recorded.
`78, \ 84, \ 63, \ 75, \ 98, \ 105, \ 92, \ 75, \ 84, \ 96, \ 84, \102, \100`
In the 14th game, they scored 61.
Which of these values would increase?
Jacqui's basketball team has 5 players.
The height of each player is listed below (in cm):
`186, 190, 164, 190, 175`
What is the median height of these players?
This table shows the number of people who visited a war memorial on weekdays over 4 weeks.

--- 1 WORK AREA LINES (style=lined) ---
--- 1 WORK AREA LINES (style=lined) ---
--- 1 WORK AREA LINES (style=lined) ---
--- 1 WORK AREA LINES (style=lined) ---
The mean (average) of four numbers is 26.
One more number is added and the mean number becomes 27.
What is the number that was added? (2 marks)
--- 4 WORK AREA LINES (style=lined) ---
Percy bought 8 packets of cough lollies for $18.00.
The average cost of one packet is
Each number from 1 to 30 is written on a separate card. The 30 cards are shuffled. A game is played where one of these cards is selected at random. Each card is equally likely to be selected.
Ezra is playing the game, and wins if the card selected shows an odd number between 20 and 30.
--- 1 WORK AREA LINES (style=lined) ---
--- 4 WORK AREA LINES (style=lined) ---
In a bag, there are six playing cards, 2, 4, 6, 8, Queen and King. The Queen and King are known as picture cards.
Two of these cards are chosen randomly. All the possible outcomes are shown.

--- 2 WORK AREA LINES (style=lined) ---
--- 2 WORK AREA LINES (style=lined) ---
A survey of which of the following would provide data that are both categorical and
nominal?
The stem-and-leaf plot shows the number of goals scored by a team in each of ten netball games.

What is the mode of this dataset?
Barbara plays a game of chance, in which two unbiased six-sided dice are rolled. The score for the game is obtained by finding the difference between the two numbers rolled. For example, if Barbara rolls a 2 and a 5, the score is 3.
The table shows some of the scores.

--- 3 WORK AREA LINES (style=lined) ---

a.
| b. | `Ptext{(not zero)}` | `= frac{text(numbers) ≠ 0}{text(total numbers)}` |
| `= frac{30}{36}` | ||
| `= frac{5}{6}` |
\(\text{Alternate solution (b)}\)
| b. | `Ptext{(not zero)}` | `= 1 – Ptext{(zero)}` |
| `= 1 – frac{6}{36}` | ||
| `= frac{5}{6}` |
Which histogram best represents a dataset that is positively skewed?
 |
 |
|
 |
 |
The faces on a biased six-sided die are labelled 1, 2, 3, 4, 5 and 6. The die was rolled twenty times. The relative frequency of rolling a 6 was 30% and the relative frequency of rolling a 2 was 15%. The number 3 was the only other number rolled in the twenty rolls.
How many times was the number 3 rolled in the twenty rolls of the die? (3 marks)
--- 4 WORK AREA LINES (style=lined) ---
A roulette wheel has the numbers 0, 1, 2, …, 36 where each of the 37 numbers is equally likely to be spun.

If the wheel is spun 18 500 times, calculate the expected frequency of spinning the number 8. (2 marks)
--- 4 WORK AREA LINES (style=lined) ---
A survey asked the following question for students born in Australia:
"Which State or Territory were you born in?"
How would the responses be classified?
Jeremy rolled a biased 6-sided die a number of times. He recorded the results in a table.
\begin{array} {|l|c|c|c|c|c|c|}
\hline
\rule{0pt}{2.5ex} \text{Number} \rule[-1ex]{0pt}{0pt} & \ \ 1 \ \ & \ \ 2 \ \ & \ \ 3 \ \ & \ \ 4 \ \ & \ \ 5 \ \ & \ \ 6 \ \ \\
\hline
\rule{0pt}{2.5ex} \text{Frequency} \rule[-1ex]{0pt}{0pt} & \ \ 23 \ \ & \ \ 19 \ \ & \ \ 48 \ \ & \ \ 20 \ \ & \ \ 21 \ \ & \ \ 19 \ \ \\
\hline
\end{array}
What is the relative frequency of rolling a 3? (1 mark)
--- 2 WORK AREA LINES (style=lined) ---
During a year, the maximum temperature each day was recorded. The results are shown in the table.

From the days with a maximum temperature less than 25°C, one day is selected at random.
What is the probability, to the nearest percentage, that the selected day occurred during winter?
A set of data is summarised in this frequency distribution table.

Which of the following is true about the data?
An experiment has three distinct outcomes, A, B and C.
Outcome A occurs 50% of the time. Outcome B occurs 23% of the time.
What is the expected number of times outcome C would occur if the experiment is conducted 500 times?
A survey asked the following question.
'How many brothers do you have?'
How would the responses be classified?
The faces on a twenty-sided die are labelled $0.05, $0.10, $0.15, … , $1.00.
The die is rolled once.
What is the probability that the amount showing on the upper face is more than 50 cents but less than 80 cents?
A. `1/4`
B. `3/10`
C. `7/20`
D. `1/2`
In a survey of 200 randomly selected Year 12 students it was found that 180 use social media.
Based on this survey, approximately how many of 75 000 Year 12 students would be expected to use social media?
A. 60 000
B. 67 500
C. 74 980
D. 75 000
Which set of data is classified as categorical and nominal?
The table shows the relative frequency of selecting each of the different coloured jelly beans from packets containing green, yellow, black, red and white jelly beans.
\begin{array} {|c|c|}
\hline
\rule{0pt}{2.5ex} \textit{Colour} \rule[-1ex]{0pt}{0pt} & \textit{Relative frequency} \\
\hline
\rule{0pt}{2.5ex} \text{Green} \rule[-1ex]{0pt}{0pt} & 0.32 \\
\hline
\rule{0pt}{2.5ex} \text{Yellow} \rule[-1ex]{0pt}{0pt} & 0.13 \\
\hline
\rule{0pt}{2.5ex} \text{Black} \rule[-1ex]{0pt}{0pt} & 0.14 \\
\hline
\rule{0pt}{2.5ex} \text{Red} \rule[-1ex]{0pt}{0pt} & \\
\hline
\rule{0pt}{2.5ex} \text{White} \rule[-1ex]{0pt}{0pt} & 0.24 \\
\hline
\end{array}
--- 2 WORK AREA LINES (style=lined) ---
--- 2 WORK AREA LINES (style=lined) ---
On a school report, a student’s record of completing homework is graded using the following codes.
C = consistently
U = usually
S = sometimes
R = rarely
N = never
What type of data is this?

List TWO ways in which this graph is misleading. (2 marks)
--- 4 WORK AREA LINES (style=lined) ---
The sector graph shows the proportion of people, as a percentage, living in each region of Sumcity. There are 24 000 people living in the Eastern Suburbs.

--- 1 WORK AREA LINES (style=lined) ---
Jake used the information above to draw a column graph.

Identify this region and justify your answer. (2 marks)
--- 4 WORK AREA LINES (style=lined) ---
`21\ \ \ 45\ \ \ 29\ \ \ 27\ \ \ 19\ \ \ 35\ \ \ 23\ \ \ 58\ \ \ 34\ \ \ 27` (2 marks)
--- 6 WORK AREA LINES (style=blank) ---
--- 2 WORK AREA LINES (style=lined) ---
--- 2 WORK AREA LINES (style=lined) ---

`:.\ text(Data is positively Skewed.)`
| i. | |
ii. `text(10 scores)`
| `:.\ text(Median)` | `= text{(5th + 6th)}/2` |
| `= (27 + 29)/2` | |
| `= 28` |
iii. `text(The data has a tail that stretches to the right)`
`:.\ text(Data is positively skewed.)`
The diagram shows a spinner.

The arrow is spun and will stop in one of the six sections.
What is the probability that the arrow will stop in a section containing a number greater
than 4?
The mean of a set of 5 scores is 62.
What is the new mean of the set of scores after a score of 14 is added?
Kay randomly selected a marble from a bag of marbles, recorded its colour and returned it to the bag. She repeated this process a number of times.

Based on these results, what is the best estimate of the probability that Kay will choose a green marble on her next selection?
Marcella is planning to roll a standard six-sided die 60 times.
How many times would she expect to roll the number 4?
The probability of an event occurring is `9/10.`
Which statement best describes the probability of this event occurring?
Four radio stations reported the probability of rain as shown in the table.

Which radio station reported the highest probability of rain?
What is the mean of the set of scores?
`3, \ 4, \ 5, \ 6, \ 6, \ 8, \ 8, \ 8, \ 15`
This sector graph shows the distribution of 116 prizes won by three schools: X, Y and Z.

How many prizes were won by School X?
Use the set of scores 1, 3, 3, 3, 4, 5, 7, 7, 12 to answer Questions 6 and 7.
Question 6
What is the range of the set of scores?
Question 7
What are the median and the mode of the set of scores?
Which fraction is equal to a probability of `text(25%)`?
Give an example of an event that has a probability of exactly `3/4`. (1 mark)
--- 2 WORK AREA LINES (style=lined) ---
Consider the following set of scores:
`3, \ 5, \ 5, \ 6, \ 8, \ 8, \ 9, \ 10, \ 10, \ 50.`
--- 1 WORK AREA LINES (style=lined) ---
--- 5 WORK AREA LINES (style=lined) ---
Each student in a class is given a packet of lollies. The teacher records the number of red lollies in each packet using a frequency table.

What is the relative frequency of a packet of lollies containing more than three red lollies?
The graph shows the predicted population age distribution in Australia in 2008.

--- 1 WORK AREA LINES (style=lined) ---
--- 1 WORK AREA LINES (style=lined) ---
--- 4 WORK AREA LINES (style=lined) ---
--- 2 WORK AREA LINES (style=lined) ---
Christina has completed three Mathematics tests. Her mean mark is 72%.
What mark (out of 100) does she have to get in her next test to increase her mean mark to 73%? (2 marks)
--- 5 WORK AREA LINES (style=lined) ---
In a survey, 450 people were asked about their favourite takeaway food. The results are displayed in the bar graph.
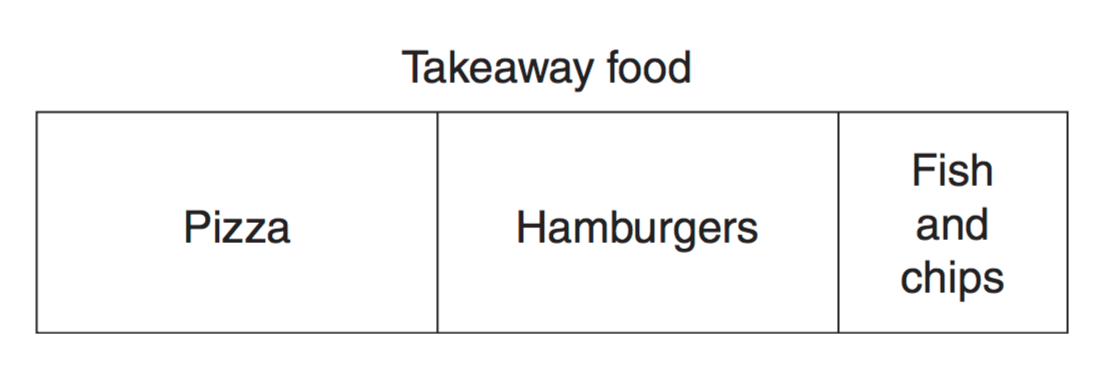
How many people chose pizza as their favourite takeaway food? (2 marks)
A bag contains some marbles. The probability of selecting a blue marble at random from this bag is `3/8`.
Which of the following could describe the marbles that are in the bag?
The height of each student in a class was measured and it was found that the mean height was 160 cm.
Two students were absent. When their heights were included in the data for the class, the mean height did not change.
Which of the following heights are possible for the two absent students?
What is the median of the following set of scores?

The stem-and-leaf plot represents the daily sales of soft drink from a vending machine.
| If the range of sales is 43, what is the value of | ? |

The graph below displays data collected at a school on the number of students
in each Year group, who own a mobile phone.

--- 1 WORK AREA LINES (style=lined) ---
Which student is more likely to own a mobile phone?
Justify your answer with suitable calculations. (2 marks)
--- 4 WORK AREA LINES (style=lined) ---
--- 2 WORK AREA LINES (style=lined) ---
A die was rolled 72 times. The results for this experiment are shown in the table.
\begin{array} {|c|c|}
\hline
\rule{0pt}{2.5ex} \textit{Number obtained} \rule[-1ex]{0pt}{0pt} & \textit{Frequency} \\
\hline
\rule{0pt}{2.5ex} \ 1 \rule[-1ex]{0pt}{0pt} & 16 \\
\hline
\rule{0pt}{2.5ex} \ 2 \rule[-1ex]{0pt}{0pt} & 11 \\
\hline
\rule{0pt}{2.5ex} \ 3 \rule[-1ex]{0pt}{0pt} & \textbf{A} \\
\hline
\rule{0pt}{2.5ex} \ 4 \rule[-1ex]{0pt}{0pt} & 8 \\
\hline
\rule{0pt}{2.5ex} \ 5 \rule[-1ex]{0pt}{0pt} & 12 \\
\hline
\rule{0pt}{2.5ex} \ 6 \rule[-1ex]{0pt}{0pt} & 15 \\
\hline
\end{array}
--- 1 WORK AREA LINES (style=lined) ---
--- 1 WORK AREA LINES (style=lined) ---
--- 1 WORK AREA LINES (style=lined) ---
The heights of the players in a basketball team were recorded as 1.8 m, 1.83 m, 1.84 m, 1.86 m and 1.92 m. When a sixth player joined the team, the average height of the players increased by 1 centimetre.
What was the height of the sixth player?
A data set of nine scores has a median of 7.
The scores 6, 6, 12 and 17 are added to this data set.
What is the median of the data set now?
Jason travels to work by car on all five days of his working week, leaving home at 7 am each day. He compares his travel times using roads without tolls and roads with tolls over a period of 12 working weeks.
He records his travel times (in minutes) in a back-to-back stem-and-leaf plot.

--- 1 WORK AREA LINES (style=lined) ---
--- 1 WORK AREA LINES (style=lined) ---
--- 5 WORK AREA LINES (style=lined) ---
Write down a set of six data values that has a range of 12, a mode of 12 and a minimum value of 12. (2 marks)
On Saturday, Jonty recorded the colour of T-shirts worn by the people at his gym. The results are shown in the graph.

--- 1 WORK AREA LINES (style=lined) ---
--- 2 WORK AREA LINES (style=lined) ---
This back-to-back stem-and-leaf plot displays the test results for a class of 26 students.

What is the median test result for the class?
The diagram below shows a stem-and-leaf plot for 22 scores.

--- 1 WORK AREA LINES (style=lined) ---
--- 1 WORK AREA LINES (style=lined) ---
A wheel has the numbers 1 to 20 on it, as shown in the diagram. Each time the wheel is spun, it stops with the marker on one of the numbers.

The wheel is spun 120 times.
How many times would you expect a number less than 6 to be obtained?
The eye colours of a sample of children were recorded.
When analysing this data, which of the following could be found?
A newspaper states: ‘It will most probably rain tomorrow.’
Which of the following best represents the probability of an event that will most probably occur?