SmarterEd

Aussie Maths & Science Teachers: Save your time with SmarterEd

  • Login
  • Get Help
  • About

Networks, STD2 EQ-Bank 30

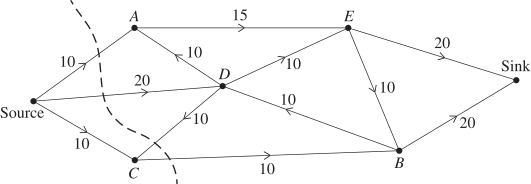
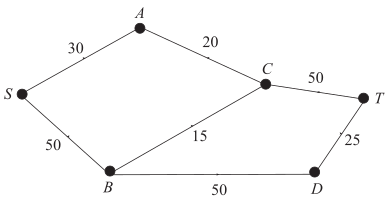
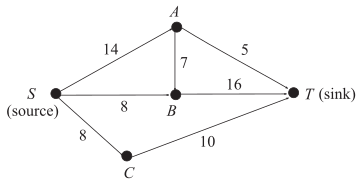
A weighted and directed network diagram is shown.
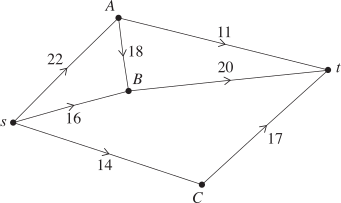
 

  1. What is the outflow from vertex \(C\) ?   (1 mark)

    --- 2 WORK AREA LINES (style=lined) ---

  2. Calculate the maximum flow through the network.   (2 marks)

    --- 5 WORK AREA LINES (style=lined) ---

  3. The capacity of ONE saturated edge is to be increased in order to produce a new network with the maximum possible flow.
  4. State an edge which could have an increased capacity AND find the new maximum flow through this new network.   (2 marks)

    --- 3 WORK AREA LINES (style=lined) ---

Show Answers Only

a.    \(\text{Inflow of \(C\) = Outflow of \(C\) = 14}\)

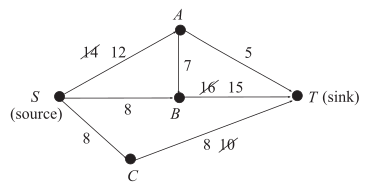
b.    \(\text{Method 1:}\)

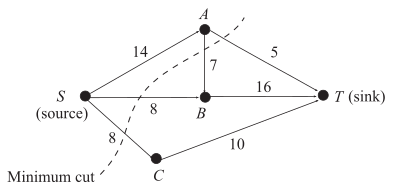
\(\text{Minimum cut through}\ \ sC-Bt-At:\)

\(\text{Maximum flow} = 14+20+11=45\)
 

\(\text{Method 2:}\)
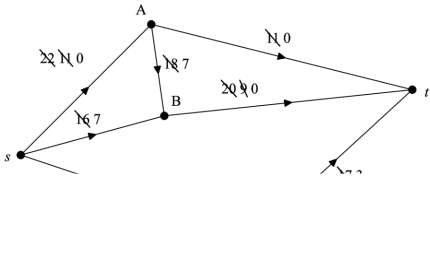


\(sAt\ \ 11\ \text{(leaving an excess flow capacity of } s A=11 \text { )}\)

\(sABt\ \ 11\ \text{(leaving an excess flow capacity of } AB=7 \text { and } B t=9 \text { )}\)

\(sBt\ \ 9\ \text{(leaving an excess flow capacity of } s B=7 \text { )}\)

\(sCt\ \ 14\ \text{(leaving an excess flow capacity of } C t=3)\)

\(\text{Maximum Flow} = 11+11+9+14=45\)
 

c.    \(\text{Answers could include one of the following:}\)

\(\text{B} t \ \text{could be increased (by 7) leading to a maximum flow of 52.}\)

\(\text{A} t \ \text{could be increased (by 11) leading to a maximum flow of 52.}\)
Show Worked Solution

a.    \(\text{Inflow of \(C\) = Outflow of \(C\) = 14}\)

b.    \(\text{Method 1:}\)

\(\text{Minimum cut through}\ \ sC-Bt-At:\)

\(\text{Maximum flow} = 14+20+11=45\)
 

\(\text{Method 2:}\)


\(sAt\ \ 11\ \text{(leaving an excess flow capacity of } s A=11 \text { )}\)

\(sABt\ \ 11\ \text{(leaving an excess flow capacity of } AB=7 \text { and } B t=9 \text { )}\)

\(sBt\ \ 9\ \text{(leaving an excess flow capacity of } s B=7 \text { )}\)

\(sCt\ \ 14\ \text{(leaving an excess flow capacity of } C t=3)\)

\(\text{Maximum Flow} = 11+11+9+14=45\)
 

c.    \(\text{Answers could include one of the following:}\)

\(\text{B} t \ \text{could be increased (by 7) leading to a maximum flow of 52.}\)

\(\text{A} t \ \text{could be increased (by 11) leading to a maximum flow of 52.}\)
Filed Under: Network Flow (Y12) Tagged With: Band 4, Band 5, smc-6915-10-Min Cut/Max Flow, smc-6915-35-Saturated Edges Method, syllabus-2027

Networks, STD2 EQ-Bank 3 MC

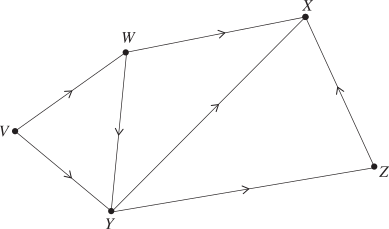
A network of pipes is shown.
 

Which vertex in this network represents the sink?

  1. \(V\)
  2. \(X\)
  3. \(Y\)
  4. \(Z\)
Show Answers Only

\(B\)

Show Worked Solution

\(\text{The sink is the vertex where all flow finishes and no flow leaves.}\)
\(\Rightarrow B\)

Filed Under: Network Flow (Y12) Tagged With: Band 3, smc-6915-40-Other Directed Flows

Networks, STD2 N3 2025 HSC 22

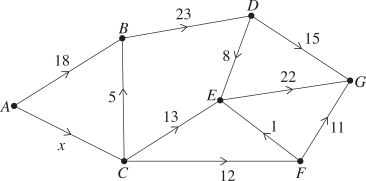
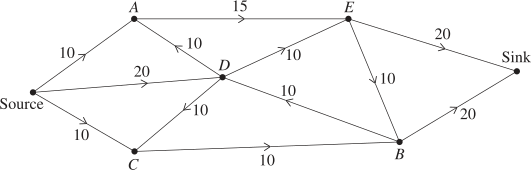
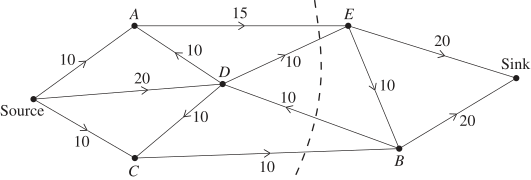
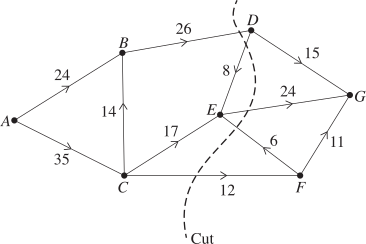
A network of pipes with one cut is shown. The number on each edge gives the capacity of that pipe in L/min.
 

  1. What is the capacity of the cut shown?   (1 mark)

    --- 2 WORK AREA LINES (style=lined) ---

  2. The diagram shows a possible flow for this network of pipes.
     

    1. What is the value of \(x\)? Give a reason for your answer.   (2 marks)

      --- 4 WORK AREA LINES (style=lined) ---

    2. Which of the pipes in the flow are at full capacity?   (1 mark)

      --- 2 WORK AREA LINES (style=lined) ---

    3. The maximum flow for this network is 50 L/min.
    4. Which path of pipes could have an increase in flow of 2 L/min to achieve the maximum flow?   (1 mark)

      --- 2 WORK AREA LINES (style=lined) ---

Show Answers Only

a.    \(\text{Capacity} =62\)

b.i.   \(x=30\) 

b.ii.  \(DE, DG, CF \ \text{and} \ FG\)

b.iii. \(ACEG\)

Show Worked Solution

a.    \(\text{Capacity} =26+24+12=62\)

♦ Mean mark (a) 51%.
b.i.    \(\text{Inflow into} \ C\) \(=\text{Outflow from} \ C\)
  \(x\) \(=5+13+12\)
    \(=30\)


b.ii.  \(DE, DG, CF \ \text{and} \ FG\)

\(\text{Full capacity occurs when a pipe’s capacity (top diagram) equals}\)
\(\text{its flow in the second diagram.}\)
 

b.iii.  \(ACEG\)

\(\text{These pipes are not at full capacity and can increase their flow.}\)

♦ Mean mark (b.i.) 38%.
♦♦♦ Mean mark (b.ii.) 15%.
♦♦♦ Mean mark (b.iii.) 6%.

Filed Under: Flow Networks and Minimum Cuts, Network Flow (Y12) Tagged With: Band 5, Band 6, smc-6915-20-Cut Capacity, smc-6915-30-Flow Capacity, smc-915-20-Cut Capacity, smc-915-30-Flow Capacity

Networks, STD2 N3 2024 NHT 38*

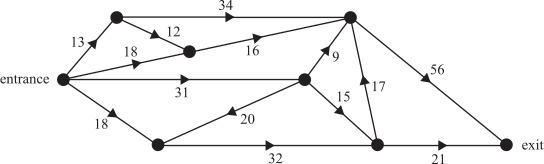
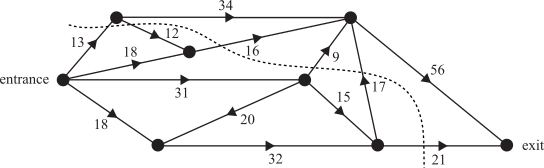
The following directed graph represents the one-way paths between attractions at an historical site. The entrance, exit and attractions are represented by vertices.

The numbers on the edges represent the maximum number of visitors allowed along each path per hour.
 

Determine the maximum number of visitors able to walk from the entrance to the exit each hour?   (3 marks)

--- 5 WORK AREA LINES (style=lined) ---

Show Answers Only

\(\text{Maximum number = 76}\)

Show Worked Solution

\(\text{Max flow = min cut}\)

\(\text{Discounting flows that move from “exit” to “entrance”:}\)

\(\text{Max flow}\ = 13+16+9+17+21 = 76\ \text{visitors}\)

Filed Under: Flow Networks and Minimum Cuts, Network Flow (Y12) Tagged With: Band 5, smc-6915-10-Min Cut/Max Flow, smc-915-10-Min Cut/Max Flow

Networks, STD2 N3 2024 GEN2 14

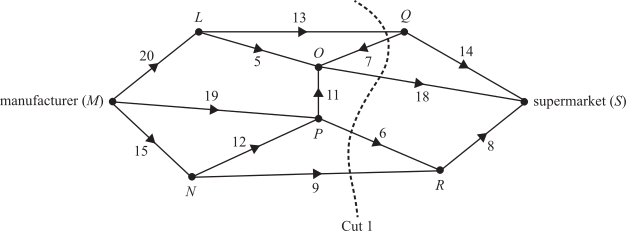
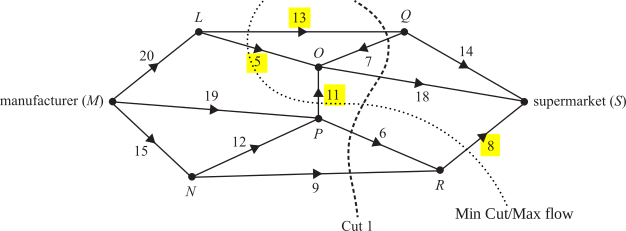
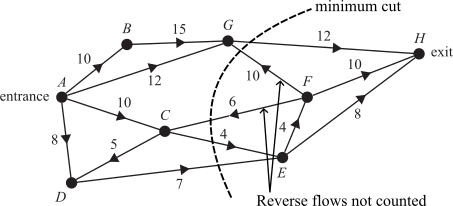
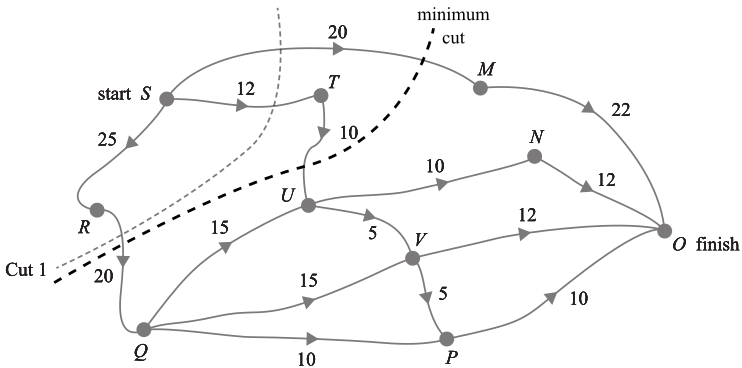
A manufacturer \((M)\) makes deliveries to the supermarket \((S)\) via a number of storage warehouses, \(L, N, O, P, Q\) and \(R\). These eight locations are represented as vertices in the network below.

The numbers on the edges represent the maximum number of deliveries that can be made between these locations each day.
 

  1. When considering the possible flow of deliveries through this network, many different cuts can be made.   
  2. Determine the capacity of Cut 1, shown above.   (1 mark)

    --- 2 WORK AREA LINES (style=lined) ---

  3. Determine the maximum number of deliveries that can be made each day from the manufacturer to the supermarket.   (2 marks)

    --- 3 WORK AREA LINES (style=lined) ---


Show Answers Only

a.    \(46\)

b.    \(37\)

Show Worked Solution

a.    \(13+18+6+9=46\)

\(\text{(Reverse flow}\ Q → O\ \text{is not counted.)}\)
 

b.  

\(\text{Max deliveries (min cut)}\ =13+5+11+8=37\)

♦ Mean mark (b) 29%.

Filed Under: Flow Networks and Minimum Cuts, Network Flow (Y12) Tagged With: Band 3, Band 5, smc-6915-10-Min Cut/Max Flow, smc-6915-20-Cut Capacity, smc-915-10-Min Cut/Max Flow, smc-915-20-Cut Capacity

Networks, STD2 N3 EQ-Bank 32

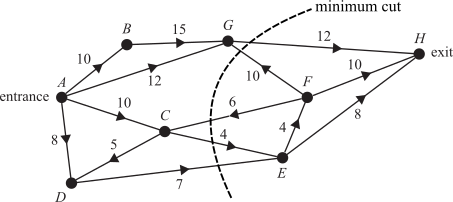
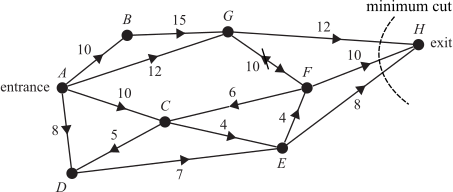
The network below shows the one-way paths between the entrance, \(A\), and the exit, \(H\), of a children's maze.

The vertices represent the intersections of the one-way paths.

The number on each edge is the maximum number of children who are allowed to travel along that path per minute.

The minimum cut of the network is drawn, showing the maximum flow capacity of the maze is 23 children per minute.
 

One path in the maze is to be changed.

Determine the changes in the maximum flow capacity of the network in each of the following changes

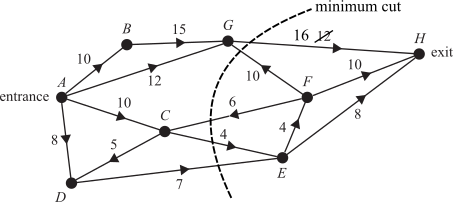
  1. the capacity of flow along the edge \(GH\) is increased to 16.   (1 mark)

    --- 2 WORK AREA LINES (style=lined) ---

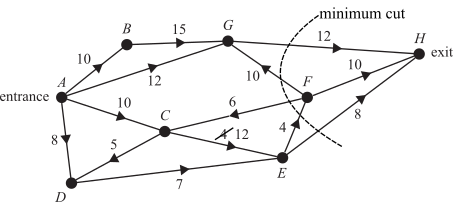
  2. the capacity of flow along the edge \(C E\) is increased to 12.   (2 marks)

    --- 2 WORK AREA LINES (style=lined) ---

  3. the direction of flow along the edge \(G F\) is reversed.   (2 marks)

    --- 2 WORK AREA LINES (style=lined) ---

Show Answers Only

a.    \(GH ↑ 16,\ \text{minimum cut = 27}\)

\(\text{Change: increases by 4}\)

b.    \(CE ↑ 12,\ \text{minimum cut = 24}\)

\(\text{Change: increases by 1}\)

c.    \(GF\ \text{is reversed, minimum cut = 30 (close to exit H)}\)

\(\text{Change: increases by 7}\)

Show Worked Solution

a.    \(GH ↑ 16,\ \text{minimum cut = 27}\)

\(\text{Change: increases by 4}\)
 

b.    \(CE ↑ 12,\ \text{minimum cut = 24}\)

\(\text{Change: increases by 1}\)
 

c.    \(GF\ \text{is reversed, minimum cut = 30 (close to exit H)}\)

\(\text{Change: increases by 7}\)

Filed Under: Flow Networks and Minimum Cuts, Network Flow (Y12) Tagged With: Band 4, Band 5, smc-6915-10-Min Cut/Max Flow, smc-6915-50-Capacity Adjustments, smc-915-10-Min Cut/Max Flow, smc-915-50-Capacity Adjustments

Networks, STD2 N3 EQ-Bank 38

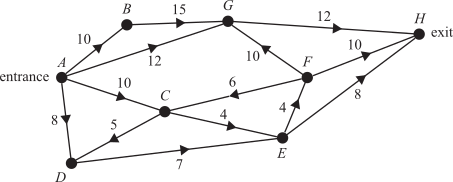
The network below shows the one-way paths between the entrance, \(A\), and the exit, \(H\), of a children's maze.

The vertices represent the intersections of the one-way paths.

The number on each edge is the maximum number of children who are allowed to travel along that path per minute.
 

Cuts on this network are used to consider the possible flow of children through the maze.

Determine the capacity of the minimum cut of this network.   (2 marks)

--- 3 WORK AREA LINES (style=lined) ---

Show Answers Only

\(\text{Minimum cut = 23} \)

Show Worked Solution

\(\text{Minimum cut}\ = 12+4+7 = 23\)

Filed Under: Flow Networks and Minimum Cuts, Network Flow (Y12) Tagged With: Band 5, smc-6915-10-Min Cut/Max Flow, smc-915-10-Min Cut/Max Flow

Networks, STD2 N3 2023 HSC 14 MC

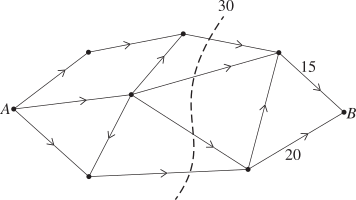
A network with source `A` and sink `B` is shown. The capacities of two paths are labelled. The cut shown on the diagram has a capacity of 30 .
 

Which of the following statements is correct?

  1. The maximum flow is 30.
  2. The maximum flow is 35.
  3. The maximum flow is 30 or less.
  4. The maximum flow is 30 or more.
Show Answers Only

`C`

Show Worked Solution

`text{The cut shows a maximum flow of 30, however there is no information}`

`text{that it is the minimum cut across the network}`

`text{(i.e. it is possible the minimum cut is lower than 30).}`

`=>C`

♦♦ Mean mark 33%.

Filed Under: Flow Networks and Minimum Cuts, Network Flow (Y12) Tagged With: Band 5, smc-6915-10-Min Cut/Max Flow, smc-6915-20-Cut Capacity, smc-915-20-Cut Capacity

Networks, STD2 N3 2022 HSC 31

A wildlife park has 5 main attractions `(A, B, C, D, E)` connected by directional paths. A simple network is drawn to represent the flow through the park's paths. The number of visitors who can access each path at any one time is also shown.


  1. What is the flow capacity of the cut shown?   (1 mark)

    --- 2 WORK AREA LINES (style=lined) ---

  2. By showing a suitable cut on the diagram below, explain why the network's current maximum flow capacity is less than 40 visitors.   (2 marks)
     

    --- 2 WORK AREA LINES (style=lined) ---

  3. One path is to be increased in capacity so that the overall maximum flow will be 40 visitors at any one time.
  4. Which path could be increased and by how much?  (2 marks)

    --- 4 WORK AREA LINES (style=lined) ---

Show Answers Only

a.    `40`

b.

  1. `text{Max flow = min cut = 35}`

c.    `AE\ text{or}\ DE\ text{could be increased by 5}`

Show Worked Solution

a.    `text{Flow capacity = 10 + 20 + 10 = 40}`

`text{(DE is not counted as it runs from sink → source)}`
 

b.  
       

`text{Min Cut = Max Flow}`

`text{Max Flow}` `=15+10+10`
  `=35<40`


♦ Mean mark part (a) 45%.
♦♦ Mean mark part (b) 33%.

c.    `text{Two strategies:}`

  • `AE\ text{could be increased by 5}`
  • `DE\ text{could be increased by 5}`

`text{(both strategies would increase the minimum cut to}`

  `text{40 by increasing the flow to vertex}\ E\ text{to 30)}`


Mean mark (c) 52%.

Filed Under: Flow Networks and Minimum Cuts, Network Flow (Y12) Tagged With: Band 4, Band 5, smc-6915-10-Min Cut/Max Flow, smc-6915-20-Cut Capacity, smc-6915-50-Capacity Adjustments, smc-915-10-Min Cut/Max Flow, smc-915-20-Cut Capacity, smc-915-50-Capacity Adjustments

Networks, STD2 N3 2022 FUR2 4

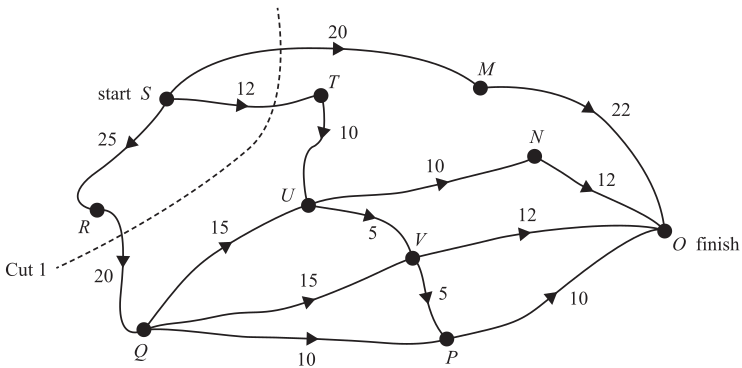
Training program 1 has the cricket team starting from exercise station `S` and running to exercise station `O`.

For safety reasons, the cricket coach has placed a restriction on the maximum number of people who can use the tracks in the fitness park.

The directed graph below shows the capacity of the tracks, in number of people per minute.


  1. Determine the capacity of Cut 1, shown above.   (1 mark)

    --- 1 WORK AREA LINES (style=lined) ---

  2. What is the maximum flow from `S` to `O`, in number of people per minute?   (1 mark)

    --- 2 WORK AREA LINES (style=lined) ---

Show Answers Only

a.    `52`

b.    `50`

Show Worked Solution

a.    `text{Capacity (Cut 1)}= 20 + 12 + 20=52`

b.   `text(Max flow/minimum cut)`

♦♦ Mean mark part (c) 32%.

`= 20 + 10 + 20= 50`
 

Filed Under: Flow Networks and Minimum Cuts, Network Flow (Y12) Tagged With: Band 4, Band 5, smc-6915-10-Min Cut/Max Flow, smc-6915-20-Cut Capacity, smc-915-10-Min Cut/Max Flow, smc-915-20-Cut Capacity

Networks, STD2 N3 2020 HSC 30

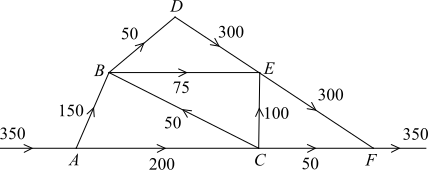
The network diagram shows a series of water channels and ponds in a garden. The vertices `A`, `B`, `C`, `D`, `E`,  and `F` represent six ponds. The edges represent the water channels which connect the ponds. The numbers on the edges indicate the maximum capacity of the channels.


  1. Determine the maximum flow of the network.   (2 marks)

    --- 3 WORK AREA LINES (style=lined) ---

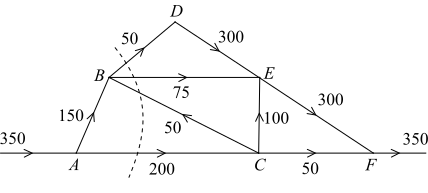
  2. A cut is added to the network, as shown.
     
       
    Is the cut shown a minimum cut? Give a reason for your answer.   (1 mark)

    --- 2 WORK AREA LINES (style=lined) ---

Show Answers Only

a.    `275`

b.    `text{See worked solution}`

Show Worked Solution

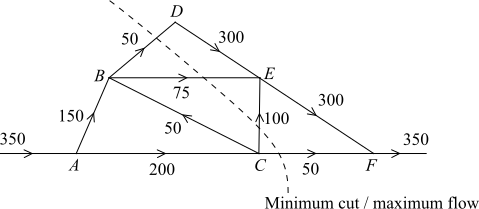
a.    `text(By trial and error, find min cut/max flow:)`

♦ Mean mark (a) 41%.


`text{Maximum Flow}= 50 + 75 + 100 +50=275`

♦♦ Mean mark (b) 28%.
b.     `text{Capacity of the cut}` `= 50 + 75 + 200= 325`

 
`therefore \ text{It is not a minimum cut (the cut in part (a) = 275 < 325)} `

Filed Under: Flow Networks and Minimum Cuts, Network Flow (Y12) Tagged With: Band 5, smc-6915-10-Min Cut/Max Flow, smc-915-10-Min Cut/Max Flow

Networks, STD2 N3 2019 FUR1 3 MC

The flow of water through a series of pipes is shown in the network below

The numbers on the edges show the maximum flow through each pipe in litres per minute.


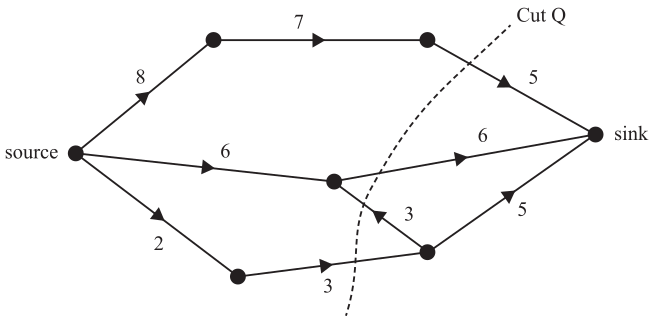
The capacity of Cut `Q`, in litres per minute, is

  1. 11
  2. 13
  3. 14
  4. 17
Show Answers Only

`C`

Show Worked Solution

`text(Capacity of cut)\ Q= 5 + 6 + 3= 14`

`=>  C`

Filed Under: Flow Networks and Minimum Cuts, Network Flow (Y12) Tagged With: Band 4, smc-6915-20-Cut Capacity, smc-915-20-Cut Capacity

Networks, STD2 N3 2019 HSC 40

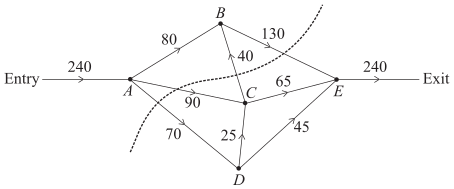
A museum is planning an exhibition using five rooms.

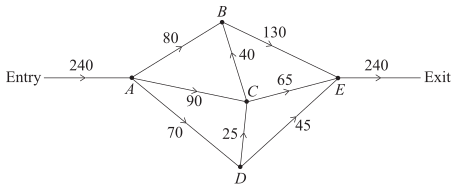
The museum manager draws a network to help plan the exhibition. The vertices `A`, `B`, `C`, `D` and `E` represent the five rooms. The number on the edges represent the maximum number of people per hour who can pass through the security checkpoints between the rooms.


  1. What is the capacity of the cut shown?   (1 mark)

    --- 2 WORK AREA LINES (style=lined) ---

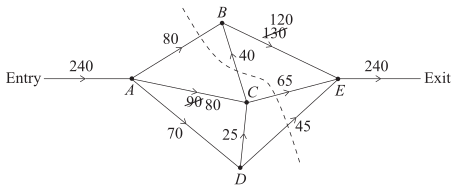
  2. The museum manager is planning for a maximum of 240 visitors to pass through the exhibition each hour. By using the 'minimum cut-maximum flow' theorem, the manager determines that the plan does not provide sufficient flow capacity.


    Draw the minimum cut onto the network below and recommend a change that the manager could make to one or more security checkpoints to increase the flow capacity to 240 visitors per hour.   (2 marks)


    --- 2 WORK AREA LINES (style=lined) ---

Show Answers Only

a.    `290`

b.  

Show Worked Solution
a.     `text(Capacity)` `= 130 + 90 + 70`
    `= 290`

♦♦ Mean mark (a) 32%.
COMMENT: In part (a), edge BC flows from the exit to the entry and is therefore not counted.

b.    `text(Maximum flow capacity:)`


`text(Minimum cut = 80 + 40 + 65 + 45 = 230)`

♦♦♦ Mean mark (b) 19%.
COMMENT: In part (b), edge BC now flows from entry to exit in the new “minimum” cut and is counted.

`text(If security is improved to increase the flow)`

`text(between Room C and Room B by 10 visitors)`

`text(per hour, the network’s flow capacity increases)`

`text(to 240.)`

Filed Under: Flow Networks and Minimum Cuts, Network Flow (Y12) Tagged With: Band 5, Band 6, smc-6915-10-Min Cut/Max Flow, smc-6915-20-Cut Capacity, smc-6915-50-Capacity Adjustments, smc-915-10-Min Cut/Max Flow, smc-915-20-Cut Capacity, smc-915-50-Capacity Adjustments

Networks, STD2 N3 EQ-Bank 31

An oil pipeline network is drawn below that shows the flow capacity of oil pipelines in kilolitres per hour.


A cut is shown.

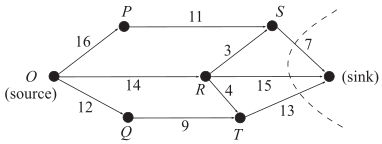
  1. What is the capacity of the cut.   (1 mark)

    --- 1 WORK AREA LINES (style=lined) ---

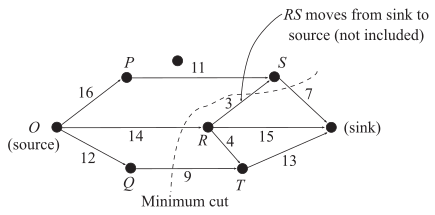
  2. Calculate the minimum cut of this network?   (2 marks)

    --- 3 WORK AREA LINES (style=lined) ---

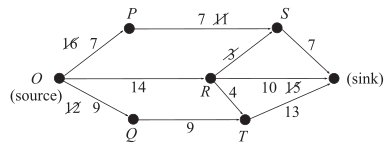
  3. Copy the network diagram, showing the maximum flow capacity of the network by labelling the flow of each edge.   (2 marks)

    --- 8 WORK AREA LINES (style=lined) ---

Show Answers Only

a.    `35`

b.    `text(See Worked Solutions)`

c.    

Show Worked Solution

a.    `text(Capacity of cut)= 7 + 15 + 13= 35\ text(kL/h)`
  

b. 

♦♦ COMMENT: Be very careful! RS is not included as it goes from sink to source.
 

`text(Minimum cut)= 7 + 14 + 9= 30\ text(kL/h)`


c.    

Filed Under: Flow Networks and Minimum Cuts, Network Flow (Y12) Tagged With: Band 3, Band 5, smc-6915-10-Min Cut/Max Flow, smc-6915-20-Cut Capacity, smc-6915-30-Flow Capacity, smc-915-10-Min Cut/Max Flow, smc-915-20-Cut Capacity, smc-915-30-Flow Capacity

Networks, STD2 N3 EQ-Bank 5 MC

The network diagram below flows from the source \((S)\) to sink \((T)\).

Which of the edges is not at maximum capacity?


  1. \(AC\)
  2. \(BC\)
  3. \(CT\)
  4. \(DT\)
Show Answers Only

\(C\)

Show Worked Solution

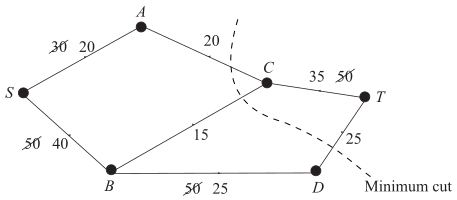
\(\text{Consider the minimum cut line: all edges are saturated.}\)


\(\text{Edge \(CT\) is not at maximum capacity.}\)

\(\Rightarrow C\)

Filed Under: Flow Networks and Minimum Cuts, Network Flow (Y12) Tagged With: Band 4, smc-6915-30-Flow Capacity, smc-6915-35-Saturated Edges Method, smc-915-30-Flow Capacity

Networks, STD2 N3 EQ-Bank 26

A network diagram is drawn below.

  1. Calculate the maximum flow through this network.   (2 marks)

    --- 2 WORK AREA LINES (style=lined) ---

  2. Copy the network above and illustrate the maximum flow capacity.   (2 marks)

    --- 7 WORK AREA LINES (style=lined) ---

Show Answers Only

a.    `28`

b.

Show Worked Solution
a.    


`text(Maximum flow)` `=\ text(minimum cut)`
  `= 8 + 8 + 7 + 5= 28`


b.    

Filed Under: Flow Networks and Minimum Cuts, Network Flow (Y12) Tagged With: Band 4, smc-6915-10-Min Cut/Max Flow, smc-6915-30-Flow Capacity, smc-915-10-Min Cut/Max Flow, smc-915-30-Flow Capacity

Networks, STD2 N3 2018 FUR2 1

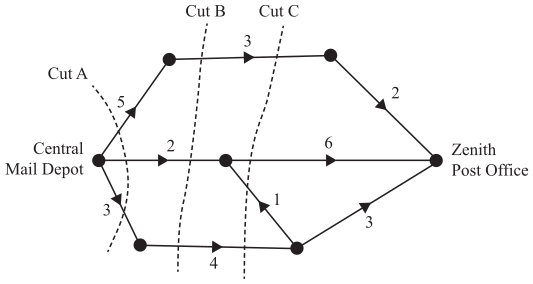
The graph below shows the possible number of postal deliveries each day between the Central Mail Depot and the Zenith Post Office.

The unmarked vertices represent other depots in the region.

The weighting of each edge represents the maximum number of deliveries that can be made each day.


  1.  Cut A, shown on the graph, has a capacity of 10.


     Two other cuts are labelled as Cut B and Cut C.

    1.  Write down the capacity of Cut B.   (1 mark)

      --- 1 WORK AREA LINES (style=lined) ---

    2.  Write down the capacity of Cut C.   (1 mark)

      --- 1 WORK AREA LINES (style=lined) ---

  2.  Determine the maximum number of deliveries that can be made each day from the Central Mail Depot to the Zenith Post Office.   (1 mark)

    --- 2 WORK AREA LINES (style=lined) ---

Show Answers Only
a.     i.    `9`
  ii.   `13`
b. `7`
Show Worked Solution
a.     i.    `text{Capacity (Cut B)}= 3 + 2 + 4=9`
  ii.   `text{Capacity (Cut C)}= 3 + 6 + 4=13`

♦ Mean mark part (b) 32%.

COMMENT: Review carefully! Most common incorrect answer was 9.

b.  `text(Minimum cut) = 2 + 2 + 3 = 7`

`:.\ text(Maximum deliveries) = 7`

Filed Under: Flow Networks and Minimum Cuts, Network Flow (Y12) Tagged With: Band 3, Band 5, smc-6915-10-Min Cut/Max Flow, smc-6915-20-Cut Capacity, smc-915-10-Min Cut/Max Flow, smc-915-20-Cut Capacity

Networks, STD2 N3 EQ-Bank 27

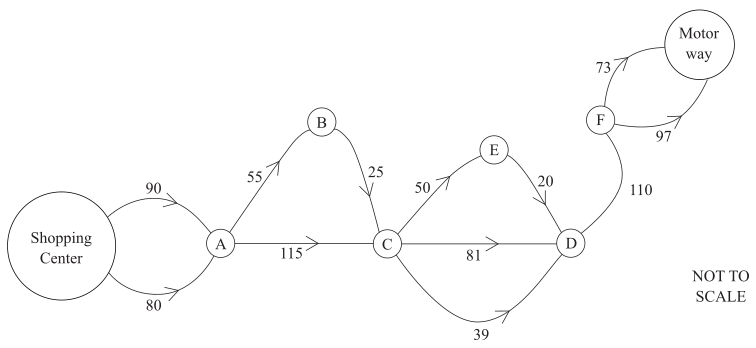
The network diagram represents a system of roads connecting a shopping centre to the motorway.

Two routes from the shopping centre connect to A and one route connects D to F.

The number on the edge of each road indicates the number of vehicles that can travel on it per hour.


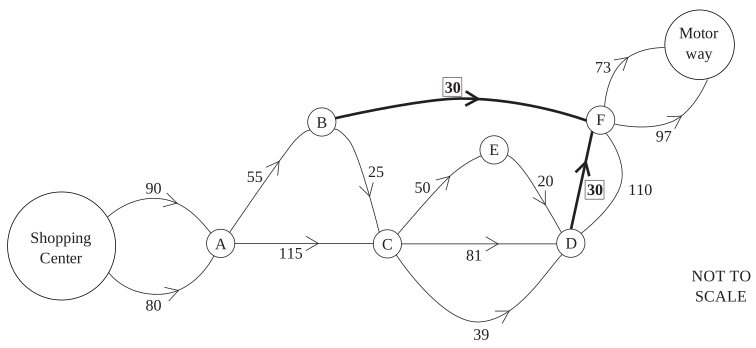
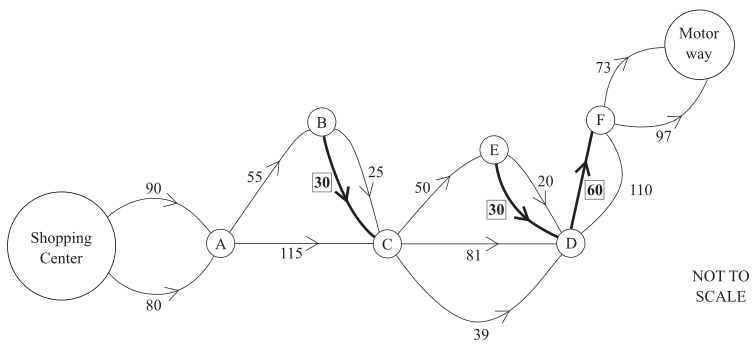
Draw additional road(s) on the diagram to maximise the capacity. Include the number of vehicles that can travel on each road.   (2 marks)

--- 0 WORK AREA LINES (style=lined) ---

Show Answers Only

`text(Solutions could be:)`

Show Worked Solution

`text(Two possible solutions are:)`

`text(Note that the added roads above make the minimum cut/max)`

`text(flow increase to 170 vehicles per hour.)`

Filed Under: Flow Networks and Minimum Cuts, Network Flow (Y12) Tagged With: Band 4, smc-6915-50-Capacity Adjustments, smc-915-50-Capacity Adjustments

Networks, STD2 N3 EQ-Bank 7 MC

The network diagram represents a system of roads connecting a shopping centre to the motorway.

Two routes from the shopping centre connect to A and one route connects to D to F.

The number on the edge of each road indicates the number of vehicles that can travel on it per hour.

At present, the capacity of the network from the shopping centre to the motorway is not maximised.

Which additional road(s) would increase the network capacity to its maximum?

  1. A road from A to F with a capacity of 20 vehicles per hour
  2. A road from B to E with a capacity of 30 vehicles per hour
  3. A road from C to F with a capacity of 30 vehicles per hour and a road from E to F with a capacity of 60 vehicles per hour
  4. A road from B to F with a capacity of 30 vehicles per hour and a road from D to F with a capacity of 30 vehicles per hour
Show Answers Only

`D`

Show Worked Solution

`text(Consider option D:)`

`text(Adding these two roads increases the minimum cut/maximum)`

`text(flow to 170 vehicles per hour throughout the network.)`

`=>D`

Filed Under: Flow Networks and Minimum Cuts, Network Flow (Y12) Tagged With: Band 4, smc-6915-50-Capacity Adjustments, smc-915-50-Capacity Adjustments

Networks, STD2 N3 2009 FUR1 3 MC

networks-fur1-2009-vcaa-3-mc1

  
The maximum flow from source to sink through the network shown above is

  1. 6
  2. 7
  3. 11
  4. 16
Show Answers Only

`B`

Show Worked Solution

networks-fur1-2009-vcaa-3-mc-answer 
 

♦ Mean mark 44%.
`text(Maximum flow)` `=\ text(minimum cut)`
  `= 1 + 4 + 2= 7`

`=>  B`

Filed Under: Flow Networks and Minimum Cuts, Network Flow (Y12) Tagged With: Band 5, smc-6915-10-Min Cut/Max Flow, smc-915-10-Min Cut/Max Flow

Networks, STD2 N3 2008 FUR1 6 MC

networks-fur1-2008-vcaa-6-mc

 
For the graph above, the capacity of the cut shown is

  1. 36
  2. 30
  3. 42
  4. 46
Show Answers Only

`C`

Show Worked Solution

`text(Ignoring any flows that cross the cut from the)`

♦♦ Mean mark 35%.
MARKER’S COMMENT: For an individual flow to contribute to the “cut”, it must flow from the source to the sink.

`text(sink side to the source side.)`
 

`text(Capacity of the cut)`

`= 4 + 2 + 7 + 9 + 8 + 6 + 6= 42`

`=> C`

Filed Under: Flow Networks and Minimum Cuts, Network Flow (Y12) Tagged With: Band 5, smc-6915-20-Cut Capacity, smc-915-20-Cut Capacity

Networks, STD2 N3 EQ-Bank 36

In the network below, the values on the edges give the maximum flow possible between each pair of vertices. The arrows show the direction of flow. A cut that separates the source from the sink in the network is also shown.
 

vcaa-networks-fur1-2010-6-7


  1. Calculate the capacity of the cut shown in the diagram.   (1 mark)

    --- 1 WORK AREA LINES (style=lined) ---

  2. Calculate the maximum flow between source and sink.   (2 marks)

    --- 4 WORK AREA LINES (style=lined) ---

Show Answers Only

a.    `23`

b.    `10`

Show Worked Solution

a.    `text(Capacity of the cut)`

♦ Mean mark part (a) 50%.
COMMENT: A quarter of students incorrectly included the “8” which is flowing in the opposite direction.

`= 11 + 5 + 7= 23`


b.

vcaa-networks-fur1-2010-6-7i

`text(The maximum flow)`

♦♦ Mean mark part (b) 24%.

`=\ text{minimum cut (see above)}`

`= 4 + 2 + 3 + 1 = 10`

Filed Under: Flow Networks and Minimum Cuts, Network Flow (Y12) Tagged With: Band 5, smc-6915-10-Min Cut/Max Flow, smc-6915-20-Cut Capacity, smc-915-10-Min Cut/Max Flow, smc-915-20-Cut Capacity

Networks, STD2 N3 EQ-Bank 23

The following directed graph shows the flow of water, in litres per minute, in a system of pipes connecting the source to the sink.


Calculate the maximum flow, in litres per minute, from the source to the sink.  (2 marks)

Show Answers Only

`18\ \ text(litres/minute)`

Show Worked Solution
`text(Maximum Flow)` `=\ text(Capacity of Minimum Cut)`
  `= 2 + 10 + 6= 18\ \ text(litres/minute)`

Filed Under: Flow Networks and Minimum Cuts, Network Flow (Y12) Tagged With: Band 4, smc-6915-10-Min Cut/Max Flow, smc-915-10-Min Cut/Max Flow

Networks, STD2 N3 EQ-Bank 21

The arrows on the diagram below show the direction of the flow of waste through a series of pipelines from a factory to a waste dump.

The numbers along the edges show the number of megalitres of waste per week that can flow through each section of pipeline.
 

NETWORKS, FUR1 2015 VCAA 4 MC

 
The minimum cut is shown as a dotted line.

Calculate the capacity of this cut, in megalitres of waste per week.  (2 marks)

Show Answers Only

`26`

Show Worked Solution

`text(Flows from the waste dump side of the minimum cut to)`

`text(the factory side are ignored.)`
 

`:.\ text{Minimum Cut}`

`= 5 + 2 + 12 + 7= 26\ \ text(ML/week)`

Filed Under: Flow Networks and Minimum Cuts, Network Flow (Y12) Tagged With: Band 4, smc-6915-10-Min Cut/Max Flow, smc-6915-20-Cut Capacity, smc-915-10-Min Cut/Max Flow

Networks, STD2 N3 2012 FUR1 6 MC

networks-fur1-2012-vcaa-6-mc

 
In the directed network diagram above, all vertices are reachable from every other vertex.

All vertices would still be reachable from every other vertex if we remove the edge in the direction from

  1. `Q` to `U`
  2. `R` to `S`
  3. `S` to `T`
  4. `T` to `R`
Show Answers Only

`A`

Show Worked Solution

`text(Consider option B:)`

`text(If R to S is removed, vertex S cannot be reached from other)`

`text(vertices. All vertices only remain reachable from all other vertices)`

`text(if Q to U is removed.)`

`=>A`

Filed Under: Flow Networks and Minimum Cuts, Network Flow (Y12) Tagged With: Band 4, smc-6915-40-Other Directed Flows, smc-915-40-Other Directed Flows

Networks, STD2 N3 2006 FUR1 6 MC

networks-fur1-2006-vcaa-6-mc

 
In the directed graph above the weight of each edge is non-zero.

The capacity of the cut shown is

  1. \(a + b + c + d + e\)
  2. \(a + c + d + e\)
  3. \(a + b + c + e\)
  4. \(a + b + c-d + e\)
Show Answers Only

\(C\)

Show Worked Solution

\(\text{Flows from sink to source are not counted when calculating}\)

\(\text{the capacity of a cut.}\)

\(\therefore\ \text{Capacity of the cut} = a + b + c + e\)

\(\Rightarrow C\)

Filed Under: Flow Networks and Minimum Cuts, Network Flow (Y12) Tagged With: Band 4, smc-6915-20-Cut Capacity, smc-915-20-Cut Capacity

Networks, STD2 N3 2014 FUR1 2 MC

In the directed graph above, the only vertex with a label that can be reached from vertex Y is

  1. vertex A
  2. vertex B
  3. vertex C
  4. vertex D
Show Answers Only

\(D\)

Show Worked Solution

\(\text{Following the directed edges out of }Y\text{, the only}\)

\(\text{labelled vertex that can be reached is }D.\)

\(\Rightarrow D\)

Filed Under: Flow Networks and Minimum Cuts, Network Flow (Y12) Tagged With: Band 3, smc-6915-40-Other Directed Flows, smc-915-40-Other Directed Flows

Networks, STD2 N3 2013 FUR1 9 MC

Alana, Ben, Ebony, Daniel and Caleb are friends. Each friend has a different age.

The arrows in the graph below show the relative ages of some, but not all, of the friends. For example, the arrow in the graph from Alana to Caleb shows that Alana is older than Caleb.


Using the information in the graph, it can be deduced that the second-oldest person in this group of friends is

  1. Alana
  2. Ben
  3. Caleb
  4. Ebony
Show Answers Only

`B`

Show Worked Solution

`text(Completing the graph, we can deduce that Alana)`

`text(must be older than Daniel, etc…)`
 

vcaa-networks-fur1-2013-9i

 
`:.\ text(Oldest to youngest is:)`

`text(Alana, Ben, Daniel, Caleb, Ebony.)`

`=>  B`

Filed Under: Flow Networks and Minimum Cuts, Network Flow (Y12) Tagged With: Band 4, smc-6915-40-Other Directed Flows, smc-915-40-Other Directed Flows

Networks, STD2 N3 2006 FUR1 2 MC

The following directed graph represents a series of one-way streets with intersections numbered as nodes 1 to 8.
 

networks-fur1-2006-vcaa-2-mc-1

 
All intersections can be reached from

  1. intersection 4
  2. intersection 5
  3. intersection 6
  4. intersection 8 
Show Answers Only

`B`

Show Worked Solution

`text(The two edges connected to vertex 5 both flow away from the)`

`text(vertex. Therefore, vertex 5 cannot be reached in this network)`

`text(starting from any other vertex, eliminating options A, C and D.)` 

`=> B`

Filed Under: Flow Networks and Minimum Cuts, Network Flow (Y12) Tagged With: Band 3, smc-6915-40-Other Directed Flows, smc-915-40-Other Directed Flows

Networks, STD2 N3 2008 FUR1 1 MC

Steel water pipes connect five points underground.

The directed graph below shows the directions of the flow of water through these pipes between these points. 
 

networks-fur1-2008-vcaa-1-mc

 
The directed graph shows that water can flow from

  1. point 1 to point 2.
  2. point 1 to point 4.
  3. point 4 to point 1.
  4. point 4 to point 2.
Show Answers Only

\(C\)

Show Worked Solution

\(\text{Tracing the arrows, water can flow from point 4 to point 1.}\)

\(\text{Options A, B and D each run against an arrow.}\)

\(\Rightarrow C\)

Filed Under: Flow Networks and Minimum Cuts, Network Flow (Y12) Tagged With: Band 2, smc-6915-40-Other Directed Flows, smc-915-40-Other Directed Flows

Networks, STD2 N3 2009 FUR2 2

One of the landmarks in a city is a hedge maze. The maze contains eight statues. The statues are labelled `F` to `M` on the following directed graph. Walkers within the maze are only allowed to move in the directions of the arrows.
 

NETWORKS, FUR2 2009 VCAA 2
 

  1. Write down the two statues that a walker could not reach from statue `M`.   (1 mark)

    --- 1 WORK AREA LINES (style=lined) ---

  2. One way that statue `H` can be reached from statue `K` is along path `KFH`.


    List the three other ways that statue `H` can be reached from statue `K`.   (1 mark)

    --- 1 WORK AREA LINES (style=lined) ---

Show Answers Only

a.    `F and K`

b.    `KJH, KMJH, KFJH`

Show Worked Solution

a.    `F and K`

b.    `KJH, KMJH, KFJH`

Filed Under: Flow Networks and Minimum Cuts, Network Flow (Y12) Tagged With: Band 3, smc-6915-40-Other Directed Flows, smc-915-40-Other Directed Flows

Copyright © 2014–2026 SmarterEd.com.au · Log in