SmarterEd

Aussie Maths & Science Teachers: Save your time with SmarterEd

  • Login
  • Get Help
  • About

NETWORKS, FUR2 2013 VCAA 2

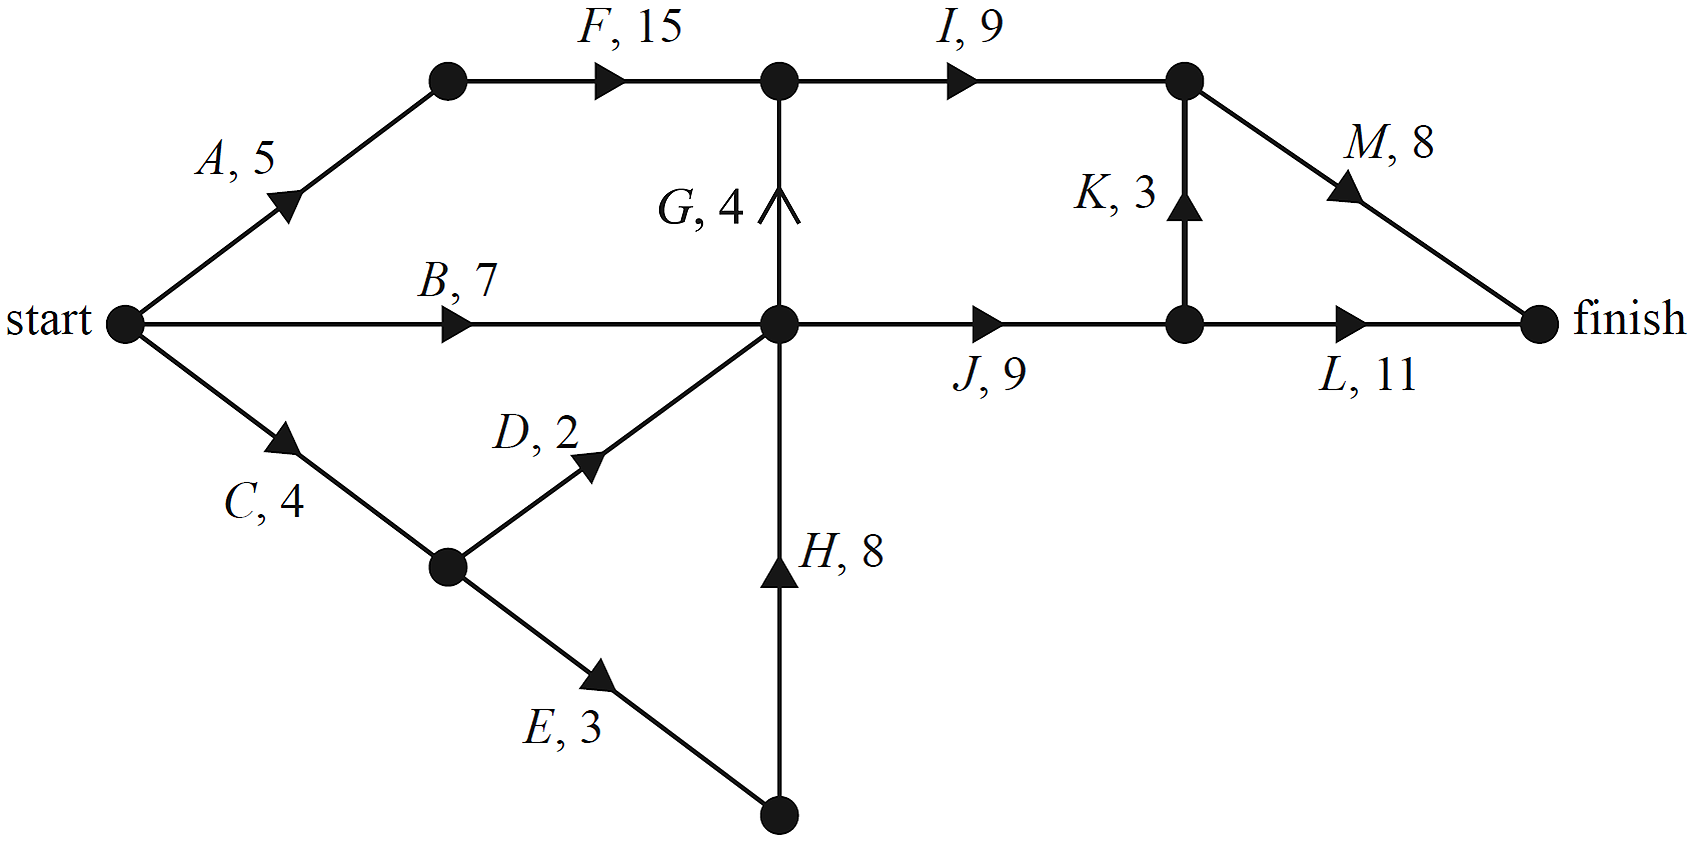
A project will be undertaken in the wildlife park. This project involves the 13 activities shown in the table below. The duration, in hours, and predecessor(s) of each activity are also included in the table.
 
NETWORKS, FUR2 2013 VCAA 21


Activity `G` is missing from the network diagram for this project, which is shown below.

 
NETWORKS, FUR2 2013 VCAA 22


  1. Complete the network diagram above by inserting activity `G`.   (1 mark)

    --- 0 WORK AREA LINES (style=lined) ---

  2. Determine the earliest starting time of activity `H`.   (1 mark)

    --- 1 WORK AREA LINES (style=lined) ---

  3. Given that activity `G` is not on the critical path:
    i.
    Write down the activities that are on the critical path in the order that they are completed.   (1 mark)

    --- 1 WORK AREA LINES (style=lined) ---

  4. ii. Find the latest starting time for activity `D`.   (1 mark)

    --- 5 WORK AREA LINES (style=lined) ---

  5. Consider the following statement.
     
    ‘If just one of the activities in this project is crashed by one hour, then the minimum time to complete the entire project will be reduced by one hour.’

    Explain the circumstances under which this statement will be true for this project.   (1 mark)

    --- 2 WORK AREA LINES (style=lined) ---

  6. Assume activity `F` is crashed by two hours.

    What will be the minimum completion time for the project?   (1 mark) 

    --- 3 WORK AREA LINES (style=lined) ---

Show Answers Only
  1.  
    networks-fur2-2013-vcaa-2-answer
  2. `7\ text(hours)`
  3. i. `A-F-I-M`
    ii. `14\ text(hours)`
  4. `text(The statement will only be true if the crashed activity)`
    `text(is on the critical path)\ \ A-F-I-M.`
  5. `text(36 hours)`
Show Worked Solution
a.    networks-fur2-2013-vcaa-2-answer


b.    `text(EST of)\ H` `= 4 + 3`
    `= 7\ text(hours)`


c.i.   `A-F-I-M`

♦♦ Mean mark of parts (c)-(e) (combined) was 40%.


c.ii.  networks-fur2-2013-vcaa-23-answer

`G\ text(precedes)\ I`

`:. text(LST of)\ G = 20-4 = 16\ text(hours)`

`:. text(LST of)\ D = 16-2 = 14\ text(hours)`

  
d.  
`text(The statement will only be true if the crashed activity)`

MARKER’S COMMENT: Most students struggled with part (d).

`text(is on the critical path)\ \ A-F-I-M.`
  

e.   `A-F-I-M\ text(is 37 hours.)`

`text(If)\ F\ text(is crashed by 2 hours, the new)`

`text(new critical path is)`

`C-E-H-G-I-M\ text{(36 hours)}`

`:.\ text(Minimum completion time = 36 hours)`

Filed Under: Critical Path Analysis Tagged With: Band 3, Band 4, Band 5, smc-621-10-Network table, smc-621-30-Float time/LST, smc-621-40-Crashing/Reduce completion time

NETWORKS, FUR2 2008 VCAA 1

James, Dante, Tahlia and Chanel are four children playing a game.

In this children’s game, seven posts are placed in the ground.

The network below shows distances, in metres, between the seven posts.

The aim of the game is to connect the posts with ribbon using the shortest length of ribbon.

This will be a minimal spanning tree.


NETWORKS, FUR2 2008 VCAA 11
 

  1. Draw in a minimal spanning tree for this network on the diagram below.   (1 mark)

    --- 0 WORK AREA LINES (style=lined) ---


NETWORKS, FUR2 2008 VCAA 12

  1. Determine the length, in metres, of this minimal spanning tree.   (1 mark)

    --- 2 WORK AREA LINES (style=lined) ---

  2. How many different minimal spanning trees can be drawn for this network?   (1 mark)

    --- 1 WORK AREA LINES (style=lined) ---

Show Answers Only
  1.  
    networks-fur2-2008-vcaa-1-answer1
    `text(or)`
    networks-fur2-2008-vcaa-1-answer2
  2. `16\ text(metres)`
  3. `2`
Show Worked Solution
a.    networks-fur2-2008-vcaa-1-answer1

`text(or)`

networks-fur2-2008-vcaa-1-answer2


b.   `text(Length of minimal spanning tree)`

`= 4 + 2 + 2 + 3 + 2 + 3`

`= 16\ text(metres)`
 

c.   `2`

Filed Under: Minimum Spanning Trees and Shortest Paths Tagged With: Band 3, Band 4, smc-624-10-Distance

NETWORKS, FUR2 2009 VCAA 3

The city of Robville contains eight landmarks denoted as vertices `N` to `U` on the network diagram below. The edges on this network represent the roads that link the eight landmarks.


  1. Write down the degree of vertex `U`.  (1 mark)

    --- 1 WORK AREA LINES (style=lined) ---

  2. Steven wants to visit each landmark, but drive along each road only once. He will begin his journey at landmark `N`.
    1. Michael was the best player in 2014 and he considered purchasing cricket equipment that was valued at $750.
    2. At which landmark must he finish his journey?   (1 mark)

      --- 1 WORK AREA LINES (style=lined) ---

    3. Regardless of which route Steven decides to take, how many of the landmarks (including those at the start and finish) will he see on exactly two occasions?   (1 mark)

      --- 1 WORK AREA LINES (style=lined) ---

  3. Cathy decides to visit each landmark only once.
    1. Suppose she starts at `S`, then visits `R` and finishes at `T`.
    2. Write down the order Cathy will visit the landmarks.   (1 mark)

      --- 2 WORK AREA LINES (style=lined) ---

    3. Suppose Cathy starts at `S`, then visits `R` but does not finish at `T`.
    4. List three different ways that she can visit the landmarks.   (1 mark)

      --- 2 WORK AREA LINES (style=lined) ---

Show Answers Only

  1. `4`
    1. `P\ text{(the other odd degree vertex)}`
    2. `5`
    1. `(SR)QPONU(T)`
    2. `text(Other paths are)`
      `(SR)QPUTNO`
      `(SR)QPONTU`
      `(SR)TUNOPQ`
      `(SR)UTNOPQ`
      `text{(only 3 paths required)}`

Show Worked Solution

a.   `4`

b.i.   `P\ text{(the other odd degree vertex)}`

b.ii.   `5 (N, T, R, P, U)`

c.i.   `(SR)QPONU(T)`

c.ii.   `text(Other paths are)`

`(SR)QPUTNO`

`(SR)QPONTU`

`(SR)TUNOPQ`

`(SR)UTNOPQ`

`text{(only 3 paths required)}`

Filed Under: Travelling Problems and Adjacency Matrices Tagged With: Band 2, Band 3, Band 4, smc-622-10-Euler, smc-622-20-Hamiltonian

NETWORKS, FUR2 2009 VCAA 2

One of the landmarks in the city is a hedge maze. The maze contains eight statues. The statues are labelled `F` to `M` on the following directed graph. Walkers within the maze are only allowed to move in the directions of the arrows.
 

NETWORKS, FUR2 2009 VCAA 2
 

  1. Write down the two statues that a walker could not reach from statue `M`.   (1 mark)

    --- 1 WORK AREA LINES (style=lined) ---

  2. One way that statue `H` can be reached from statue `K` is along path `KFH`.


    List the three other ways that statue `H` can be reached from statue `K`.   (1 mark)

    --- 1 WORK AREA LINES (style=lined) ---

Show Answers Only
  1. `F and K`
  2. `KJHqquadKMJHqquadKFJH`
Show Worked Solution

a.   `F and K`
  

b.   `KJHqquadKMJHqquadKFJH`

Filed Under: Flow Problems Tagged With: Band 3, smc-625-30-Reachability

NETWORKS, FUR2 2010 VCAA 2

The diagram below shows a network of tracks (represented by edges) between checkpoints (represented by vertices) in a short-distance running course. The numbers on the edges indicate the time, in minutes, a team would take to run along each track.


Network, FUR2 2011 VCAA 2_1
 

Another challenge requires teams to run from checkpoint `X` to checkpoint `Y` using these tracks.

  1. What would be the shortest possible time for a team to run from checkpoint `X` to checkpoint `Y`?  (1 mark)

    --- 1 WORK AREA LINES (style=lined) ---

  2. Teams are required to follow a route from checkpoint `X` to checkpoint `Y` that passes through every checkpoint once only.

  3.  i. What mathematical term is used to describe such a route?   (1 mark)

    --- 1 WORK AREA LINES (style=lined) ---

  4. ii. On the network diagram below, draw in the route from checkpoint `X` to checkpoint `Y` that passes through every checkpoint once only.   (1 mark)

    --- 0 WORK AREA LINES (style=lined) ---

   
  Network, FUR2 2011 VCAA 2_2

Show Answers Only
  1. `11\ text(minutes)`
  2. i. `text(Hamiltonian path)`
    ii. 
    Network, FUR2 2011 VCAA 2 Answer
Show Worked Solution

a.   `4 + 3 + 4 = 11\ text(minutes)`
  

b.i.   `text(Hamiltonian path)`


b.ii.    Network, FUR2 2011 VCAA 2 Answer

Filed Under: Travelling Problems and Adjacency Matrices Tagged With: Band 3, smc-622-20-Hamiltonian

NETWORKS, FUR2 2011 VCAA 2

At the Farnham showgrounds, eleven locations require access to water. These locations are represented by vertices on the network diagram shown below. The dashed lines on the network diagram represent possible water pipe connections between adjacent locations. The numbers on the dashed lines show the minimum length of pipe required to connect these locations in metres.
 

NETWORKS, FUR2 2011 VCAA 2 
 

All locations are to be connected using the smallest total length of water pipe possible.

  1. On the diagram, show where these water pipes will be placed.   (1 mark)

    --- 0 WORK AREA LINES (style=lined) ---

  2. Calculate the total length, in metres, of water pipe that is required.   ( 1 mark) 

    --- 3 WORK AREA LINES (style=lined) ---

Show Answers Only
  1.  
    NETWORKS, FUR2 2011 VCAA 2 Answer
  2. `510\ text(metres)`
Show Worked Solution
a.    NETWORKS, FUR2 2011 VCAA 2 Answer


b.   `text(Total length of water pipe)`

`= 60 + 60 + 40 + 60 + 50 + 40 + 60`

`+ 40 + 50 + 50`

`= 510\ text(metres)`

Filed Under: Minimum Spanning Trees and Shortest Paths Tagged With: Band 3, Band 4, smc-624-10-Distance

NETWORKS, FUR2 2011 VCAA 1

Aden, Bredon, Carrie, Dunlop, Enwin and Farnham are six towns.

The network shows the road connections and distances between these towns in kilometres.


  1. In kilometres, what is the shortest distance between Farnham and Carrie?   (1 mark)

    --- 2 WORK AREA LINES (style=lined) ---

  2. How many different ways are there to travel from Farnham to Carrie without passing through any town more than once?   (1 mark)

    --- 4 WORK AREA LINES (style=lined) ---

An engineer plans to inspect all of the roads in this network.

He will start at Dunlop and inspect each road only once.

  1. At which town will the inspection finish?   (1 mark)

    --- 1 WORK AREA LINES (style=lined) ---

Another engineer decides to start and finish her road inspection at Dunlop.

If an assistant inspects two of the roads, this engineer can inspect the remaining six roads and visit each of the other five towns only once.

  1. How many kilometres of road will the assistant need to inspect?   (1 mark)

    --- 3 WORK AREA LINES (style=lined) ---

Show Answers Only
  1. `200\ text(km)`
  2. `6`
  3. `text(Bredon)`
  4. `240\ text(km)`
Show Worked Solution

a.   `text{Farnham to Carrie (shortest)}`

`= 60 + 140`

`= 200\ text(km)`
  

b.   `text(Different paths are)`

`FDC, FEDC, FEBC,`

`FEABC, FDEBC,`

`FDEABC`

`:. 6\ text(different ways)`
  

c.   `text(A possible path is)\ DFEABCDEB\ text(and will finish)`

`text{at Bredon (the other odd-degree vertex).}`
  

d.   `text(If the engineer’s path is)`

`DFEABCD,`

`text(Distance assistant inspects)`

`= 110 + 130`

`= 240\ text(km)`

Filed Under: Minimum Spanning Trees and Shortest Paths, Travelling Problems and Adjacency Matrices Tagged With: Band 2, Band 3, Band 4, smc-622-10-Euler, smc-622-20-Hamiltonian, smc-624-60-Shortest Paths

NETWORKS, FUR2 2013 VCAA 1

The vertices in the network diagram below show the entrance to a wildlife park and six picnic areas in the park: `P1`, `P2`, `P3`, `P4`, `P5` and `P6`.

The numbers on the edges represent the lengths, in metres, of the roads joining these locations.


  1. In this graph, what is the degree of the vertex at the entrance to the wildlife park?   (1 mark)

    --- 1 WORK AREA LINES (style=lined) ---

  2. What is the shortest distance, in metres, from the entrance to picnic area `P3`?   (1 mark)

    --- 3 WORK AREA LINES (style=lined) ---

  3. A park ranger starts at the entrance and drives along every road in the park once.
  4. i. At which picnic area will the park ranger finish?   (1 mark)

    --- 3 WORK AREA LINES (style=lined) ---

  5. ii. What mathematical term is used to describe the route the park ranger takes?   (1 mark)

    --- 1 WORK AREA LINES (style=lined) ---

  6. A park cleaner follows a route that starts at the entrance and passes through each picnic area once, ending at picnic area `P1`.


    Write down the order in which the park cleaner will visit the six picnic areas.   (1 mark)

    --- 1 WORK AREA LINES (style=lined) ---

Show Answers Only
  1. `3`
  2. `1000\ text(m)`
  3. i. `P4`
    ii. `text(Euler path)` 
  4. `E-P5-P4-P6-P3-P2-P1`
Show Worked Solution

a.   `3`
  

b.   `text( Shortest distance)`

`= E-P1-P3`

`= 600 + 400`

`= 1000\ text(m)`
  

c.i.   `text(A route could be)`

`E-P1-P2-P3-P4-P5`

`-E-P6-P1-P3-P6-P4`

`:.\ text(Finish at)\ P4\ \ text{(the other odd degree vertex)}`
  

c.ii.   `text(Euler path)`
  

d.   `E-P5-P4-P6-P3-P2-P1`

Filed Under: Travelling Problems and Adjacency Matrices Tagged With: Band 2, Band 3, smc-622-10-Euler, smc-622-20-Hamiltonian

NETWORKS, FUR2 2014 VCAA 3

The diagram below shows a network of train lines between five towns: Attard, Bower, Clement, Derrin and Eden.

The numbers indicate the distances, in kilometres, that are travelled by train between connected towns.
 

Charlie followed an Eulerian path through this network of train lines.

  1. i. Write down the names of the towns at the start and at the end of Charlie’s path.   (1 mark)

    --- 1 WORK AREA LINES (style=lined) ---

    ii. What distance did he travel?   (1 mark)

    --- 2 WORK AREA LINES (style=lined) ---

Brianna will follow a Hamiltonian path from Bower to Attard.

  1. What is the shortest distance that she can travel?   (1 mark)

    --- 2 WORK AREA LINES (style=lined) ---

The train line between Derrin and Eden will be removed. If one other train line is removed from the network, Andrew would be able to follow an Eulerian circuit through the network of train lines.

  1. Which other train line should be removed?


    In the boxes below, write down the pair of towns that this train line connects.  (1 mark) 

    --- 0 WORK AREA LINES (style=lined) ---

     
    NETWORKS, FUR2 2014 VCAA 32

Show Answers Only
  1.  i.  `text(Bower, Eden)`
    ii.  `910\ text(km)`
  2. `270\ text(km)`
  3. `text(Bower and Derrin)`
Show Worked Solution

a.i.   `text(Bower, Eden or Eden, Bower)`
  

a.ii.   `text(Distance)\ \ BDABCDEACE`

`= 160 + 130 + 80 + 70 + 60 + 40 + 100 + 150 + 120`

`= 910\ text(km)`
  

b.   `text(Shortest Hamiltonian path is)\ BCDEA`

`text(Distance)` `= 70 + 60 + 40 + 100`
  `= 270\ text(km)`

  
c.
   `text(Remove the line between Bower and Derrin.)`

Filed Under: Travelling Problems and Adjacency Matrices Tagged With: Band 3, Band 4, smc-622-10-Euler, smc-622-20-Hamiltonian

NETWORKS, FUR2 2014 VCAA 2

Planning a train club open day involves four tasks.

Table 1 shows the number of hours that each club member would take to complete these tasks.
 

     NETWORKS, FUR2 2014 VCAA 21
 

The Hungarian algorithm will be used to allocate the tasks to club members so that the total time taken to complete the tasks is minimised.

The first step of the Hungarian algorithm is to subtract the smallest element in each row of Table 1 from each of the elements in that row.

The result of this step is shown in Table 2 below.

  1. Complete Table 2 by filling in the missing numbers for Andrew.   (1 mark)

    --- 0 WORK AREA LINES (style=lined) ---


    NETWORKS, FUR2 2014 VCAA 22
     

After completing Table 2, Andrew decided that an allocation of tasks to minimise the total time taken was not yet possible using the Hungarian algorithm.

  1. Explain why Andrew made this decision.   (1 mark)

    --- 2 WORK AREA LINES (style=lined) ---

Table 3 shows the final result of all steps of the Hungarian algorithm.
 

NETWORKS, FUR2 2014 VCAA 23

  1.  i. Which task should be allocated to Andrew?   (1 mark)

    --- 1 WORK AREA LINES (style=lined) ---

  2. ii. How many hours in total are used to plan for the open day?   (1 mark)

    --- 2 WORK AREA LINES (style=lined) ---

Show Answers Only
  1.  
    Networks, FUR2 2014 VCAA 2_2 answer
  2. `text(The minimum number of lines to cover all zeros)`
    `text(is less than four.)`
    1. `text(Equipment)`
    2. `36`
Show Worked Solution
a.    Networks, FUR2 2014 VCAA 2_2 answer


b.   `text(The minimum number of lines to cover all zeros)`

MARKER’S COMMENT: An answer of “there were not enough zeros” did not gain a mark.

`text(is less than four.)`
  

c.i.   `text(Equipment)`
  

c.ii.   `text(Total hours to plan)`

`= 8 +10 +10 + 8`

`= 36`

Filed Under: Matching Problems Tagged With: Band 3, Band 4, smc-623-10-Hungarian Algorithm

NETWORKS, FUR2 2015 VCAA 2

The factory supplies groceries to stores in five towns, `Q`, `R`, `S`, `T` and `U`, represented by vertices on the graph below.
 

Networks, FUR2 2015 VCAA 2
 

The edges of the graph represent roads that connect the towns and the factory.

The numbers on the edges indicate the distance, in kilometres, along the roads.

Vehicles may only travel along the road between towns `S` and `Q` in the direction of the arrow due to temporary roadworks.

Each day, a van must deliver groceries from the factory to the five towns.

The first delivery must be to town `T`, after which the van will continue on to the other four towns before returning to the factory.

  1. i. The shortest possible circuit from the factory for this delivery run, starting from town `T`, is not Hamiltonian.
     
    Complete the order in which these deliveries would follow this shortest possible circuit.   (1 mark)

    --- 0 WORK AREA LINES (style=lined) ---

     factory – `T` – ___________________________ – factory

  2. ii. With reference to the town names in your answer to part (a)(i), explain why this shortest circuit is not a Hamiltonian circuit.   (1 mark)

    --- 1 WORK AREA LINES (style=lined) ---

  3. Determine the length, in kilometres, of a delivery run that follows a Hamiltonian circuit from the factory to these stores if the first delivery is to town `T`.   (1 mark)

    --- 3 WORK AREA LINES (style=lined) ---

Show Answers Only

a.i.  `text(factory)\-T-S-Q-R-S-U-text(factory)`

aii.  `text(The van passes through town)\ S\ text(twice.)`

b.   `162\ text(km)`

Show Worked Solution

a.i.   `text(factory)\-T-S-Q-R-S-U- text(factory)`
  

a.ii.   `text(The van passes through town)\ S\ text(twice.)`
  

b.   `text(Hamiltonian circuit is)`

`text(factory)\-T-S-R-Q-U-text(factory)`

`= 44 + 38 + 12 + 8 + 38 + 22`

`= 162\ text(km)`

Filed Under: Minimum Spanning Trees and Shortest Paths, Travelling Problems and Adjacency Matrices Tagged With: Band 3, Band 4, smc-622-20-Hamiltonian, smc-624-60-Shortest Paths

NETWORKS, FUR2 2015 VCAA 1

A factory requires seven computer servers to communicate with each other through a connected network of cables.

The servers, `J`, `K`, `L`, `M`, `N`, `O` and `P`, are shown as vertices on the graph below.
 

Networks, FUR2 2015 VCAA 11

 
The edges on the graph represent the cables that could connect adjacent computer servers.

The numbers on the edges show the cost, in dollars, of installing each cable.

  1. What is the cost, in dollars, of installing the cable between server `L` and server `M`?   (1 mark)

    --- 1 WORK AREA LINES (style=lined) ---

  2. What is the cheapest cost, in dollars, of installing cables between server `K` and server `N`?   (1 mark)

    --- 3 WORK AREA LINES (style=lined) ---

  3. An inspector checks the cables by walking along the length of each cable in one continuous path.
    To avoid walking along any of the cables more than once, at which vertex should the inspector start and where would the inspector finish?   (1 mark)

    --- 1 WORK AREA LINES (style=lined) ---


  4. The computer servers will be able to communicate with all the other servers as long as each server is connected by cable to at least one other server.
    i.
    The cheapest installation that will join the seven computer servers by cable in a connected network follows a minimum spanning tree.

    Draw the minimum spanning tree on the plan below?   (1 mark)

    --- 0 WORK AREA LINES (style=lined) ---


    Networks, FUR2 2015 VCAA 12
  5. ii. The factory’s manager has decided that only six connected computer servers will be needed, rather than seven. 

    How much would be saved in installation costs if the factory removed computer server `P` from its minimum spanning tree network?
    A copy of the graph above is provided below to assist with your working.   (1 mark)

    Networks, FUR2 2015 VCAA 12

    --- 5 WORK AREA LINES (style=lined) ---

Show Answers Only
  1. `$300`
  2. `$920`
  3. `N\ text(and)\ P\ text{(or}\ P\ text(and)\ N)`
  4. i. 

 Networks, FUR2 2015 VCAA 12 Answer
d.ii.`$120`

Show Worked Solution

a.   `$300`
  

b.   `text(C)text(ost of)\ K\ text(to)\ N`

`= 440 + 480`

`= $920`
  

c.   `N\ text(and)\ P\ text{(or}\ P\ text(and)\ N)`

MARKER’S COMMENT: Many students had difficulty finding the minimum spanning tree, often incorrectly excluding `PO` or `KL`.
d.i.    Networks, FUR2 2015 VCAA 12 Answer


d.ii.   `text(Disconnect)\ J – P\ text(and)\ O – P`

`text(Savings) = 200 + 400 = $600`

`text(Add in)\ M – N`

`text(C)text(ost) = $480`

`:.\ text(Net savings)` `= 600 – 480`
  `= $120`

Filed Under: Minimum Spanning Trees and Shortest Paths Tagged With: Band 3, Band 4, smc-624-20-Cost, smc-624-60-Shortest Paths

MATRICES, FUR2 2006 VCAA 2

A new shopping centre called Shopper Heaven (`S`) is about to open. It will compete for customers with Eastown (`E`) and Noxland (`N`).

Market research suggests that each shopping centre will have a regular customer base but attract and lose customers on a weekly basis as follows.

80% of Shopper Heaven customers will return to Shopper Heaven next week
12% of Shopper Heaven customers will shop at Eastown next week
8% of Shopper Heaven customers will shop at Noxland next week

76% of Eastown customers will return to Eastown next week
9% of Eastown customers will shop at Shopper Heaven next week
15% of Eastown customers will shop at Noxland next week

85% of Noxland customers will return to Noxland next week
10% of Noxland customers will shop at Shopper Heaven next week
5% of Noxland customers will shop at Eastown next week

  1. Enter this information into transition matrix `T` as indicated below (express percentages as proportions, for example write 76% as 0.76).   (2 marks)

    --- 0 WORK AREA LINES (style=lined) ---


    `qquad{:(qquadqquadqquadtext(this week)),((qquadqquadqquad S,qquad E, quad N)),(T = [(qquadqquadqquadqquadqquadqquad),(),()]{:(S),(E),(N):}{:qquadtext(next week):}):}`
     

During the week that Shopper Heaven opened, it had 300 000 customers.

In the same week, Eastown had 120 000 customers and Noxland had 180 000 customers.

  1. Write this information in the form of a column matrix, `K_0`, as indicated below.   (1 mark)

    --- 0 WORK AREA LINES (style=lined) ---


    `qquadK_0 = [(quadqquadqquadqquadqquad),(),()]{:(S),(E),(N):}`
     

  2. Use `T` and `K_0` to write and evaluate a matrix product that determines the number of customers expected at each of the shopping centres during the following week.   (2 marks)

    --- 4 WORK AREA LINES (style=lined) ---

  3. Show by calculating at least two appropriate state matrices that, in the long term, the number of customers expected at each centre each week is given by the matrix   (2 marks)
  4. `qquadK = [(194\ 983),(150\ 513),(254\ 504)]`

    --- 5 WORK AREA LINES (style=lined) ---

Show Answers Only
  1.  
    `{:((qquadqquadqquad\ S,qquadE,qquadN)),(T = [(0.8,0.09,0.10),(0.12,0.76,0.05),(0.08,0.15,0.85)]{:(S),(E),(N):}):}`
  2.  
    `K_0 = [(300\ 000),(120\ 000),(180\ 000)]{:(S),(E),(N):}`
  3.  
    `TK_0 = [(268\ 800),(136\ 200),(195\ 000)]`
  4. `text(See Worked Solutions)`
Show Worked Solution
a.     `{:((qquadqquadqquad\ S,qquadE,qquadN)),(T = [(0.8,0.09,0.10),(0.12,0.76,0.05),(0.08,0.15,0.85)]{:(S),(E),(N):}):}`


b.     `K_0 = [(300\ 000),(120\ 000),(180\ 000)]{:(S),(E),(N):}`


c.   `text(Customers expected at each centre the next week,)`

`TK_0` `= [(0.80,0.09,0.10),(0.12,0.76,0.05),(0.08,0.15,0.85)][(300\ 000),(120\ 000),(180\ 000)]`
  `= [(268\ 800),(136\ 200),(195\ 000)]`


d.   `text(Consider)\ \ T^nK_0\ \ text(when)\ n\ text(large),`

`text(say)\ n=50, 51`

`T^50K_0` `= [(0.8,0.09,0.10),(0.12,0.76,0.05),(0.08,0.15,0.85)]^50[(300\ 000),(120\ 000),(180\ 000)]= [(194\ 983),(150\ 513),(254\ 504)]`


`T^51K_0` `= [(0.8,0.09,0.10),(0.12,0.76,0.05),(0.08,0.15,0.85)]^51[(300\ 000),(120\ 000),(180\ 000)]= [(194\ 983),(150\ 513),(254\ 504)]`
  ` = T^50K_0`

Filed Under: Transition Matrices - Regular Tagged With: Band 3, Band 4, Band 5, smc-618-10-Diagram/Info to Matrix, smc-618-30-State Matrix in discrete period, smc-618-61-3x3 Matrix

MATRICES, FUR2 2006 VCAA 1

A manufacturer sells three products, `A`, `B` and `C`, through outlets at two shopping centres, Eastown (`E`) and Noxland (`N`). 

The number of units of each product sold per month through each shop is given by the matrix `Q`, where

`{:((qquadqquadqquad\ A,qquadquadB,qquad\ C)),(Q=[(2500,3400,1890),(1765,4588,2456)]{:(E),(N):}):}`

  1. Write down the order of matrix `Q`.   (1 mark)

    --- 1 WORK AREA LINES (style=lined) ---

The matrix `P`, shown below, gives the selling price, in dollars, of products `A`, `B`, `C`.

`P = [(14.50),(21.60),(19.20)]{:(A),(B),(C):}`

  1.   i. Evaluate the matrix `M`, where `M = QP`.   (1 mark)

    --- 3 WORK AREA LINES (style=lined) ---

  2.  ii. What information does the elements of matrix `M` provide?   (1 mark)

    --- 2 WORK AREA LINES (style=lined) ---

  3. Explain why the matrix `PQ` is not defined.   (1 mark)

    --- 2 WORK AREA LINES (style=lined) ---

Show Answers Only
  1. `2 xx 3`
    1. `M = QP = [(135\ 320.5),(171\ 848.5)]`
    2. `text(The total of selling products)\ A, B,and C`
      `text(at each of Eastown and Noxland.)`
  2. `PQ\ text(is not defined because the number of)`
    `text(columns in)\ P !=\ text(the number of rows in)\ Q.`
Show Worked Solution

a.   `2 xx 3`
 

b.i.    `M` `= QP`
    `= [(2500,3400,1890),(1765,4588,2456)][(14.50),(21.60),(19.20)]`
    `= [(135\ 320.5),(171\ 848.5)]`

 
b.ii.  
`text(The total revenue from selling products)\ A, B,`

   `text(and)\ C\ text(at each of Eastown and Noxland.)`
 

c.   `PQ\ text(is not defined because the number of)`

`text(columns in)\ P !=\ text(the number of rows in)\ Q.`

Filed Under: Matrix Applications Tagged With: Band 2, Band 3, Band 4, smc-619-30-Matrix product and interpretation

MATRICES, FUR2 2007 VCAA 2

To study the life-and-death cycle of an insect population, a number of insect eggs (`E`), juvenile insects (`J`) and adult insects (`A`) are placed in a closed environment.

The initial state of this population can be described by the column matrix

`S_0 = [(400),(200),(100),(0)]{:(E),(J),(A),(D):}`

A row has been included in the state matrix to allow for insects and eggs that die (`D`).

  1. What is the total number of insects in the population (including eggs) at the beginning of the study?   (1 mark)

    --- 1 WORK AREA LINES (style=lined) ---

In this population

    • eggs may die, or they may live and grow into juveniles
    • juveniles may die, or they may live and grow into adults
    • adults will live a period of time but they will eventually die.

In this population, the adult insects have been sterilised so that no new eggs are produced. In these circumstances, the life-and-death cycle of the insects can be modelled by the transition matrix
 

`{:(qquadqquadqquadqquadquadtext(this week)),((qquadqquadqquadE,quad\ J,quadA,\ D)),(T = [(0.4,0,0,0),(0.5,0.4,0,0),(0,0.5,0.8,0),(0.1,0.1,0.2,1)]{:(E),(J),(A),(D):}):}`
 

  1. What proportion of eggs turn into juveniles each week?   (1 mark)

    --- 1 WORK AREA LINES (style=lined) ---

    1. Evaluate the matrix product  `S_1 = TS_0`   (1 mark)

      --- 1 WORK AREA LINES (style=lined) ---

    2. Write down the number of live juveniles in the population after one week.   (1 mark)

      --- 3 WORK AREA LINES (style=lined) ---

    3. Determine the number of live juveniles in the population after four weeks. Write your answer correct to the nearest whole number.   (1 mark)

      --- 1 WORK AREA LINES (style=lined) ---

    4. After a number of weeks there will be no live eggs (less than one) left in the population.
    5. When does this first occur?   (1 mark)

      --- 4 WORK AREA LINES (style=lined) ---

    6. Write down the exact steady-state matrix for this population.  (1 mark)

      --- 3 WORK AREA LINES (style=lined) ---

  2. If the study is repeated with unsterilised adult insects, eggs will be laid and potentially grow into adults.
  3. Assuming 30% of adults lay eggs each week, the population matrix after one week, `S_1`, is now given by
  4. `qquad S_1 = TS_0 + BS_0`
  5. where   `B = [(0,0,0.3,0),(0,0,0,0),(0,0,0,0),(0,0,0,0)]`   and   `S_0 = [(400),(200),(100),(0)]{:(E),(J),(A),(D):}`
     

    1. Determine `S_1`  (1 mark)

      --- 3 WORK AREA LINES (style=lined) ---

    2. This pattern continues. The population matrix after `n` weeks, `S_n`, is given by
    3. `qquad qquad qquad S_n = TS_(n - 1) + BS_(n - 1)`
    4. Determine the number of live eggs in this insect population after two weeks.  (1 mark)

      --- 3 WORK AREA LINES (style=lined) ---

Show Answers Only
  1. `700`
  2. `50text(%)`
  3.  
    1. `[(160),(280),(180),(80)]{:(E),(J),(A),(D):}`
    2. `280`
    3. `56`
    4. `text(7th week)`
    5. `[(0),(0),(0),(700)]`
    1. `[(190),(280),(180),(80)]`
    2. `130`
Show Worked Solution

a.   `400 + 200 + 100 + 0 = 700`
 

b.   `50text(%)`
 

c.i.    `S_1` ` = TS_0`
    `= [(0.4,0,0,0),(0.5,0.4,0,0),(0,0.5,0.8,0),(0.1,0.1,0.2,1)][(400),(200),(100),(0)]`
    `= [(160),(280),(180),(80)]{:(E),(J),(A),(D):}`

 
c.ii.
   `280`
 

c.iii.    `S_4` ` = T^4S_0`
    `= [(10.24),(56.32),(312.96),(320.48)]{:(E),(J),(A),(D):}\ \ \ text{(by graphics calculator)}`

 
`:. 56\ text(juveniles still alive after 4 weeks.)`
 

c.iv.  `text(Each week, only 40% of eggs remain.)`

`text(Find)\ \ n\ \ text(such that)`

`400 xx 0.4^n` `< 1`
`0.4^n` `<1/400`
`n` `> 6.5`

 
`:.\ text(After 7 weeks, no live eggs remain.)`


c.v.   `text(Consider)\ \ n\ \ text{large (say}\ \ n = 100 text{)},`

`[(0.4, 0, 0, 0), (0.5, 0.4, 0, 0), (0, 0.5, 0.8, 0), (0.1, 0.1, 0.2, 1)]^100 [(400), (200), (100), (0)] ~~ [(0), (0), (0), (700)]`


d.i.   `S_1` `= TS_0 + BS_0`
    `= [(160),(280),(180),(80)] + [(0,0,0.3,0),(0,0,0,0),(0,0,0,0),(0,0,0,0)][(400),(200),(100),(0)]= [(190),(280),(180),(80)]`


♦♦ Mean mark for part (d) was 30%.
d.ii.   `S_2` `= TS_1 + BS_1= [(130), (207), (284), (163)]`

 
`:.\ text(There are 130 live egss after 2 weeks.)`

Filed Under: Transition Matrices - Modified, Transition Matrices - Regular Tagged With: Band 3, Band 4, Band 5, Band 6, smc-1893-20-State Matrix in discrete period, smc-1893-32-4x4 Matrix, smc-1893-60-Regular Transition Matrices, smc-618-30-State Matrix in discrete period, smc-618-40-Steady State, smc-618-62-4x4 Matrix

MATRICES, FUR2 2007 VCAA 1

The table below displays the energy content and amounts of fat, carbohydrate and protein contained in a serve of four foods: bread, margarine, peanut butter and honey.
 

MATRICES, FUR2 2007 VCAA 1
 

  1. Write down a 2 x 3 matrix that displays the fat, carbohydrate and protein content (in columns) of bread and margarine.   (1 mark)

    --- 2 WORK AREA LINES (style=lined) ---

  2. `A` and `B` are two matrices defined as follows.
     
         `A = [(2,2,1,1)]`     `B = [(531),(41),(534),(212)]`

    1. Evaluate the matrix product  `AB`.   (1 mark)

      --- 3 WORK AREA LINES (style=lined) ---

    2. Determine the order of matrix product  `BA`.   (1 mark)

      --- 1 WORK AREA LINES (style=lined) ---

Matrix `A` displays the number of servings of the four foods: bread, margarine, peanut butter and honey, needed to make a peanut butter and honey sandwich.

Matrix `B` displays the energy content per serving of the four foods: bread, margarine, peanut butter and honey.

    1. Explain the information that the matrix product `AB` provides.   (1 mark)

      --- 2 WORK AREA LINES (style=lined) ---

  1. The number of serves of bread (`b`), margarine (`m`), peanut butter (`p`) and honey (`h`) that contain, in total, 53 grams of fat, 101.5 grams of carbohydrate, 28.5 grams of protein and 3568 kilojoules of energy can be determined by solving the matrix equation
      

         `[(1.2,6.7,10.7,0),(20.1,0.4,3.5,12.5),(4.2,0.6,4.6,0.1),(531,41,534,212)][(b),(m),(p),(h)] = [(53),(101.5),(28.5),(3568)]`
      
    Solve the matrix equation to find the values `b`, `m`, `p` and `h`.   (2 marks)

    --- 4 WORK AREA LINES (style=lined) ---

Show Answers Only
  1.  
    `[(1.2,20.1,4.2),(6.7,0.4,0.6)]`
    1. `[1890]`
    2. `underset (4 xx 1) B xx underset (1 xx 4) A = underset (4 xx 4) (BA)`
    3. `BA\ text(provides the total energy)`
      `text(content of the servings of these)`
      `text(four foods in one sandwich.)`
  2. `b = 4, m = 4, p = 2, h = 1`
Show Worked Solution
a.    `[(1.2,20.1,4.2),(6.7,0.4,0.6)]`


b.i.    `AB` `= [(2, 2, 1, 1)] [(531), (41), (534), (212)]`
    `= [1890]`


b.ii.   `underset (4 xx 1) B xx underset (1 xx 4) A = underset (4 xx 4) (BA)`


b.iii.   `BA\ text(provides the total energy content of the)`
 

`text(servings of these four foods in one sandwich.)`


c.    `[(b),(m),(p),(h)]` `= [(1.2,6.7,10.7,0),(20.1,0.4,3.5,12.5),(4.2,0.6,4.6,0.1),(531,41,534,212)]^(-1)[(53),(101.5),(28.5),(3568)]`
    `= [(4),(4),(2),(1)]\ \ \ text{(by graphics calculator)}`

 
`:. b = 4, m = 4, p = 2\ text(and)\ h = 1.`

Filed Under: Matrix Applications, Simultaneous Equations Tagged With: Band 3, Band 4, smc-617-40-Inverse Matrix to solve equation, smc-619-10-Matrix from info/table, smc-619-30-Matrix product and interpretation

NETWORKS, FUR2 2010 VCAA 1

The members of one team are Kristy (`K`), Lyn (`L`), Mike (`M`) and Neil (`N`). 

In one of the challenges, these four team members are only allowed to communicate directly with each other as indicated by the edges of the following network.
 

Network, FUR2 2011 VCAA 1
 

The adjacency matrix below also shows the allowed lines of communication.

`{:(quadKquadLquadMquadN),([(0,1,0,0),(1,0,1,0),(0,f,0,1),(0,g,1,0)]{:(K),(L),(M),(N):}):}`


  1. Explain the meaning of a zero in the adjacency matrix.   (1 mark)

    --- 1 WORK AREA LINES (style=lined) ---

  2. Write down the values of `f` and `g` in the adjacency matrix.   (1 mark)

    --- 1 WORK AREA LINES (style=lined) ---

Show Answers Only
  1. `text(No direct communication is allowed.)`
  2. `f = 1, g = 0`
Show Worked Solution

a.   `text(No direct communication is allowed.)`
  

b.   `f = 1, g = 0`

Filed Under: Travelling Problems and Adjacency Matrices Tagged With: Band 2, Band 3, smc-622-40-Adjacency Matrix

MATRICES, FUR2 2009 VCAA 3

In 2009, the school entered a Rock Eisteddfod competition.

When rehearsals commenced in February, all students were asked whether they thought the school would make the state finals. The students’ responses, ‘yes’, ‘no’ or ‘undecided’ are shown in the initial state matrix `S_0`.
 

`S_0 = [(160),(120),(220)]{:(text(yes)),(text(no)),(text(undecided)):}`
 

  1. How many students attend this school?   (1 mark)

    --- 2 WORK AREA LINES (style=lined) ---

Each week some students are expected to change their responses. The changes in their responses from one week to the next are modelled by the transition matrix `T` shown below.
 

`{:(qquadqquadqquadtext( response this week)),(qquadqquadquadtext( yes       no     undecided)),(T = [(0.85quad,0.35quad,0.60),(0.10quad,0.40quad,0.30),(0.05quad,0.25quad,0.10)]{:(text(yes)),(text(no)),(text(undecided)):}qquad{:(text(response)),(text(next week)):}):}`
 

The following diagram can also be used to display the information represented in the transition matrix `T`.

MATRICES, FUR2 2009 VCAA 3

    1. Complete the diagram above by writing the missing percentage in the shaded box.   (1 mark)

      --- 0 WORK AREA LINES (style=lined) ---

    2. Of the students who respond ‘yes’ one week, what percentage are expected to respond ‘undecided’ the next week when asked whether they think the school will make the state finals?   (1 mark)

      --- 1 WORK AREA LINES (style=lined) ---

    3. In total, how many students are not expected to have changed their response at the end of the first week?   (2 marks)

      --- 2 WORK AREA LINES (style=lined) ---

  1. Evaluate the product  `S_1 = TS_0`, where `S_1` is the state matrix at the end of the first week.   (1 mark)

    --- 3 WORK AREA LINES (style=lined) ---

  2. How many students are expected to respond ‘yes’ at the end of the third week when asked whether they think the school will make the state finals?   (1 mark)

    --- 3 WORK AREA LINES (style=lined) ---

Show Answers Only
  1. `500`
    1. `text(25%)`
    2. `text(5%)`
    3. `206`
  2. `S_1 = [(310),(130),(60)]`
  3. `361`
Show Worked Solution

a.   `text(Total students attending)`

`= 160 + 120 + 220`

`= 500`
 

b.i.   `text(25%)`
 

b.ii.   `text(5%)`
 

b.iii.   `text(Students not expected to change)`

`= 0.85 xx 160 + 0.4 xx 120 + 0.1 xx 220`

`= 206`
 

c.    `S_1` `=TS_0`
    `= [(0.85,0.35,0.60),(0.10,0.40,0.30),(0.05,0.25,0.10)][(160),(120),(220)]= [(310),(130),(60)]`


d.    `S_3` `= T^3 S_0` 
    `= [(0.85,0.35,0.60),(0.10,0.40,0.30),(0.05,0.25,0.10)]^3[(160),(120),(220)]= [(361),(91.1),(47.9)]` 

 
`:. 361\ text(students expected to respond “yes” at end of week 3.)`

Filed Under: Transition Matrices - Regular Tagged With: Band 3, Band 4, Band 5, smc-618-20-Matrix to Diagram, smc-618-30-State Matrix in discrete period, smc-618-61-3x3 Matrix

MATRICES, FUR2 2009 VCAA 2

Tickets for the function are sold at the school office, the function hall and online.

Different prices are charged for students, teachers and parents.

Table 1 shows the number of tickets sold at each place and the total value of sales.

MATRICES, FUR2 2009 VCAA 21

For this function

    • student tickets cost  `$x`
    • teacher tickets cost  `$y`
    • parent tickets cost  `$z`.
  1. Use the information in Table 1 to complete the following matrix equation by inserting the missing values in the shaded boxes.   (1 mark)

    --- 0 WORK AREA LINES (style=lined) ---

     
         MATRICES, FUR2 2009 VCAA 22


  2. Use the matrix equation to find the cost of a teacher ticket to the school function.   (2 marks)

    --- 4 WORK AREA LINES (style=lined) ---

Show Answers Only
  1. `text(35 and 2)`
  2. `$32`
Show Worked Solution

a.   `text(35 and 2)`
 

MARKER’S COMMENT: Simply writing the column matrix in part (b) did not earn full marks. Students must extract the required data.
b.    `[(x),(y),(z)]` `= [(283,28,5),(35,4,2),(84,3,7)]^(-1)[(8712),(1143),(2609)]`
    `= [(27),(32),(35)]`


`:.\ text(C)text(ost of a teacher ticket = $32)`

Filed Under: Matrix Applications, Simultaneous Equations Tagged With: Band 3, Band 4, smc-617-40-Inverse Matrix to solve equation, smc-619-20-Matrix product from table

MATRICES, FUR2 2009 VCAA 1

Three types of cheese, Cheddar (`C`), Gouda (`G`) and Blue (`B`), will be bought for a school function.

The cost matrix `P` lists the prices of these cheeses, in dollars, at two stores, Foodway and Safeworth.
 

`P = [(6.80, 5.30, 6.20),(7.30, 4.90, 6.15)]{:(text(Foodway)),(text(Safeworth)):}`
 

  1. What is the order of matrix `P`?   (1 mark)

    --- 1 WORK AREA LINES (style=lined) ---

The number of packets of each type of cheese needed is listed in the quantity matrix `Q`.
 

`Q = [(8),(11),(3)]{:(C),(G),(B):}`
 

    1. Evaluate the matrix  `W = PQ`.   (1 mark)

      --- 3 WORK AREA LINES (style=lined) ---

    2. At which store will the total cost of the cheese be lower?   (1 mark)

      --- 1 WORK AREA LINES (style=lined) ---

Show Answers Only

  1. `2 xx 3`
    1. `W = PQ = [(131.30),(130.75)]`
    2. `text(Safeworth)`

Show Worked Solution

a.   `2 xx 3`


b.i.    `W` `=PQ`
    `= [(6.80,5.30,6.20),(7.30,4.90,6.15)][(8),(11),(3)]`
    `= [(131.30),(130.75)]`


b.ii.   `text(Safeworth)`

Filed Under: Matrix Applications Tagged With: Band 2, Band 3, smc-619-30-Matrix product and interpretation

MATRICES, FUR2 2010 VCAA 2

The 300 players in Oscar’s league are involved in a training program. In week one, 90 players are doing heavy training (`H`), 150 players are doing moderate training (`M`) and 60 players are doing light training (`L`). The state matrix, `S_1`, shows the number of players who are undertaking each type of training in the first week
 

`S_1 = [(90),(150),(60)]{:(H),(M),(L):}`
 

The percentage of players that remain in the same training program, or change their training program from week to week, is shown in the transition diagram below.
 

MATRICES, FUR2 2010 VCAA 2
 

  1. What information does the 20% in the diagram above provide?   (1 mark)

    --- 2 WORK AREA LINES (style=lined) ---

The information in the transition diagram above can also be written as the transition matrix `T`.
 

`{:(qquadqquadqquadquad\ text(this week)),((qquadqquadqquadH,quadM,\ L)),(T = [(0.5,0.1,0.1),(0.2,0.6,0.5),(0.3,0.3,0.4)]{:(H),(M),(L):}qquad{:text(next week):}):}`
 

  1. Determine how many players will be doing heavy training in week two.   (1 mark)

    --- 3 WORK AREA LINES (style=lined) ---

  2. Determine how many fewer players will be doing moderate training in week three than in week one.   (1 mark)

    --- 4 WORK AREA LINES (style=lined) ---

  3. Show that, after seven weeks, the number of players (correct to the nearest whole number) who are involved in each type of training will not change.   (1 mark) 

    --- 4 WORK AREA LINES (style=lined) ---

Show Answers Only
  1. `text(It means that 20% of the players doing heavy training one)`


    `text(week will switch to moderate training the next.)`

  2. `text(66 players)`
  3. `text(6 fewer players)`
  4. `text(See Worked Solutions)`
Show Worked Solution

a.   `text(It means that 20% of the players doing heavy)`

`text(training one week will switch to moderate)`

`text(training the next.)`


b.    `S_2` `= TS_1`
    `= [(0.5,0.1,0.1),(0.2,0.6,0.5),(0.3,0.3,0.4)][(90),(150),(60)]`
    `= [(66),(138),(96)]`


`:. 66\ text(players will be in hard training)`

`text(in week 2.)`


c.   `text(150 in moderate training in week 1.)`

`text(In week 3,)`

`S_3` `= T^2S_1`
  `= [(0.5,0.1,0.1),(0.2,0.6,0.5),(0.3,0.3,0.4)]^2[(90),(150),(60)]`
  `= [(56.4),(144),(99.6)]`


`:.\ text(The reduction in players training moderately)`

`= 150-144`

`= 6`


d.   `text(Need to show steady numbers for consecutive)`

`text(weeks 8 and week 9,)`

`S_8 = T^7S_1 = [(50),(150),(100)]`

`S_9 = T^8S_1 = [(50),(150),(100)]`


`:. S_8 = S_9`

`text{(i.e. player numbers don’t change after week 7.)}`

Filed Under: Transition Matrices - Regular Tagged With: Band 3, Band 4, smc-618-25-Interpret Diagram, smc-618-30-State Matrix in discrete period, smc-618-61-3x3 Matrix

MATRICES, FUR2 2010 VCAA 1

In a game of basketball, a successful shot for goal scores one point, two points, or three points, depending on the position from which the shot is thrown.

`G`  is a column matrix that lists the number of points scored for each type of successful shot.

`G = [(1),(2),(3)]`

In one game, Oscar was successful with

    • 4 one-point shots for goal
    • 8 two-point shots for goal
    • 2 three-point shots for goal.
  1. Write a row matrix, `N`, that shows the number of each type of successful shot for goal that Oscar had in that game.   (1 mark)

    --- 1 WORK AREA LINES (style=lined) ---

  2. Matrix `P` is found by multiplying matrix `N` with matrix `G` so that  `P = N xx G`
  3. Evaluate matrix `P`.   (1 mark)

    --- 3 WORK AREA LINES (style=lined) ---

  4. In this context, what does the information in matrix `P` provide?   (1 mark)

    --- 2 WORK AREA LINES (style=lined) ---

Show Answers Only
  1. `N = [(4, 8, 2)]`
  2. `P = [26]`
  3. `text(The total points scored by Oscar in the game.)`
Show Worked Solution

a.   `N = [(4, 8, 2)]`
 

b.    `P` `= NG`
    `= [(4, 8, 2)][(1),(2),(3)]`
    `= [26]`

 
c.
   `text(The total points scored by Oscar in the game.)`

Filed Under: Matrix Applications Tagged With: Band 2, Band 3, Band 4, smc-619-10-Matrix from info/table, smc-619-30-Matrix product and interpretation

NETWORKS, FUR2 2012 VCAA 2

Thirteen activities must be completed before the produce grown on a farm can be harvested. 

The directed network below shows these activities and their completion times in days.


NETWORKS, FUR2 2012 VCAA 2
  

  1. Determine the earliest starting time, in days, for activity `E`.   (1 mark)

    --- 2 WORK AREA LINES (style=lined) ---

  2. A dummy activity starts at the end of activity `B`.


    Explain why this dummy activity is used on the network diagram.   (1 mark)

    --- 4 WORK AREA LINES (style=lined) ---

  3. Determine the earliest starting time, in days, for activity `H`.   (1 mark)

    --- 2 WORK AREA LINES (style=lined) ---

  4. In order, list the activities on the critical path.   (1 mark)

    --- 1 WORK AREA LINES (style=lined) ---

  5. Determine the latest starting time, in days, for activity `J`.   (1 mark)

    --- 4 WORK AREA LINES (style=lined) ---

Show Answers Only
  1. `12\ text(days)`
  2. `F\ text(has)\ B\ text(as a predecessor while)\ G\ text(and)\ H`
    `text(have)\ B\ text(and)\ C\ text(as predecessors.)`
    `text(S)text(ince there cannot be 2 activities called)\ B,`
    `text{a dummy activity is drawn as an extension of}`
    `B\ text(to show that it is also a predecessor of)\ G\ text(and)`
    `H\ text{(with zero time).}`
  3. `15\ text(days)`
  4. `A-B-H-I-L-M`
  5. `25\ text(days)`
Show Worked Solution
a.    `text(EST of)\ E` `= 10 + 2`
    `= 12\ text(days)`
♦ Mean mark of all parts (combined) 47%.


b.   `F\ text(has)\ B\ text(as a predecessor while)\ G\ text(and)\ H`

`text(have)\ B\ text(and)\ C\ text(as predecessors.)`

`text(S)text(ince there cannot be 2 activities called)\ B,`

`text{a dummy activity is drawn as an extension of}`

`B\ text(to show that it is also a predecessor of)\ G\ text(and)`

`H\ text{(with zero time).}`


♦♦ Exact data unavailable but “few students” were able to correctly deal with the dummy activity in this question.
c.    `text(EST of)\ H` `= 10 + 5`
    `= 15\ text(days)`


d.   `text(The critical path is)`

`A-B-H-I-L-M`


e.   `text(The shortest time to complete all the activities)`

MARKER’S COMMENT: A correct calculation based on an incorrect critical path in part (d) gained a consequential mark here. Show your working!

`= 10 + 5 + 4 + 3  + 4 + 2`

`= 28\ text(days)`


`:.\ text(LST of)\ J` `= 28-3`
  `= 25\ text(days)`

Filed Under: Critical Path Analysis Tagged With: Band 3, Band 4, Band 5, smc-621-20-Critical Paths/EST, smc-621-30-Float time/LST, smc-621-50-Dummy activities

NETWORKS, FUR2 2012 VCAA 1

Water will be pumped from a dam to eight locations on a farm.

The pump and the eight locations (including the house) are shown as vertices in the network diagram below.

The numbers on the edges joining the vertices give the shortest distances, in metres, between locations.
 

NETWORKS, FUR2 2012 VCAA 1
 

    1. Determine the shortest distance between the house and the pump.   (1 mark)

      --- 2 WORK AREA LINES (style=lined) ---

    2. How many vertices on the network diagram have an odd degree?   (1 mark)

      --- 1 WORK AREA LINES (style=lined) ---

    3. The total length of all edges in the network is 1180 metres.
    4. A journey starts and finishes at the house and travels along every edge in the network.
    5. Determine the shortest distance travelled.   (1 mark)

      --- 5 WORK AREA LINES (style=lined) ---

The total length of pipe that supplies water from the pump to the eight locations on the farm is a minimum.

This minimum length of pipe is laid along some of the edges in the network.

    1. On the diagram below, draw the minimum length of pipe that is needed to supply water to all locations on the farm.   (1 mark)

      --- 0 WORK AREA LINES (style=lined) ---


     NETWORKS, FUR2 2012 VCAA 1

    1. What is the mathematical term that is used to describe this minimum length of pipe in part i.?   (1 mark)

      --- 1 WORK AREA LINES (style=lined) ---

Show Answers Only

  1. i.  `160\ text(m)`
    ii.  `2`
    iii. `1250\ text(m)`
  2. i.
    NETWORKS, FUR2 2012 VCAA 1 Answer
    ii.
    `text(Minimal spanning tree)`

Show Worked Solution

a.i.   `text(Shortest distance)`

`=70 + 90`

`= 160\ text(m)`

MARKER’S COMMENT: Many students, surprisingly, had problems with part (a)(ii).


a.ii.   `2\ text{(the house and the top right vertex)}`
 

a.iii.   `text{An Eulerian path is possible if it starts at}`

♦♦ “Very poorly answered”.
MARKER’S COMMENT: An Euler circuit is optimal but not possible here because of the two odd degree vertices.

   `text{the house (odd vertex) and ends at the top}`

   `text{right vertex (the other odd vertex). However,}`

   `text{70 metres must be added to return to the}`

   `text{house.}`

`:.\ text(Total distance)` `= 1180 + 70`
  `= 1250\ text(m)`


b.i.    NETWORKS, FUR2 2012 VCAA 1 Answer


b.ii.   `text(Minimal spanning tree)`

Filed Under: Minimum Spanning Trees and Shortest Paths, Travelling Problems and Adjacency Matrices Tagged With: Band 3, Band 4, Band 5, smc-622-10-Euler, smc-624-10-Distance, smc-624-60-Shortest Paths

MATRICES, FUR2 2011 VCAA 2

To reduce the number of insects in a wetland, the wetland is sprayed with an insecticide.

The number of insects (`I`), birds (`B`), lizards (`L`) and frogs (`F`) in the wetland that has been sprayed with insecticide are displayed in the matrix `N` below.
 

`{:((qquadqquadqquadqquadI,qquadquad B,qquadL,\ qquadF)),(N = [(100\ 000, 400,1000,800)]):}`
 

Unfortunately, the insecticide, that is used to kill the insects can also kill birds, lizards and frogs. The proportion of insects, birds, lizards and frogs that have been killed by the insecticide are displayed in the matrix `D` below.
 

`{:(qquadqquadqquadquadquadtext(alive before spraying)),((qquadqquadqquadqquadI,qquad\ B,qquad\ L,qquad\ F)),(D = [(0.995,0,0,0),(0,0.05,0,0),(0,0,0.025,0),(0,0,0,0.30)]{:(I),(B),(L),(F):}{:qquadtext(dead after spraying):}):}`
 

  1. Evaluate the matrix product  `K = ND`.   (1 mark)

    --- 2 WORK AREA LINES (style=lined) ---

  2. Use the information in matrix `K` to determine the number of birds that have been killed by the insecticide.   (1 mark)

    --- 1 WORK AREA LINES (style=lined) ---

  3. Evaluate the matrix product  `M = KF`, where `F = [(0),(1),(1),(1)]`.   (1 mark)

    --- 3 WORK AREA LINES (style=lined) ---

  4. In the context of the problem, what information does matrix `M` contain?   (1 mark)

    --- 3 WORK AREA LINES (style=lined) ---

Show Answers Only
  1. `K = [(99\ 500,20,25,240)]`
  2. `20`
  3. `M = [285]`
  4. `M\ text(contains the combined number)`
    `text(of birds, lizards and frogs that died.)`
Show Worked Solution
a.    `K` `= ND`
    `= [(99\ 500,20,25,240)]`
MARKER’S COMMENT: In part (a), separating matrix elements by commas or dots is not correct notation.

 
b.
  `text(Birds dead after spraying) = 20`
 

c.    `M` `= KF`
    `= [(99\ 500,20,25,240)][(0),(1),(1),(1)]`
    `= [0 + 20 + 25 + 240]`
    `= [285]`
     
MARKER’S COMMENT: The ability of many students to interpret the result of a matrix product was poor.

d.   `text(Matrix)\ M\ text(contains the combined number)`

`text(of birds, lizards and frogs that died.)`


Filed Under: Matrix Applications Tagged With: Band 3, Band 4, smc-619-30-Matrix product and interpretation

MATRICES, FUR2 2011 VCAA 1

The diagram below shows the feeding paths for insects (`I`), birds (`B`) and lizards (`L`). The matrix `E` has been constructed to represent the information in this diagram. In matrix `E`, a 1 is read as "eat" and a  0  is read as "do not eat".
 

MATRICES, FUR2 2011 VCAA 11

  1. Referring to insects, birds or lizards
  2.  i. what does the 1 in column `B`, row `L`, of matrix `E` indicate?   (1 mark)

    --- 1 WORK AREA LINES (style=lined) ---

  3. ii. what does the row of zeros in matrix `E` indicate?   (1 mark)

    --- 1 WORK AREA LINES (style=lined) ---

The diagram below shows the feeding paths for insects (`I`), birds (`B`), lizards (`L`) and frogs (`F`).

The matrix `Z` has been set up to represent the information in this diagram.

Matrix `Z` has not been completed.
 

MATRICES, FUR2 2011 VCAA 12

  1. Complete the matrix `Z` above by writing in the seven missing elements.   (1 mark)

    --- 0 WORK AREA LINES (style=lined) ---

Show Answers Only

a.i.    `text(Birds eat lizards)`

a.ii.   `text(Insects, birds or lizards do not eat birds)`

b.
      `{:((qquadqquadquadI,B,L,F)),(Z = [(0,1,1,1),(0,0,0,0),(0,1,0,0),(0,1,1,0)]{:(I),(B),(L),(F):}):}`

Show Worked Solution

a.i.   `text(The 1 represents that birds eat lizards.)`
 

a.ii.   `text(It indicates that insects, birds or lizards DO NOT)`

   `text(eat birds.)`
 

b.    `{:((qquadqquadquadI,B,L,F)),(Z = [(0,1,1,1),(0,0,0,0),(0,1,0,0),(0,1,1,0)]{:(I),(B),(L),(F):}):}`

Filed Under: Matrix Applications Tagged With: Band 2, Band 3, Band 4, smc-619-10-Matrix from info/table, smc-619-40-Interpret Elements

MATRICES, FUR2 2013 VCAA 2

10 000 trout eggs, 1000 baby trout and 800 adult trout are placed in a pond to establish a trout population.

In establishing this population

    • eggs (`E`) may die (`D`) or they may live and eventually become baby trout (`B`)
    • baby trout (`B`) may die (`D`) or they may live and eventually become adult trout (`A`)
    • adult trout (`A`) may die (`D`) or they may live for a period of time but will eventually die.

From year to year, this situation can be represented by the transition matrix `T`, where
 

`{:(qquadqquadqquadqquadqquadtext(this year)),((qquadqquadqquadE,quad\ B,quad\ A,\ D)),(T = [(0,0,0,0),(0.4,0,0,0),(0,0.25,0.5,0),(0.6,0.75,0.5,1)]):}{:(),(),(E),(B),(A),(D):}{:(),(),(qquadtext(next year)):}`
 

  1. Use the information in the transition matrix `T` to
    1. determine the number of eggs in this population that die in the first year.   (1 mark)

      --- 2 WORK AREA LINES (style=lined) ---

    2. complete the transition diagram below, showing the relevant percentages.   (2 marks)


      --- 0 WORK AREA LINES (style=lined) ---

          Matrices, FUR2 2013 VCAA 2_a

The initial state matrix for this trout population, `S_0`, can be written as
 

`S_0 = [(10\ 000),(1000),(800),(0)]{:(E),(B),(A),(D):}`
 

Let `S_n` represent the state matrix describing the trout population after `n` years.

  1. Using the rule  `S_n = T S_(n-1)`, determine each of the following.


    1. `S_1`   (1 mark)

      --- 3 WORK AREA LINES (style=lined) ---

    2. the number of adult trout predicted to be in the population after four years   (1 mark)

      --- 3 WORK AREA LINES (style=lined) ---

  2. The transition matrix `T` predicts that, in the long term, all of the eggs, baby trout and adult trout will die.
    1. How many years will it take for all of the adult trout to die (that is, when the number of adult trout in the population is first predicted to be less than one)?   (1 mark)

      --- 2 WORK AREA LINES (style=lined) ---

    2. What is the largest number of adult trout that is predicted to be in the pond in any one year?   (1 mark)

      --- 3 WORK AREA LINES (style=lined) ---

  3. Determine the number of eggs, baby trout and adult trout that, if added to or removed from the pond at the end of each year, will ensure that the number of eggs, baby trout and adult trout in the population remains constant from year to year.   (2 marks)

    --- 4 WORK AREA LINES (style=lined) ---

The rule  `S_n = T S_(n – 1)`  that was used to describe the development of the trout in this pond does not take into account new eggs added to the population when the adult trout begin to breed.

  1. To take breeding into account, assume that 50% of the adult trout lay 500 eggs each year.
  2. The matrix describing the population after one year, `S_1`, is now given by the new rule
  3. `S_1 = T S_0 + 500\ M\ S_0`
  4. where      `T=[(0,0,0,0),(0.40,0,0,0),(0,0.25,0.50,0),(0.60,0.75,0.50,1.0)], M=[(0,0,0.50,0),(0,0,0,0),(0,0,0,0),(0,0,0,0)]\ text(and)\ S_0=[(10\ 000),(1000),(800),(0)]`
    1. Use this new rule to determine `S_1`.   (1 mark)

      --- 4 WORK AREA LINES (style=lined) ---

  5. This pattern continues so that the matrix describing the population after `n` years, `S_n`, is given by the rule
  6.       `S_n = T\ S_(n-1) + 500\ M\ S_(n-1)`
     

    1. Use this rule to determine the number of eggs in the population after two years   (2 marks)

      --- 6 WORK AREA LINES (style=lined) ---

Show Answers Only

a.i.   `6000`

a.ii.  `text(See Worked Solutions)`

b.i.   `S_1= [(0),(4000),(650),(7150)]`

b.ii. `S_4= [(0),(0),(331.25),(11\ 468.75)]`

c.i.   `text{13 years}`

c.ii.  `1325`

d.    `text(Add 10 000 eggs, remove 3000 baby trout and add 150)`

`text(150 adult trout to keep the population constant.)`

e.i.   `S_1= [(200\ 000),(4000),(650),(7150)]`

e.ii.   `text(See Worked Solutions)`

Show Worked Solution

a.i.   `text(60% of eggs die in 1st year,)`

`:.\ text(Eggs that die in year 1)`

`= 0.60 xx 10\ 000`

`= 6000`
 

MARKER’S COMMENT: A 100% cycle drawn at `D` was a common omission. Do not draw loops and edges of 0%!
a.ii.   

Matrices-FUR2-2013-VCAA-2_a Answer

b.i.    `S_1` `= TS_0`
    `= [(0,0,0,0),(0.4,0,0,0),(0,0.25,0.5,0),(0.6,0.75,0.5,1)][(10\ 000),(1000),(800),(0)]= [(0),(4000),(650),(7150)]`


b.ii.    `S_4` `= T^4S_0`
    `= [(0,0,0,0),(0.4,0,0,0),(0,0.25,0.5,0),(0.6,0.75,0.5,1)]^4[(10\ 000),(1000),(800),(0)]= [(0),(0),(331.25),(11\ 468.75)]`


`:. 331\ text(trout is the predicted population after 4 years.)`


c.i.    `S_12 = T^12S_0 = [(0),(0),(1.29),(11\ 791)]`

`S_13 = T^13S_0 = [(0),(0),(0.65),(11\ 799)]`
 

`:.\ text{It will take 13 years (when the trout population drops below 1).}`
 

c.ii.    `S_1 = TS_0 = [(0),(4000),(650),(7150)]`

`text(After 1 year, 650 adult trout.)`

`text(Similarly,)`

`S_2 = T^2S_0 = [(0),(0),(1325),(10\ 475)]`

`S_3 = T^3S_0 = [(0),(0),(662.5),(11\ 137.5)]`

`S_4 = T^4S_0 = [(0),(0),(331),(11\ 469)]`
 

`:.\ text(Largest number of adult trout = 1325.)`
 

d.    `S_0-S_1 = [(10\ 000),(1000),(800),(0)]-[(0),(4000),(650),(7150)] = [(10\ 000),(−3000),(150),(−7150)]`


`:.\ text(Add 10 000 eggs, remove 3000 baby trout and add 150 adult)`

`text(trout to keep the population constant.)`


e.i.    `S_1` `= TS_0 + 500MS_0`
    `= [(0),(4000),(650),(7150)] + 500 xx [(0,0,0.5,0),(0,0,0,0),(0,0,0,0),(0,0,0,0)][(10\ 000),(1000),(800),(0)]`
    `= [(0),(4000),(650),(7150)] + 500[(400),(0),(0),(0)]`
    `= [(200\ 000),(4000),(650),(7150)]`


e.ii.    `S_2` `= TS_1 + 500MS_1`
   

`= [(0,0,0,0),(0.4,0,0,0),(0,0.25,0.5,0),(0.6,0.75,0.5,1)][(200\ 000),(4000),(650),(7150)]`

       `+ 500 xx [(0,0,0.5,0),(0,0,0,0),(0,0,0,0),(0,0,0,0)][(200\ 000),(4000),(650),(7150)]`

    `= [(162\ 500),(80\ 000),(1325),(130\ 475)]`

Filed Under: Transition Matrices - Modified, Transition Matrices - Regular Tagged With: Band 3, Band 4, Band 5, Band 6, page-break-before-question, smc-1893-20-State Matrix in discrete period, smc-1893-32-4x4 Matrix, smc-618-20-Matrix to Diagram, smc-618-30-State Matrix in discrete period, smc-618-62-4x4 Matrix

MATRICES, FUR2 2013 VCAA 1

Five trout-breeding ponds, `P`, `Q`, `R`, `X` and `V`, are connected by pipes, as shown in the diagram below.
 

Matrices, FUR2 2013 VCAA 1 

The matrix `W` is used to represent the information in this diagram.

`{:({:\ qquadqquadqquadPquadQquad\ Rquad\ Xquad\ V:}),(W = [(0,1,1,1,0), (1,0,0,1,0),(1,0,0,1,0),(1,1,1,0,1),(0,0,0,1,0)]):}{:(),(P),(Q),(R),(X),(V):}`

In matrix `W`

•  the 1 in column 1, row 2, for example, indicates that a pipe directly connects pond `P` and pond `Q`

•  the 0 in column 1, row 5, for example, indicates that pond `P` and pond `V` are not directly connected by a pipe.

  1. Find the sum of the elements in row 3 of matrix `W`.   (1 mark)

    --- 1 WORK AREA LINES (style=lined) ---

  2. In terms of the breeding ponds described, what does the sum of the elements in row 3 of matrix `W` represent?   (1 mark)

    --- 2 WORK AREA LINES (style=lined) ---

The pipes connecting pond `P` to pond `R` and pond `P` to pond `X` are removed.

Matrix `N` will be used to show this situation. However, it has missing elements.

  1. Complete matrix `N` below by filling in the missing elements in row 1 and column 1.   (1 mark)

    --- 0 WORK AREA LINES (style=lined) ---

        
             Matrices, FUR2 2013 VCAA 1_c

Show Answers Only
  1. `2`
  2. `text(The sum means that 2 other)`
    `text(ponds connect directly to pond)\ R.`
  3.  
    `{:({:qquadqquadqquadPquadQquadRquadXquadV:}),(N = [(0,1,0,0,0),(1,0,0,1,0),(0,0,0,1,0),(0,1,1,0,1),(0,0,0,1,0)]):}{:(),(P),(Q),(R),(X),(V):}`
Show Worked Solution

a.   `1+ 0 + 0 +1+ 0 = 2`
 

b.   `text(The sum means that 2 other ponds)`

`text(connect directly to pond)\ R.`
 

c.    `{:({:qquadqquadqquadPquadQquad\ Rquad\ Xquad\ V:}),(N = [(0,1,0,0,0),(1,0,0,1,0),(0,0,0,1,0),(0,1,1,0,1),(0,0,0,1,0)]):}{:(),(P),(Q),(R),(X),(V):}`

Filed Under: Matrix Applications Tagged With: Band 2, Band 3, Band 4, smc-619-10-Matrix from info/table, smc-619-40-Interpret Elements, smc-619-80-Communication

MATRICES, FUR1 2008 VCAA 5 MC

The determinant of  `[(3, 2), (6, x)]`  is equal to 9.

The value of `x` is

A.  `– 7`

B.  `– 4.5`

C.      `1`

D.      `4.5`

E.      `7`

Show Answers Only

`E`

Show Worked Solution
`text(det) [(3, 2), (6, x)]` `= 3x – 2 xx 6`
 `:. 9` `= 3x – 12`
 `3x` `= 21`
 `x` `= 7`

`=>   E`

Filed Under: Simultaneous Equations Tagged With: Band 3, smc-617-30-Determinant

MATRICES, FUR1 2009 VCAA 7-8 MC

In a country town, people only have the choice of doing their food shopping at a store called Marks (`M`) or at a newly opened store called Foodies (`F`).

In the first week that Foodies opened, only 300 of the town’s 800 shoppers did their food shopping at Marks. The remainder did their food shopping at Foodies.
 

Part 1

A state matrix `S_1` that can be used to represent this situation is
 

A.   `S_1 = [[300],[800]]{:(M),(F):}`

B.   `S_1 = [[500],[300]]{:(M),(F):}`

C.   `S_1 = [[800],[300]]{:(M),(F):}`

D.   `S_1 = [[300],[500]]{:(M),(F):}`

E.   `S_1 = [[800],[500]]{:(M),(F):}`


Part 2

A market researcher predicts that

    • of those who do their food shopping at Marks this week, 70% will shop at Marks next week and 30% will shop at Foodies
    • of those who do their food shopping at Foodies this week, 90% will shop at Foodies next week and 10% will shop at Marks.

A transition matrix that can be used to represent this situation is
 

MATRICES, FUR1 2009 VCAA 7-8 MC ab

MATRICES, FUR1 2009 VCAA 7-8 MC cd

MATRICES, FUR1 2009 VCAA 7-8 MC e

Show Answers Only

`text(Part 1:)\ D`

`text(Part 2:)\ B`

Show Worked Solution

`text(Part 1)`

`=>  D`


`text(Part 2)`

`text(Columns must add up to 1.0,)`

`:.\ text(Eliminate)\ C\ text(and)\ D.`
 

`text(The information that 90% of Foodies)`

`text(shoppers stay means that)\ \ e_(FF) = 0.90.`

`:.\ text(Eliminate)\ A\ text(and)\ E.`

`=> B`

Filed Under: Transition Matrices - Regular Tagged With: Band 3, smc-618-10-Diagram/Info to Matrix, smc-618-30-State Matrix in discrete period, smc-618-60-2x2 Matrix

MATRICES, FUR1 2009 VCAA 6 MC

`T` is a transition matrix, where
 

`{:(qquadqquadqquadquadtext(from)),({:qquadqquadqquad\ PqquadQ:}),(T = [(0.6,0.7),(0.4,0.3)]{:(P),(Q):}{:qquadtext(to):}):}`
 

An equivalent transition diagram, with proportions expressed as percentages, is
 

MATRICES, FUR1 2009 VCAA 6 MC ab 1

MATRICES, FUR1 2009 VCAA 6 MC cd 1

MATRICES, FUR1 2009 VCAA 6 MC e


Show Answers Only

`C`

Show Worked Solution

`text(The loop at)\ P\ text(is 60% and)\ Q\ text(is 30%.)`

`=>  C`

Filed Under: Transition Matrices - Regular Tagged With: Band 3, smc-618-20-Matrix to Diagram, smc-618-60-2x2 Matrix

MATRICES, FUR1 2009 VCAA 4 MC

The matrix equation `[[4,2,8],[2,0,3],[0,3,−1]][[x],[y],[z]]=[[7],[2],[6]]` can be used to solve the system of simultaneous linear equations


A.    `4x + 2y + 8z = 7`
     `2x + 3y = 2`
     `3x - y = 6`


B.    `4x + 2y + 8z = 7`
     `2x + 3y = 2`
     `3y - z = 6`


C.    `4x + 2y + 8z = 7`
     `2y + 3z = 2`
     `3x - z = 6`


D.    `4x + 2y + 8z = 7`
     `2x + 3z = 2`
     `3y - z = 6`


E.    `4x + 2y + 8z = 7`
     `2x + 3z = 2`
     `3x - z = 6`


Show Answers Only

`D`

Show Worked Solution

`text(Expanding the matrix equation,)`

`4x + 2y + 8z = 7`

`2x + 3z = 2`

`3y – z = 6`

`=>  D`

Filed Under: Simultaneous Equations Tagged With: Band 3, smc-617-10-Matrix to SE

MATRICES, FUR1 2009 VCAA 2 MC

The matrix `[[12,15,3],[−6,0,24]]` can also be written as
 

A.   `[12,15,3] + [−6,0,24]`

B.   `[[12],[−6]] + [[15],[0] ]+ [[3],[24]]`

C.   `[[3],[6]] [[4,5,1],[−1,0,4]]`

D.   `1/3 × [[4,5,1],[−2,0,8]]`

E.   `3 × [[4,5,1],[−2,0,8]]`


Show Answers Only

`E`

Show Worked Solution

`=>  E`

Filed Under: Matrix Calculations Tagged With: Band 3, smc-616-10-Basic Calculations

MATRICES, FUR1 2012 VCAA 5 MC

There are two fast-food shops in a country town: Big Burgers (B) and Fast Fries (F).

Every week, each family in the town will purchase takeaway food from one of these shops.

The transition diagram below shows the way families in the town change their preferences for fast food from one week to the next.
 

MATRICES, FUR1 2012 VCAA 5 MC 
 

A transition matrix that provides the same information as the transition diagram is

MATRICES, FUR1 2012 VCAA 5 MC ab

MATRICES, FUR1 2012 VCAA 5 MC cd

MATRICES, FUR1 2012 VCAA 5 MC e

Show Answers Only

`D`

Show Worked Solution

MATRICES, FUR1 2012 VCAA 5 MC Answer

`{:(qquadqquadqquadqquadquad\ text(from)),({:qquadqquadqquadqquad\ BqquadquadF:}),( :. T = [(0.8,0.3),(0.2,0.7)]{:(B),(F):}qquadtext(to)):}`

`rArr D`

Filed Under: Transition Matrices - Regular Tagged With: Band 3, smc-618-10-Diagram/Info to Matrix, smc-618-60-2x2 Matrix

MATRICES, FUR1 2012 VCAA 4 MC

The diagram below shows the tracks directly linking four camping sites `P, Q, R` and `S` in a national park.

The shortest time that it takes to walk between the camping sites (in minutes), along each of these tracks, is also shown.
 

MATRICES, FUR1 2012 VCAA 4 MC

 
A matrix that could be used to present the same information is

MATRICES, FUR1 2012 VCAA 4 MC ab

MATRICES, FUR1 2012 VCAA 4 MC cd

MATRICES, FUR1 2012 VCAA 4 MC e

Show Answers Only

`E`

Show Worked Solution

`text(Presenting the “same information” involves)`

`text(recording the exact walk times in the matrix.)`

`rArr E`

Filed Under: Matrix Applications Tagged With: Band 3, smc-619-10-Matrix from info/table

MATRICES, FUR1 2013 VCAA 5 MC

Five students, Richard (R), Brendon (B), Lee (L), Arif (A) and Karl (K), were asked whether they played each of the following sports, football (F), golf (G), soccer (S) or tennis (T). Their responses are displayed in the table below.
 

MATRICES, FUR1 2013 VCAA 5 MC
 

If 1 is used to indicate that the student plays a particular sport and 0 is used to indicate that the student does not play a particular sport, which one of the following matrices could be used to represent the information in the table?
 

MATRICES, FUR1 2013 VCAA 5 MC ab1

MATRICES, FUR1 2013 VCAA 5 MC cd1

MATRICES, FUR1 2013 VCAA 5 MC e

Show Answers Only

`C`

Show Worked Solution

`rArr C`

Filed Under: Matrix Applications Tagged With: Band 3, smc-619-10-Matrix from info/table, smc-619-80-Communication

MATRICES, FUR1 2013 VCAA 2 MC

Matrix `A` has three rows and two columns.

Matrix `B` has four rows and three columns.

Matrix `C = B × A`  has 

A.   two rows and three columns.

B.   three rows and two columns.

C.   three rows and three columns.

D.   four rows and two columns.

E.   four rows and three columns.

Show Answers Only

`D`

Show Worked Solution
   `B` `xx`  `A` `=`   `C`
`4 xx 3`    `3 xx 2`     `4 xx 2`

`rArr D`

Filed Under: Matrix Calculations Tagged With: Band 3, smc-616-20-Order / (Un)Defined, smc-616-30-Matrix Product

MATRICES, FUR1 2006 VCAA 4 MC

Three teams, Blue (`B`), Green (`G`) and Red (`R`), compete for three different sporting competitions.

The table shows the competition winners for the past three years.
 

MATRICES, FUR1 2006 VCAA 4 MC
 

A matrix that shows the total number of competitions won by each of the three teams in each of these three years could be
 

MATRICES, FUR1 2006 VCAA 4 MC ab

MATRICES, FUR1 2006 VCAA 4 MC cd

MATRICES, FUR1 2006 VCAA 4 MC e

Show Answers Only

`B`

Show Worked Solution

`rArr B`

Filed Under: Matrix Applications Tagged With: Band 3, smc-619-10-Matrix from info/table

MATRICES, FUR1 2006 VCAA 3 MC

Let  `A = [(1,0), (0,1)], B = [(2,1), (1,0)]`  and  `C = [(1,-1), (-1,1)]`

Then  `A^3 (B - C)`  equals

A.    `[(1,2),(2,−1)]` B.    `[(1,0),(0,−1)]`
       
C.    `[(3,6),(6,−3)]` D.    `[(3,0),(0,−3)]`
       
E.    `[(5,10),(10,−5)]`    


Show Answers Only

`A`

Show Worked Solution
`A^3(B – C)` `= [(1,0),(0,1)]^3([(2,1),(1,0)] – [(1,−1),(−1,1)])`
  `= [(1,0),(0,1)][(1,2),(2,−1)]`
  `= [(1,2),(2,−1)]` 

`rArr A`

Filed Under: Matrix Calculations Tagged With: Band 3, smc-616-40-Powers/Inverse

MATRICES, FUR1 2006 VCAA 2 MC

Let  `A = [(-2), (0)], B = [(0, 9)]`  and  `C = [2]`

Using these matrices, the matrix product that is not defined is

A.   `AB`

B.   `AC`

C.   `BA`

D.   `BC`

E.   `CB`

Show Answers Only

`D`

Show Worked Solution

`text(Consider)\ D,`

   `B` `xx`  `C`
`1 xx 2`    `1 xx 1`


`text(Columns in)\ B !=\ text(Rows in)\ C`

`:. BC\ text(is undefined.)`

`rArr D`

Filed Under: Matrix Calculations Tagged With: Band 3, smc-616-20-Order / (Un)Defined

MATRICES, FUR1 2006 VCAA 1 MC

The matrix `[(12, 36), (0, 24)]` is equal to

A.    `12[(0,3),(0,2)]` B.    `12[(1,3),(0,2)]`
       
C.    `12[(0,24),(−12,12)]` D.    `12[(0,24),(0,12)]`
       
E.    `12[(1,3),(−12,2)]`    
Show Answers Only

`B`

Show Worked Solution
`12[(1,3),(0,2)]` `= [(12 xx 1, 12 xx 3),(12 xx 0,12 xx 2)]`
  `= [(12,36),(0,24)]`

`rArr B`

Filed Under: Matrix Calculations Tagged With: Band 3, smc-616-10-Basic Calculations

MATRICES, FUR2 2014 VCAA 1

A small city is divided into four regions: Northern (`N`), Eastern (`E`), Southern (`S`) and Western (`W`).

The number of adult males (`M`) and the number of adult females (`F`) living in each of the regions in 2013 is shown in matrix `V` below.

`{:(qquadqquadqquadqquadMqquadqquadF),(V = [(1360,1460), (1680,1920), (900,1060), (1850,1770)]):}{:(),(N), (E), (S), (W):}`

  1. Write down the order of matrix `V`.   (1 mark)

    --- 1 WORK AREA LINES (style=lined) ---

  2. How many adult males lived in the Western region in 2013?   (1 mark)

    --- 1 WORK AREA LINES (style=lined) ---

  3. In terms of the population of the city, what does the sum of the elements in the second column of matrix `V` represent?   (1 mark)

    --- 2 WORK AREA LINES (style=lined) ---

An election is to be held in the city.

All of the adults in each of the regions of the city will vote in the election.

One of the election candidates, Ms Aboud, estimates that she will receive 45% of the male votes and 55% of the female votes in the election.

This information is shown in matrix `P` below.

`P = [(0.45), (0.55)]{:(M), (F):}`

  1. Explain, in terms of rows and columns, why the matrix product `V × P` is defined.   (1 mark)

    --- 2 WORK AREA LINES (style=lined) ---

The product of matrices `V` and `P` is shown below.

`V xx P = [(1360     1460), (1680     1920), (    900     1060), (1850     1770)] xx [(0.45),(0.55)] = [(w), (1812), (988), (1806)]`

  1. Using appropriate elements from the matrix product `V × P`, write a calculation to show that the value of `w` is `1415`.   (1 mark)

    --- 2 WORK AREA LINES (style=lined) ---

  2. How many votes does Ms Aboud expect to receive in the election?   (1 mark) 

    --- 2 WORK AREA LINES (style=lined) ---

Show Answers Only
  1. `4 xx 2`
  2. `1850`
  3. `text(The total number of adult females living in the small city.)`
  4. `text(It is defined because the number)`
    `text(of columns in matrix)\ V\ text(equals the)`
    `text(number of rows in matrix)\ P.`
  5. `1415`
  6. `6021`
Show Worked Solution

a.   `4 xx 2`
 

b.   `1850`
 

c.   `text(The total number of adult females living in the small city.)`
 

d.   `text(It is defined because the number of columns in)`

`text(matrix)\ V\ text(equals the number of rows in matrix)\ P.`


e.    `w` `= 1360 xx 0.45 + 1460 xx 0.55`
    `= 1415`


f.   `text(Expected votes for Ms Aboud)`

`= 1415 + 1812 + 988 + 1806`

`= 6021`

Filed Under: Matrix Applications Tagged With: Band 3

GRAPHS, FUR2 2012 VCAA 1

The cost, `C`, in dollars, of making `n` phones, is shown by the line in the graph below.

GRAPHS, FUR2 2012 VCAA 1

    1. Calculate the gradient of the line, `C`, drawn above.  (1 mark)
    2. Write an equation for the cost, `C`, in dollars, of making `n` phones.  (1 mark)

  1. The revenue, `R`, in dollars, obtained from selling `n` phones is given by  `R = 150n`.

    1. Draw this line on the graph above.  (1 mark)
    2. How many phones would need to be sold to obtain $54 000 in revenue?  (1 mark)
  2. Determine the number of phones that would need to be made and sold to break even.  (1 mark) 
Show Answers Only
    1. `50`
    2. `C = 20\ 000 + 50n`
    1. `text(See Worked Solutions)`
    2. `360`
  1. `200`
Show Worked Solution

a.i.   `text{Using (0, 20 000) and (300, 35 000)}`

`text(Gradient)` `= (y_2 – y_1)/(x_2 – x_1)`
  `= (35\ 000 – 20\ 000)/(300 – 0)`
  `= 50`


a.ii.   `C = 50n + 20\ 000`


b.i.    GRAPHS, FUR2 2012 VCAA 1 Answer


b.ii.    `54\ 000` `= 150n`
  `:. n` `= (54\ 000)/150`
    `= 360`

`:. 360\ text(planes need to be sold.)`


c.   `text(Breakeven occurs when)`

`text(Revenue)` `=\ text(C)text(osts)`
`150n` `= 50n + 20\ 000`
`100n` `= 20\ 000`
`:. n` `= 200\ text(phones)`

Filed Under: Linear relationships Tagged With: Band 2, Band 3, Band 4

GEOMETRY, FUR2 2012 VCAA 4

`OABCD` has three triangular sections, as shown in the diagram below. 

Triangle `OAB` is a right-angled triangle. 

Length `OB` is 10 m and length `OC` is 14 m. 

Angle `AOB` = angle `BOC` = angle `COD` = 30°
 

Geometry and trigonometry, FUR2 2012 VCAA 4
 

  1. Calculate the length, `OA`.


    Write your answer, in metres, correct to two decimal places.  (1 mark)

  2. Determine the area of triangle `OAB`.


    Write your answer, in m², correct to one decimal place.  (1 mark)

  3. Triangles `OBC` and `OCD` are similar.


    The area of triangle `OBC` is 35 m².


    Find the area of triangle `OCD`, in m².  (2 marks)

  4. Determine angle `CDO`.


    Write your answer, correct to the nearest degree.  (2 marks)

Show Answers Only
  1. `8.66\ text{m  (2 d.p.)}`
  2. `21.7\ text{m²  (1 d.p.)}`
  3. `68.6\ text(m²)`
  4. `43^@\ \ text{(nearest degree)}`
Show Worked Solution

a.   `text(In)\ DeltaOAB,`

`cos30^@` `= (OA)/10`
`:. OA` `= 10 xx cos30`
  `= 8.660…`
  `= 8.66\ text{m  (2 d.p.)}`


b.   `text(Using the sine rule,)`

`text(Area)\ DeltaAOB` `= 1/2 ab sinC`
  `= 1/2 xx 8.66 xx 10 xx sin30^@`
  `= 21.65…`
  `= 21.7\ text{m²  (1 d.p.)}`


c.   `text(Linear scale factor) = 14/10 = 1.4`

`:. (text(Area)\ DeltaOCD)/(text(Area)\ DeltaOBC)` `= 1.4^2`
   
`:. text(Area)\ DeltaOCD` `= 35 xx 1.4^2`
  `= 68.6\ text(m²)`


d.   `text(In)\ DeltaBCO,`

`BC^2` `= 10^2 + 14^2 – 2 xx 10 xx 14 xx cos30^@`
  `= 53.51…`
`:. BC` `= 7.315…\ text(m)`


`text(Using the sine rule in)\ DeltaBCO,`

`(sin angleBCO)/10` `= (sin30^@)/(BC)`
`sin angleBCO` `= (10 xx sin30)/(7.315…)`
  `= 0.683…`
`:. angleBCO` `= 43.11^@`


`text(S)text(ince)\ DeltaBCO\ text(|||)\ DeltaCDO,`

`angleCDO` `= angleBCO`
  `= 43^@\ \ text{(nearest degree)}`

Filed Under: Similarity and Scale, Trig - Harder Applications Tagged With: Band 3, Band 4, Band 5, smc-606-30-Factors k / k^2 / k^3

GEOMETRY, FUR2 2012 VCAA 1

A rectangular block of land has width 50 metres and length 85 metres.

  1. Calculate the area of this block of land.


    Write your answer in m².  (1 mark)

In order to build a house, the builders dig a hole in the block of land.

The hole has the shape of a right-triangular prism, `ABCDEF`.

The width `AD` = 20 m, length `DC` = 25 m and height `EC` = 4 m are shown in the diagram below.

GEOMETRY, FUR2 2012 VCAA 11

  1. Calculate the volume of the right-triangular prism, `ABCDEF`.


    Write your answer in m³.  (1 mark)

Once the right-triangular prism shape has been dug, a fence will be placed along the two sloping edges, `AF` and `DE`, and along the edges `AD` and `FE`.

Geometry and trigonometry, FUR2 2012 VCAA 1_2

  1. Calculate the total length of fencing that will be required. 


    Write your answer, in metres, correct to one decimal place.  (1 mark)

Show Answers Only
  1. `4250\ text(m²)`
  2. `1000\ text(m³)`
  3. `90.6\ text(m)`
Show Worked Solution
a.    `text(Area)` `= 50 xx 85`
    `= 4250\ text(m²)`


b.    `V` `= Ah`
   `A` `= 1/2 xx 4 xx 25`
    `= 50\ text(m²)`


`:. V` `= 50 xx 20`
  `= 1000\ text(m³)`


c.   `text(Using Pythagoras in)\ DeltaECD,`

GEOMETRY, FUR2 2012 VCAA 1

`ED` `= sqrt(25^2 + 4^2)`
  `= sqrt(641)`
  `= 25.317…`


MARKER’S COMMENT: A poorly done question with many students failing to include the two 20 metre sections of fencing.

`:.\ text(Total length of fencing)`

`= 2 xx 20 + 2 xx 25.317…`

`= 90.635…`

`= 90.6\ text(m)`

Filed Under: Perimeter, Area and Volume Tagged With: Band 3, Band 4

CORE*, FUR2 2013 VCAA 1

Hugo is a professional bike rider.

The value of his bike will be depreciated over time using the flat rate method of depreciation.

The graph below shows his bike’s initial purchase price and its value at the end of each year for a period of three years.
 

  1. What was the initial purchase price of the bike?   (1 mark)

    --- 1 WORK AREA LINES (style=lined) ---

    1. Show that the bike depreciates in value by $1500 each year.   (1 mark)

      --- 3 WORK AREA LINES (style=lined) ---

    2. Assume that the bike’s value continues to depreciate by $1500 each year.
    3. Determine its value five years after it was purchased.   (1 mark)

      --- 4 WORK AREA LINES (style=lined) ---

The unit cost method of depreciation can also be used to depreciate the value of the bike.

In a two-year period, the total depreciation calculated at $0.25 per kilometre travelled will equal the depreciation calculated using the flat rate method of depreciation as described above.

  1. Determine the number of kilometres the bike travels in the two-year period.   (1 mark)

    --- 5 WORK AREA LINES (style=lined) ---

Show Answers Only

  1. `$8000`
  2. i.  `text(See Worked Solutions)`
    ii. `$500`
  3. `12\ 000\ text(km)`

Show Worked Solution

a.   `$8000`
  

b.i.   `text(Value after 1 year) = $6500`

`:.\ text(Annual depreciation)` `= 8000-6500`
  `= $1500`

  
b.ii.
   `text(Value after)\ n\ text(years)`

`= 8000-1500n`

`:.\ text(After 5 years,)`

`text(Value)` `= 8000-1500 xx 5`
  `= $500`

  
c.
   `text(After 2 years,)`

`text(Depreciation)` `= 2 xx 1500`
  `= $3000`

  
`:.\ text(Distance travelled)`

`= 3000/0.25`

`= 12\ 000\ text(km)`

Filed Under: Depreciation Tagged With: Band 2, Band 3, Band 4, smc-602-40-Comparing methods, smc-602-60-Depreciation graphs

GRAPHS, FUR2 2013 VCAA 2

Students at the camp can participate in two different watersport activities: canoeing and surfing.

The cost of canoeing is $30 per hour and the cost of surfing is $20 per hour.

The budget allows each student to spend up to $200, in total, on watersport activities.

The way in which a student decides to spend the $200 is described by the following inequality.

30 × hours canoeing + 20 × hours surfing ≤ 200

  1. Hillary wants to spend exactly two hours canoeing during the camp.


    Calculate the maximum number of hours she could spend surfing.  (1 mark)

  2. Dennis would like to spend an equal amount of time canoeing and surfing.


    If he spent a total of $200 on these activities, determine the maximum number of hours he could spend on each activity.  (1 mark)

Show Answers Only
  1. `7`
  2. `4\ text(hours)`
Show Worked Solution

a.   `text(Hillary spends 2 hrs canoeing)`

`text(Let)\ x = text(hours spent surfing)`

`30 xx 2 + 20x` `= 200`
`20x` `= 140`
`x` `= 7`

`:.\ text(Maximum hours surfing = 7)`


b.   `text(Let)\ t = text(time spent canoeing and surfing)`

`30 xx t + 20 xx t` `= 200`
`50t` `= 200`
`t` `= 4\ text(hours)`

`:.\ text(Dennis could spend a maximum)`

`text(of 4 hours on each activity.)`

Filed Under: Linear relationships Tagged With: Band 2, Band 3

GRAPHS, FUR2 2013 VCAA 1

The distance-time graph below shows the first two stages of a bus journey from a school to a camp.

GRAPHS, FUR2 2013 VCAA 1

  1. At what constant speed, in kilometres per hour, did the bus travel during stage 1 of the journey?  (1 mark)
  2. For how many minutes did the bus stop during stage 2 of the journey?  (1 mark)

The third stage of the journey is missing from the graph.

During stage 3, the bus continued its journey to the camp and travelled at a constant speed of 60 km/h for one hour.

  1. Draw a line segment on the graph above to represent stage 3 of the journey.  (1 mark)
  2. Find the average speed of the bus over the three hours.

    Write your answer in kilometres per hour.  (1 mark)

The distance, `D` km, of the bus from the school, `t` hours after departure is given by

`D = {(100t                      0 ≤ t ≤ 1.5), (150                        1.5 ≤ t ≤ 2), (60t + k            2≤ t ≤ 3):}`

  1. Determine the value of `k`.  (1 mark)
Show Answers Only
  1. `text(100 km/hr)`
  2. `text(30 minutes)`
  3. `text(See Worked Solutions)`
  4. `70\ text(km/hr)`
  5. `30`
Show Worked Solution

a.   `text(100 km/hr)`


b.   `text(30 minutes)`


c.    GRAPHS, FUR2 2013 VCAA 1 Answer


d.   `text(Average speed over 3 hours)`

♦ Mean mark of parts (c) and (d) consumed was 46%.

`= (text(Total distance))/3`

`= 210/3`

`= 70\ text(km/hr)`


e.   `text(When)\ t = 2,`

`D = 150,\ text(and)`

`D = 60 xx 2 + k`

`:. 120 + k` `= 150`
`:. k` `= 30`

Filed Under: Graph Applications Tagged With: Band 2, Band 3

GEOMETRY, FUR2 2013 VCAA 1

A spectator, `S`, in the grandstand of an athletics ground is 13 m vertically above point `G`.

Competitor `X`, on the athletics ground, is at a horizontal distance of 40 m from `G`.
  

Geometry and Trig, FUR2 2013 VCAA 1_1
 

  1. Find the distance, `SX`, correct to the nearest metre.  (1 mark)

Competitor `X` is 40 m from `G` and competitor `Y` is 52 m from `G`.

The angle `XGY` is 113°.
 

Geometry and Trig, FUR2 2013 VCAA 1_2
 

    1. Calculate the distance, `XY`, correct to the nearest metre.  (1 mark)
    2. Find the area of triangle `XGY`, correct to the nearest square metre.  (1 mark)
  1. Determine the angle of elevation of spectator `S` from competitor `Y`, correct to the nearest degree.

    Note that `X`, `G` and `Y` are on the same horizontal level.  (1 mark)
     

Geometry and Trig, FUR2 2013 VCAA 1_3

Show Answers Only
  1. `42\ text{m  (nearest m)}`
    1. `77\ text{m  (nearest m)}`
    2. `957\ text{m²  (nearest m²)}`
  2. `14^@\ \ text{(nearest degree)}`
Show Worked Solution

a.   `text(Using Pythagoras:)`

`SX^2` `= 40^2 + 13^2`
  `= 1769`
`:. SX` `= 42.05…`
  `= 42\ text{m  (nearest m)}`


b.i.   `text(Using the cosine rule:)`

`XY^2` `= 40^2 + 52^2 – 52^2 xx 40 xx 52cos113^@`
  `= 5929.44…`
`:. XY` `= 77.00…`
  `= 77\ text{m  (nearest m)}`


b.ii.   `text(Using the sine rule:)`

`text(Area)` `= 1/2ab sinC`
  `= 1/2 xx 40 xx 52 xx sin113^@`
  `= 957.32…`
  `= 957\ text{m²  (nearest m²)}`


c.    Geometry-FUR2-2013-VCAA-1 Answer
`theta` `= text(angle of elevation of)\ S\ text(from)\ Y`
`tantheta` `= 13/52`
`:. theta` `= tan^(−1)\ 1/4`
  `= 14.036…`
  `= 14^@\ \ text{(nearest degree)}`

Filed Under: Non-Right-Angled Trig, Right-Angled Trig and Angle Properties Tagged With: Band 3, Band 4, smc-3589-10-Sine rule, smc-3589-20-Cosine rule

CORE*, FUR2 2014 VCAA 2

A sponsor of the cricket club has invested $20 000 in a perpetuity.

The annual interest from this perpetuity is $750.

The interest from the perpetuity is given to the best player in the club every year, for a period of 10 years.

  1. What is the annual rate of interest for this perpetuity investment?   (1 mark)

    --- 3 WORK AREA LINES (style=lined) ---

  2. After 10 years, how much money is still invested in the perpetuity?   (1 mark)

    --- 1 WORK AREA LINES (style=lined) ---

  1. The average rate of inflation over the next 10 years is expected to be 3% per annum.
    1. Michael was the best player in 2014 and he considered purchasing cricket equipment that was valued at $750.
    2. What is the expected price of this cricket equipment in 2015?   (1 mark)

      --- 3 WORK AREA LINES (style=lined) ---

    3. What is the 2014 value of cricket equipment that could be bought for $750 in 2024?  Write your answer, correct to the nearest dollar.   (1 mark)

      --- 3 WORK AREA LINES (style=lined) ---

Show Answers Only

  1. `3.75`
  2. `$20\ 000`
    1. `$772.50`
    2. `$558\ \ text{(nearest dollar)}`

Show Worked Solution

a.    `20\ 000 xx r` `= 750`
  `:. r` `= 750/(20\ 000)`
    `= 0.0375`

 
`:.\ text(Annual interest rate = 3.75%)`
    

b.   `$20\ 000`

`text{(A perpetuity’s balance remains constant.)}`
  

c.i.   `text(Expected price in 2015)`

`= 750 xx (1 + 3/100)`

`= 750 xx 1.03`

`= $772.50`
  

c.ii.   `text(Value in 2014) xx (1.03)^10 = 750`

`:.\ text(Value in 2014)\ ` `= 750/((1.03)^10)`
  `= 558.07…`
  `= $558\ \ text{(nearest dollar)}`

Filed Under: Annuities and Perpetuities, Interest Rates and Investing Tagged With: Band 3, Band 4, Band 5, smc-2512-20-Perpetuity, smc-604-20-Compound interest

GRAPHS, FUR2 2014 VCAA 1

Fastgrow and Booster are two tomato fertilisers that contain the nutrients nitrogen and phosphorus.

The amount of nitrogen and phosphorus in each kilogram of Fastgrow and Booster is shown in the table below.

GRAPHS, FUR2 2014 VCAA 11

  1. How many kilograms of phosphorus are in 2 kg of Booster?  (1 mark)
  2. If 100 kg of Booster and 400 kg of Fastgrow are mixed, how many kilograms of nitrogen would be in the mixture?  (1 mark)

Arthur is a farmer who grows tomatoes.


He mixes quantities of Booster and Fastgrow to make his own fertiliser.


Let `x` be the number of kilograms of Booster in Arthur’s fertiliser.


Let `y` be the number of kilograms of Fastgrow in Arthur’s fertiliser.


Inequalities 1 to 4 represent the nitrogen and phosphorus requirements of Arthur’s tomato field.

  1.           Inequality 1 `x` `≥ 0`
              Inequality 2 `y` `≥ 0`
              Inequality 3 (nitrogen) `0.05x + 0.05y` `≥ 200`
              Inequality 4 (phosphorus)      `0.02x + 0.06y` `≥ 120`

Arthur’s tomato field also requires at least 180 kg of the nutrient potassium.


Each kilogram of Booster contains 0.06 kg of potassium.


Each kilogram of Fastgrow contains 0.04 kg of potassium.

  1. Inequality 5 represents the potassium requirements of Arthur’s tomato field.


    Write down Inequality 5 in terms of `x` and `y`.  (1 mark)


The lines that represent the boundaries of Inequalities 3, 4 and 5 are shown in the graph below.

GRAPHS, FUR2 2014 VCAA 12 

    1. Using the graph above, write down the equation of line `A`.  (1 mark)
    2. On the graph above, shade the region that satisfies Inequalities 1 to 5.  (1 mark)

(Answer on the graph above.)

Arthur would like to use the least amount of his own fertiliser to meet the nutrient requirements of his tomato field and still satisfy Inequalities 1 to 5.

    1. What weight of his own fertiliser will Arthur need to make?  (1 mark)
    2. On the graph above, show the point(s) where this solution occurs.  (2 marks)

(Answer on the graph above.)

Show Answers Only
  1. `0.04\ text(kg)`
  2. `25\ text(kg)`
  3. `0.06x + 0.04y ≥ 180`
    1. `0.02x + 0.06y = 120`
    2. `text(See Worked Solutions)`
    1. `4000\ text(kg)`
    2. `text(See Worked Solutions)`
  4.  
Show Worked Solution

a.   `text(Phosphorous in 2 kg of Booster)`

`=0.02× 2`

`= 0.04\ text(kg)`


b.  `text(Total Phosphorous)`

`=0.05×100 + 0.05× 400`

`= 25\ text(kg)`


c.   `text(Inequality 5,)`

`0.06x + 0.04y >= 180`


d.i.   `text(Line)\ A\ text(is the boundary of Inequality 4.)`

♦♦ Mean mark for parts (d) and (e) combined was 32%.
MARKER’S COMMENT: A majority of students didn’t identify Inequality 4 as relevant to Line A.

`:.\ text(It can be expressed)`

`0.02x + 0.06y = 120`


d.ii.   

GRAPHS, FUR2 2014 VCAA 1 Answer1


e.i.   `text(The minimum amount is on the boundary)`

`x+y=4000`

`:.\ text(Arthur will have to make at least 4000 kg.)`


e.ii.   `text(All points on the bold line are solutions,)`

`text{including (1000, 3000) and (3000, 1000).}`

GRAPHS, FUR2 2014 VCAA 1 Answer2 

Filed Under: Linear Programming Tagged With: Band 3, Band 4, Band 5

CORE*, FUR2 2015 VCAA 3

Jane and Michael decide to set up an annual music scholarship.

To fund the scholarship, they invest in a perpetuity that pays interest at a rate of 3.68% per annum.

The interest from this perpetuity is used to provide an annual $460 scholarship.

  1. Determine the minimum amount they must invest in the perpetuity to fund the scholarship.   (1 mark)

    --- 3 WORK AREA LINES (style=lined) ---

  2. For how many years will they be able to provide the scholarship?   (1 mark)

    --- 1 WORK AREA LINES (style=lined) ---

Show Answers Only
  1. `12\ 500`
  2. `text(It will last forever.)`
Show Worked Solution

a.   `text(Let)\ \ $A\ =\ text(Perpetuity amount)`

`3.68text(%) xx A` `= 460`
`:.A` `=460/0.0368`
  `= $12\ 500`


b.   `text(It will last forever.)`

Filed Under: Annuities and Perpetuities Tagged With: Band 3, Band 4, smc-2512-20-Perpetuity

CORE*, FUR2 2015 VCAA 1

Jane and Michael have started a business that provides music at parties.

The business charges customers $88 per hour.

The $88 per hour includes a 10% goods and services tax (GST).

  1. Calculate the amount of GST included in the $88 hourly rate.  (1 mark)

Jane and Michael’s first booking was a party where they provided music for four hours.

  1. Calculate the total amount they were paid for this booking.  (1 mark)

After six months of regular work, Jane and Michael decided to increase the hourly rate they charge by 12.5%.

  1. Calculate the new hourly rate (including GST).  (1 mark)
Show Answers Only
  1. `$8`
  2. `$352`
  3. `$99`
Show Worked Solution

a.   `text(Let)\ \ x=\ text(hourly rate before GST)`

`x +\ text(GST)` `= 88`
 `x+0.1x` `= 88`
`x` `=88/1.1`
  `=80`


`:.\ text(GST)\ = 88-80 = $8`


b.    `text(Total amount)` `=88 xx 4`
    `=$352`


c.    `text(New hourly rate including GST)`
   `= 88 + 88 xx 12.5 text(%)`
  `= 88 xx 1.125`
  `=$99`

Filed Under: Taxation and Other Tagged With: Band 3, Band 4, smc-605-10-GST, smc-605-20-% increase/decrease

GRAPHS, FUR2 2015 VCAA 4

The airline that Ben uses to travel to Japan charges for the seat and luggage separately.

The charge for luggage is based on the weight, in kilograms, of the luggage.

If the luggage is paid for at the airport, the graph below can be used to determine the cost, in dollars, of luggage of a certain weight, in kilograms. 

Graphs, FUR2 2015 VCAA 4

  1. Find the cost at the airport for 23 kg of luggage.  (1 mark)

If the luggage is paid for online prior to arriving at the airport, the equation for the relationship between the online cost, in dollars, and the weight, in kilograms, would be

`text(online cost) = {{:(75),(22.5 xx text(weight) - 375):} qquad {:(\ \ 0 < text(weight) <= 20),(20 < text(weight ≤ 40)):} :}`


  1. Find the online cost for 30 kg of luggage.  (1 mark)
  2. On the graph above, sketch a graph of the online cost of luggage for `0 <` weight `≤ 40`. Include the end points.  (2 marks)

(Answer on the graph above.)

  1. Determine the weight of luggage for which the airport cost and online cost are the same.
    Write your answer correct to one decimal place.  (1 mark)
Show Answers Only
  1. `$250`
  2. `$300`
  3.  

    Graphs-FUR2-2015-VCAA-4i

  4. `27.8\ text(kg)`
Show Worked Solution

a.   `$250`


b.    `text(Online cost)` `= 22.5 xx 30 – 375`
    `= 300\ text(dollars)`


c.   `text{Online cost (40 kg)}` `= 22.5 xx 40 – 375`
    `= 525`

`:.\ text(End points are)\ \ (0, 75) and (40, 525)`

Graphs-FUR2-2015-VCAA-4i


d.    `text(From the graph, the intersection`

`text(occurs when)`

`22.5 xx text(weight) – 375` `= 250`
`text(weight)` `= 625/22.5`
  `= 27.77…`
  `= 27.8\ text(kg)`

Filed Under: Graph Applications Tagged With: Band 3, Band 4, Band 5

GRAPHS, FUR2 2015 VCAA 3

The graph below shows the relationship between the yen and the dollar on the same day at a different currency exchange agency.

Graphs, FUR2 2015 VCAA 3

The points `(100, 8075)` and `(200, 17\ 575)` are labelled.

The equation for the relationship between the yen and the dollar is

yen = 95 × dollars – k

  1. Use the point `(100, 8075)` to show that the value of `k` is 1425.  (1 mark)
    1. Determine the intercept on the horizontal axis.  (1 mark)
    2. Interpret the intercept on the horizontal axis in the context of converting dollars to yen.  (1 mark)
Show Answers Only
  1. `text(Proof)\ \ text{(See Worked Solutions)}`
    1. `$15`
    2. `text(There is a $15 fixed charge for)`


      `text(any conversion of dollars into yen.)`

Show Worked Solution
a.    `text(Substituting)\ \ (100, 8075)\ \ text(into equation)`
  `8075` `= 95 xx 100 – k`
  `:. k` `= 9500 – 8075`
    `= 1425\ …\ text(as required)`


b.i.    `text(Intercept when yen) = 0`
  `0` `= 95 xx text(dollars) – 1425`
  `text(dollars)` `= 1425/95`
    `= 15`


`:.\ text(Intercept is at $15)`


b.ii.   `text(There is a $15 fixed charge for)`
  `text(any conversion of dollars into yen.)`

Filed Under: Linear relationships Tagged With: Band 3, Band 4

GRAPHS, FUR2 2015 VCAA 2

Ben will use a currency exchange agency to buy some Japanese yen (the Japanese currency unit).

The graph below shows the relationship between Japanese yen and Australian dollars on a particular day.

This graph can be used to calculate a conversion between dollars and yen on that day.

Graphs, FUR2 2015 VCAA 2

  1. Ben converts his dollars into yen using this graph.


    How many yen does he receive for $200?  (1 mark)

  2. The slope of this graph is the exchange rate for converting dollars into yen on that particular day.


    How many yen will Ben receive for each dollar?  (1 mark)

Show Answers Only
  1. `18\ 000\ text(yen)`
  2. `90\ text(yen)`
Show Worked Solution

a.   `18\ 000\ text(yen)`


b.   `text(Using)\ \ (0, 0) and (200, 18\ 000)`

`text(Slope)` `= (y_2 – y_1)/(x^2 – x^1)`
  `= (18\ 000 – 0)/(200 – 0)`
  `= 90`


`:.\ text(Ben will receive 90 yen for)`

`text(each dollar.)`

Filed Under: Linear relationships Tagged With: Band 3

GRAPHS, FUR2 2015 VCAA 1

Ben is flying to Japan for a school cultural exchange program.

The graph below shows the cost of a particular flight to Japan, in dollars, on each day in February.

Graphs, FUR2 2015 VCAA 1

  1. What is the cost, in dollars, of this flight to Japan on 19 February?  (1 mark)
  2. On how many days in February is the cost of this flight to Japan more than $1000?  (1 mark) 
Show Answers Only
  1. `$1200`
  2. `8`
Show Worked Solution

a.   `$1200`

b.   `8`

Filed Under: Graph Applications Tagged With: Band 2, Band 3

Calculus, MET2 2014 VCAA 3

In a controlled experiment, Juan took some medicine at 8 pm. The concentration of medicine in his blood was then measured at regular intervals. The concentration of medicine in Juan’s blood is modelled by the function  `c(t) = 5/2 te^(-(3t)/2), t >= 0`, where `c` is the concentration of medicine in his blood, in milligrams per litre, `t` hours after 8 pm. Part of the graph of the function `c` is shown below.
 

VCAA 2014 3a

  1. What was the maximum value of the concentration of medicine in Juan’s blood, in milligrams per litre, correct to two decimal places?   (1 mark)

    --- 2 WORK AREA LINES (style=lined) ---

    1. Find the value of `t`, in hours, correct to two decimal places, when the concentration of medicine in Juan’s blood first reached 0.5 milligrams per litre.   (1 mark)

      --- 2 WORK AREA LINES (style=lined) ---

    2. Find the length of time that the concentration of medicine in Juan’s blood was above 0.5 milligrams per litre. Express the answer in hours, correct to two decimal places.   (2 marks)

      --- 3 WORK AREA LINES (style=lined) ---

    1. What was the value of the average rate of change of the concentration of medicine in Juan’s blood over the interval  `[2/3, 3]`?
    2. Express the answer in milligrams per litre per hour, correct to two decimal places.   (2 marks)

      --- 5 WORK AREA LINES (style=lined) ---

    3. At times `t_1` and `t_2`, the instantaneous rate of change of the concentration of medicine in Juan's blood was equal to the average rate of change over the interval  `[2/3, 3]`.
    4. Find the values of `t_1` and `t_2`, in hours, correct to two decimal places.   (2 marks)

      --- 3 WORK AREA LINES (style=lined) ---

Alicia took part in a similar controlled experiment. However, she used a different medicine. The concentration of this different medicine was modelled by the function  `n(t) = Ate^(-kt),\ t >= 0`  where  `A`  and  `k in R^+`.

  1. If the maximum concentration of medicine in Alicia’s blood was 0.74 milligrams per litre at  `t = 0.5`  hours, find the value of `A`, correct to the nearest integer.  (3 marks)

    --- 6 WORK AREA LINES (style=lined) ---

Show Answers Only
  1. `0.61\ text(mg/L)`
  2.  i. `0.33\ text(hours)`
  3. ii. `0.86\ text(hours)`
  4.  i. `−0.23\ text(mg/L/h)`
  5. ii. `t = 0.90\ text(or)\ t = 2.12`
  6. `4`
Show Worked Solution

a.  `text(Solve:)\ \ c^{′}(t)=0\ text(for)\ t >= 0`

`t=2/3`

`c(2/3)= 0.61\ text(mg/L)`
 

b.i.    `text(Solve:)\ \ c(t)` `= 0.5\ text(for)\ t >= 0`

 `t=0.33\ \ text(or)\ \ t = 1.19`

`:. text(First reached 0.5 mg/L at)\ \ t = 0.33\ text(hours)`

MARKER’S COMMENT: In part (b)(ii), work to sufficient decimal places to ensure your answer has the required accuracy.


b.ii.    `text(Length)` `= 1.18756…-0.326268…`
    `= 0.86\ text(hours)`


c.i.    `text(Average ROC)` `= (c(3)-c(2/3))/(3-2/3)`
    `= (0.083-0.613)/(7/3)`
    `=-0.227…`
    `= −0.23\ text{mg/L/h  (2 d.p.)}`


c.ii.   `text(Solve:)\ \ cprime(t) = −0.22706…\ text(for)\ \ t >= 0`

♦ Mean mark part (c)(ii) 38%.

`:. t = 0.90\ \ text(or)\ \ t = 2.12\ text{h  (2 d.p.)}`
 

d.  `text(Solution 1)`

♦ Mean mark 46%.

`text(Equations from given information:)`

`n(1/2) = 0.74`

`0.74 = 1/2Ae^(−1/2k)\ …\ (1)`

`n^{′} (1/2) = 0`

`text(Solve simultaneously for)\ A and k\ \ text([by CAS])`

`:.A` `= 4.023`
  `= 4\ \ text{(nearest integer)}`

 
`text(Solution 2)`

`n(1/2) = 0.74`

`0.74 = 1/2Ae^(−1/2k)\ …\ (1)`

`n^{′}(t)` `=Ae^(- k/2)-1/2 Ake^(- k/2)`
  `=Ae^(- k/2) (1- k/2)\ …\ (2)`

 
`n^{′} (1/2) = 0`

`:. k=2\ \ text{(using equation (2))}`

`:.A` `= 4\ \ text{(nearest integer)}`

Filed Under: Maxima and Minima Tagged With: Band 3, Band 4, Band 5, smc-641-60-Other themes

Calculus, MET2 2014 VCAA 2

On 1 January 2010, Tasmania Jones was walking through an ice-covered region of Greenland when he found a large ice cylinder that was made a thousand years ago by the Vikings.

A statue was inside the ice cylinder. The statue was 1 m tall and its base was at the centre of the base of the cylinder.

VCAA 2014 2a

The cylinder had a height of `h` metres and a diameter of `d` metres. Tasmania Jones found that the volume of the cylinder was 216 m³. At that time, 1 January 2010, the cylinder had not changed in a thousand years. It was exactly as it was when the Vikings made it.

  1. Write an expression for `h` in terms of `d`.   (2 marks)

    --- 4 WORK AREA LINES (style=lined) ---

  2. Show that the surface area of the cylinder excluding the base, `S` square metres, is given by the rule  `S = (pi d^2)/4 + 864/d`.   (1 mark)

    --- 3 WORK AREA LINES (style=lined) ---

Tasmania found that the Vikings made the cylinder so that `S` is a minimum.

  1. Find the value of `d` for which `S` is a minimum and find this minimum value of `S`.   (2 marks)

    --- 5 WORK AREA LINES (style=lined) ---

  2. Find the value of `h` when `S` is a minimum.   (1 mark)

    --- 3 WORK AREA LINES (style=lined) ---

Show Answers Only
  1. `h = 864/(pi d^2)`
  2. `text(Proof)\ \ text{(See Worked Solutions)}`
  3. `12/(pi^(1/3))\ text(m);quad108pi^(1/3)\ text(square metres)`
  4. `6/(root(3)(pi))m`
Show Worked Solution
a.    `V` `= pir^2h`
  `216` `= pi(d/2)^2h`
  `:. h` `= (864)/(pi d^2)`


b.    `S` `= A_text(top) + A_text(curved surface)`
    `=pi xx (d/2)^2 + pi xx d xx h`

 
`text(Substitute)\ \ h = 864/(pid^2):`

`:. S` `= (pid^2)/4 + pi(d)(864/(pid^2))`
  `= (pid^2)/4 + 864/d`


c.  `(dS)/(dd) = (pi d)/2 -864/d^2`

`text(Stationary point when)\ \ (dS)/(dd)=0,`

`text(Solve:)\ \ (pi d)/2 -864/d^2=0\ \ text(for)\ d`

`d=12/(pi^(1/3))\ text(m)`

`:. S_text(min)=S(12/pi^(1/3)) = 108pi^(1/3)\ text(m²)`


d.   `text(Substitute)\ \ d=12/(pi^(1/3))\ \ text{into part (a):}`

♦ Mean mark (d) 42%.
MARKER’S COMMENT: An exact answer required here!

`h= 864/(pi(12/(pi^(1/3)))^2)`

   `= 6/(root(3)(pi))\ \ text(m)`

Filed Under: Maxima and Minima Tagged With: Band 3, Band 4, Band 5, smc-641-20-Surface Area

Algebra, MET2 2014 VCAA 1

The population of wombats in a particular location varies according to the rule  `n(t) = 1200 + 400 cos ((pi t)/3)`, where `n` is the number of wombats and `t` is the number of months after 1 March 2013.

  1. Find the period and amplitude of the function `n`.   (2 marks)

    --- 3 WORK AREA LINES (style=lined) ---

  2. Find the maximum and minimum populations of wombats in this location.   (2 marks)

    --- 2 WORK AREA LINES (style=lined) ---

  3. Find  `n(10)`.   (1 mark)

    --- 1 WORK AREA LINES (style=lined) ---

  4. Over the 12 months from 1 March 2013, find the fraction of time when the population of wombats in this location was less than  `n(10)`.   (2 marks)

    --- 6 WORK AREA LINES (style=lined) ---

Show Answers Only
  1. `text(Period) = text(6 months);\ text(Amplitude) = 400`
  2. `text(Max) = 1600;\ text(Min) = 800`
  3. `1000`
  4. `1/3`
Show Worked Solution

a.   `text(Period) = (2pi)/n = (2pi)/(pi/3) = 6\ text(months)`

MARKER’S COMMENT: Expressing the amplitude as [800,1600] in part (a) is incorrect.

`text(A)text(mplitude) = 400`
  

b.   `text(Max:)\ 1200 + 400 = 1600\ text(wombats)`

`text(Min:)\ 1200-400 = 800\ text(wombats)`
  

c.   `n(10) = 1000\ text(wombats)`
   

d.    `text(Solve)\ n(t)` `= 1000\ text(for)\ t ∈ [0,12]`

`t= 2,4,8,10`

`text(S)text(ince the graph starts at)\ \ (0,1600),`

♦ Mean mark 48%.

`=> n(t) < 1000\ \ text(for)`

`t ∈ (2,4)\ text(or)\ t ∈ (8,10)`

`:.\ text(Fraction)` `= ((4-2) + (10-8))/12`
  `= 1/3\ \ text(year)`

Filed Under: Trig Graphing Tagged With: Band 2, Band 3, Band 4, smc-2757-15-Cos, smc-2757-30-Find period, smc-2757-40-Find amplitude, smc-2757-80-Applications, smc-2757-85-Max/min (non-calc)

  • « Previous Page
  • 1
  • …
  • 46
  • 47
  • 48
  • 49
  • 50
  • …
  • 59
  • Next Page »

Copyright © 2014–2026 SmarterEd.com.au · Log in