The following network shows the distances, in kilometres, along a series of roads that connect town `A` to town `B.`

The shortest distance, in kilometres, to travel from town `A` to town `B` is
A. `9`
B. `10`
C. `11`
D. `12`
E. `13`
Aussie Maths & Science Teachers: Save your time with SmarterEd
The following network shows the distances, in kilometres, along a series of roads that connect town `A` to town `B.`
The shortest distance, in kilometres, to travel from town `A` to town `B` is
A. `9`
B. `10`
C. `11`
D. `12`
E. `13`

A mathematical term that could not be used to describe the graph shown above is
A. complete.
B. planar.
C. simple.
D. undirected.
E. tree.
Four workers, Anna, Bill, Caitlin and David, are each to be assigned a different task.
The table below gives the time, in minutes, that each worker takes to complete each of the four tasks.

The tasks are allocated so as to minimise the total time taken to complete the four tasks.
This total time, in minutes, is
A. `21`
B. `28`
C. `31`
D. `34`
E. `38`

`:.\ text(Minimum time)`
`= 7 + 5 + 15 + 4`
`= 31`
`=> C`
The network shows the activities that are needed to complete a particular project.

Part 1
The total number of activities that need to be completed before activity `L` may begin is
A. `2`
B. `4`
C. `6`
D. `7`
E. `8`
Part 2
The duration of every activity is initially 5 hours. For an extra cost, the completion times of both activity `F` and activity `K` can be reduced to 3 hours each.
If this is done, the completion time for the project will be
A. decreased by 2 hours.
B. decreased by 3 hours.
C. decreased by 4 hours.
D. decreased by 6 hours.
E. unchanged.
A connected planar graph has 10 edges and 10 faces.
The number of vertices for this graph is
Consider the following graph.

The smallest number of edges that need to be added to make this a connected graph is
The diagram shows the tasks that must be completed in a project.
Also shown are the completion times, in minutes, for each task.

The critical path for this project includes activities
A. `B and I.`
B. `C and H.`
C. `D and E.`
D. `F and K.`
E. `G and J.`
The map of Australia shows the six states, the Northern Territory and the Australian Capital Territory (ACT).

In the network diagram below, each of the vertices `A` to `H` represents one of the states or territories shown on the map of Australia. The edges represent a border shared between two states or between a state and a territory.

Part 1
In the network diagram, the order of the vertex that represents the Australian Capital Territory (ACT) is
A. `0`
B. `1`
C. `2`
D. `3`
E. `4`
Part 2
In the network diagram, Queensland is represented by
A. vertex A.
B. vertex B.
C. vertex C.
D. vertex D.
E. vertex E.
The graph below shows the one-step dominances between four farm dogs, Kip, Lab, Max, and Nim.
In this graph, an arrow from Lab to Kip indicates that Lab has a one-step dominance over Kip.

From this graph, it can be concluded that Kip has a two-step dominance over
A. Max only.
B. Nim only.
C. Lab and Nim only.
D. all of the other three dogs.
E. none of the other three dogs.

In the network shown, the number of vertices of even degree is
A. `2`
B. `3`
C. `4`
D. `5`
E. `6`

In the digraph above, all vertices are reachable from every other vertex.
All vertices would still be reachable from every other vertex if we remove the edge in the direction from
A. `Q` to `U`
B. `R` to `S`
C. `S` to `T`
D. `T` to `R`
E. `V` to `U`


How many of the four complete graphs above will have an Euler circuit?
A. `0`
B. `1`
C. `2`
D. `3`
E. `4`
`{:({:qquadqquadPquadQquadRquadS:}),({:(P),(Q),(R),(S):}[(0,0,2,1),(0,0,1,1),(2,1,0,1),(1,1,1,0)]):}`
The adjacency matrix above represents a planar graph with four vertices.
The number of faces (regions) on the planar graph is
A. `1`
B. `2`
C. `3`
D. `4`
E. `5`
`text(The graph can be represented)`

`rArr D`

The number of Hamiltonian circuits involving all five vertices in the graph above is
A. `0`
B. `1`
C. `2`
D. `3`
E. `4`
Four people, Ash (A), Binh (B), Con (C) and Dan (D), competed in a table tennis tournament.
In this tournament, each competitor played each of the other competitors once.
The results of the tournament are summarised in the directed graph below.
Each arrow shows the winner of a game played in the tournament. For example, the arrow from `C` to `A` shows that Con defeated Ash.

In the tournament, each competitor was given a ranking that was determined by calculating the sum of their one-step and two-step dominances. The competitor with the highest sum is ranked number one (1). The competitor with the second-highest sum was ranked number two (2), and so on.
Using this method, the rankings of the competitors in this tournament were
A. Dan (1), Ash (2), Con (3), Binh (4)
B. Dan (1), Ash (2), Binh (3), Con (4)
C. Con (1), Dan (2), Ash (3), Binh (4)
D. Ash (1), Dan (2), Binh (3), Con (4)
E. Ash (1), Dan (2), Con (3), Binh (4)
The number of edges needed to make a complete graph with four vertices is
A. `2`
B. `3`
C. `4`
D. `5`
E. `6`
The five musicians are to record an album. This will involve nine activities.
The activities and their immediate predecessors are shown in the following table.
The duration of each activity is not yet known.

--- 0 WORK AREA LINES (style=lined) ---

There is only one critical path for this project.
--- 5 WORK AREA LINES (style=lined) ---
The following table gives the earliest start times (EST) and latest start times (LST) for three of the activities only. All times are in hours.

--- 2 WORK AREA LINES (style=lined) ---
The minimum time required for this project to be completed is 19 hours.
--- 2 WORK AREA LINES (style=lined) ---
The duration of activity `C` is 3 hours.
--- 3 WORK AREA LINES (style=lined) ---

| a. | |
b. `text(Possible critical paths are,)`
`ADGI, BEGI\ text(or)\ CFHI`
`:.\ text(Non-critical activities)`
`= 9-4 = 5`
c. `text(Critical activities have zero slack time.)`
`:. A\ text(and)\ C\ text(are non-critical.)`
`:. B-E-G-I\ \ text(is the critical path.)`
| d. | `text(Duration of)\ \ I` | `= 19-12` |
| `= 7\ text(hours)` |
e. `text(Maximum time for)\ F\ text(and)\ H`
`=\ text(LST of)\ I-text(duration)\ C-text(slack time of)\ C`
`= 12-3-1`
`= 8\ text(hours)`
The five musicians, George, Harriet, Ian, Josie and Keith, compete in a music trivia game.
Each musician competes once against every other musician.
In each game there is a winner and a loser.
The results are represented in the dominance matrix, Matrix 1, and also in the incomplete directed graph below.
On the directed graph an arrow from Harriet to George shows that Harriet won against George.

--- 2 WORK AREA LINES (style=lined) ---
One of the edges on the directed graph is missing.
--- 0 WORK AREA LINES (style=lined) ---
The results of each trivia contest (one-step dominances) are summarised as follows.

In order to rank the musicians from first to last in the trivia contest, two-step (two-edge) dominances will be considered.
The following incomplete matrix, Matrix 2, shows two-step dominances.
`{:(qquadqquadqquadtext(Matrix 2)),(qquadqquad{:GquadHquadI\ quadJquad\ K:}),({:(G),(H),(I),(J),(K):}[(0,1,1,2,0),(1,0,1,1,1),(1,0,0,0,0),(0,0,1,0,1),(2,0,1,x,0)]):}`
--- 2 WORK AREA LINES (style=lined) ---
--- 2 WORK AREA LINES (style=lined) ---
--- 5 WORK AREA LINES (style=lined) ---

`text(over Keith who is in turn dominant over Ian.)`
a. `text(A musicians does not compete against him/herself.)`
b. `text(Josie won against George.)`
c. `text(Two step dominance occurs because George is dominant)`
`text(over Keith who is in turn dominant over Ian.)`
d. `text(Following the edges on network diagram:)`
`text(Keith over Harriet who beats Josie.)`
`text(Keith over Ian who beats Ian.)`
`:. x = 2`
| e. | `D_1 + D_2 =` | `[(0,1,2,2,1),(2,0,2,2,1),(1,0,0,1,0),(1,0,1,0,1),(2,1,2,3,0)]{:(G – 6),(H – 7),(I – 2),(J – 3),(K – 8):}` |
`text{Summing the rows (above),}`
`:.\ text{First is Keith (8), last is Ian (2).}`
A community centre is to be built on the new housing estate.
Nine activities have been identified for this building project.
The directed network below shows the activities and their completion times in weeks.

--- 2 WORK AREA LINES (style=lined) ---
--- 3 WORK AREA LINES (style=lined) ---
The builders of the community centre are able to speed up the project.
Some of the activities can be reduced in time at an additional cost.
The activities that can be reduced in time are `A`, `C`, `E`, `F` and `G`.
--- 2 WORK AREA LINES (style=lined) ---
The owner of the estate is prepared to pay the additional cost to achieve early completion.
The cost of reducing the time of each activity is $5000 per week.
The maximum reduction in time for each one of the five activities, `A`, `C`, `E`, `F`, `G`, is 2 weeks.
--- 3 WORK AREA LINES (style=lined) ---
--- 2 WORK AREA LINES (style=lined) ---
The estate has large open parklands that contain seven large trees.
The trees are denoted as vertices `A` to `G` on the network diagram below.
Walking paths link the trees as shown.
The numbers on the edges represent the lengths of the paths in metres.

--- 2 WORK AREA LINES (style=lined) ---
One day Jamie decides to go for a walk that will take him along each of the paths between the trees.
He wishes to walk the minimum possible distance.
i. State a vertex at which Jamie could begin his walk? (1 mark)
--- 1 WORK AREA LINES (style=lined) ---
--- 2 WORK AREA LINES (style=lined) ---
Michelle is currently at `F`.
She wishes to follow a route that can be described as the shortest Hamiltonian circuit.
--- 1 WORK AREA LINES (style=lined) ---
A new housing estate is being developed.
There are five houses under construction in one location.
These houses are numbered as points 1 to 5 below.

The builders require the five houses to be connected by electrical cables to enable the workers to have a supply of power on each site.
--- 1 WORK AREA LINES (style=lined) ---
--- 0 WORK AREA LINES (style=lined) ---

a. `text(Minimum number of edges = 4)`
b. `text(One of many possibilities:)`
The directed graph below shows the results of a chess competition between five players: Alex, Ben, Cindi, Donna and Elise.
Each arrow indicates the winner of individual games. For example, the arrow from Alex to Donna indicates that Alex beat Donna in their game.
The sum of their one-step and two-step dominances is calculated to give each player a dominance score. The dominance scores are then used to rank the players.
The ranking of the players in this competition, from highest to lowest dominance score, is
A. Ben, Elise, Donna, Alex, Cindi
B. Ben, Elise, Cindi, Donna, Alex
C. Ben, Elise, Donna, Cindi, Alex
D. Elise, Ben, Donna, Alex, Cindi
E. Elise, Ben, Donna, Cindi, Alex
The diagram below shows the network of roads that Stephanie can use to travel between home and school.
The numbers on the roads show the time, in minutes, that it takes her to ride a bicycle along each road.
Using this network of roads, the shortest time that it will take Stephanie to ride her bicycle from home to school is
A. `12\ text(minutes)`
B. `13\ text(minutes)`
C. `14\ text(minutes)`
D. `15\ text(minutes)`
E. `16\ text(minutes)`
The table below shows, in minutes, the duration, the earliest starting time (EST) and the latest starting time (LST) of eight activities needed to complete a project.

Which one of the following directed graphs shows the sequence of these activities?

The map below shows all road connections between five towns, `U`, `V`, `W`, `X` and `Y`.

A graph, shown below, was constructed to represent this map.

A mistake has been made in constructing this graph.
This mistake can be corrected by
A. drawing another edge between `V` and `W`.
B. drawing a loop at `W`.
C. removing the loop at `V`.
D. removing one edge between `U` and `V`.
E. removing one edge between `X` and `V`.
The rangers at the wildlife park restrict access to the walking tracks through areas where the animals breed.
The edges on the directed network diagram below represent one-way tracks through the breeding areas. The direction of travel on each track is shown by an arrow. The numbers on the edges indicate the maximum number of people who are permitted to walk along each track each day.

--- 2 WORK AREA LINES (style=lined) ---
One day, all the available walking tracks will be used by students on a school excursion.
The students will start at `A` and walk in four separate groups to `D`.
Students must remain in the same groups throughout the walk.
--- 1 WORK AREA LINES (style=lined) ---
--- 4 WORK AREA LINES (style=lined) ---

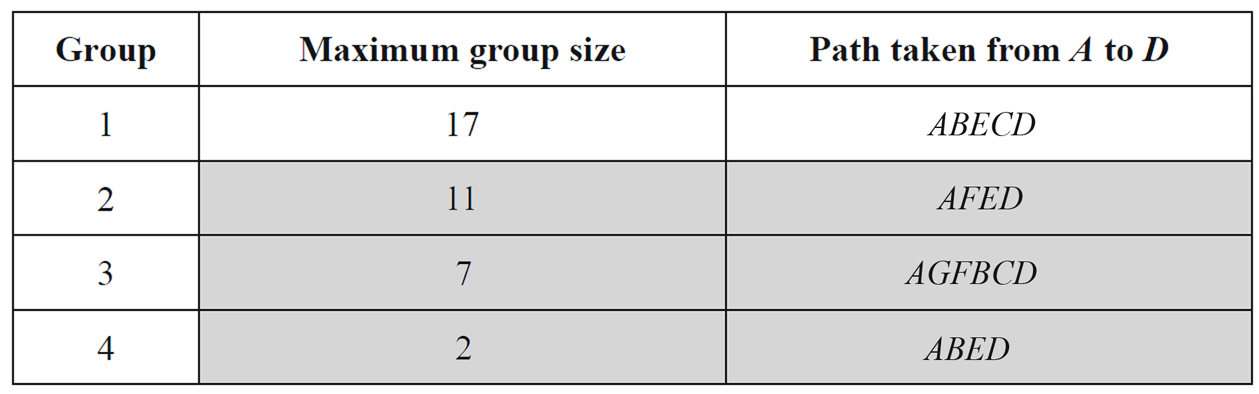
| a. | `text(Maximum flow)` | `=\ text(minimum cut through)\ CD and ED` |
| `= 24 + 13` | ||
| `= 37` |
`:.\ text(A maximum of 37 people can walk)`
`text(to)\ D\ text(from)\ A.`
b.i. `A-B-E-C-D`
b.ii. `text(One solution using the second possible largest)`
`text(group of 11 students and two groups from the)`
`text(remaining 9 students is:)`
A project will be undertaken in the wildlife park. This project involves the 13 activities shown in the table below. The duration, in hours, and predecessor(s) of each activity are also included in the table.
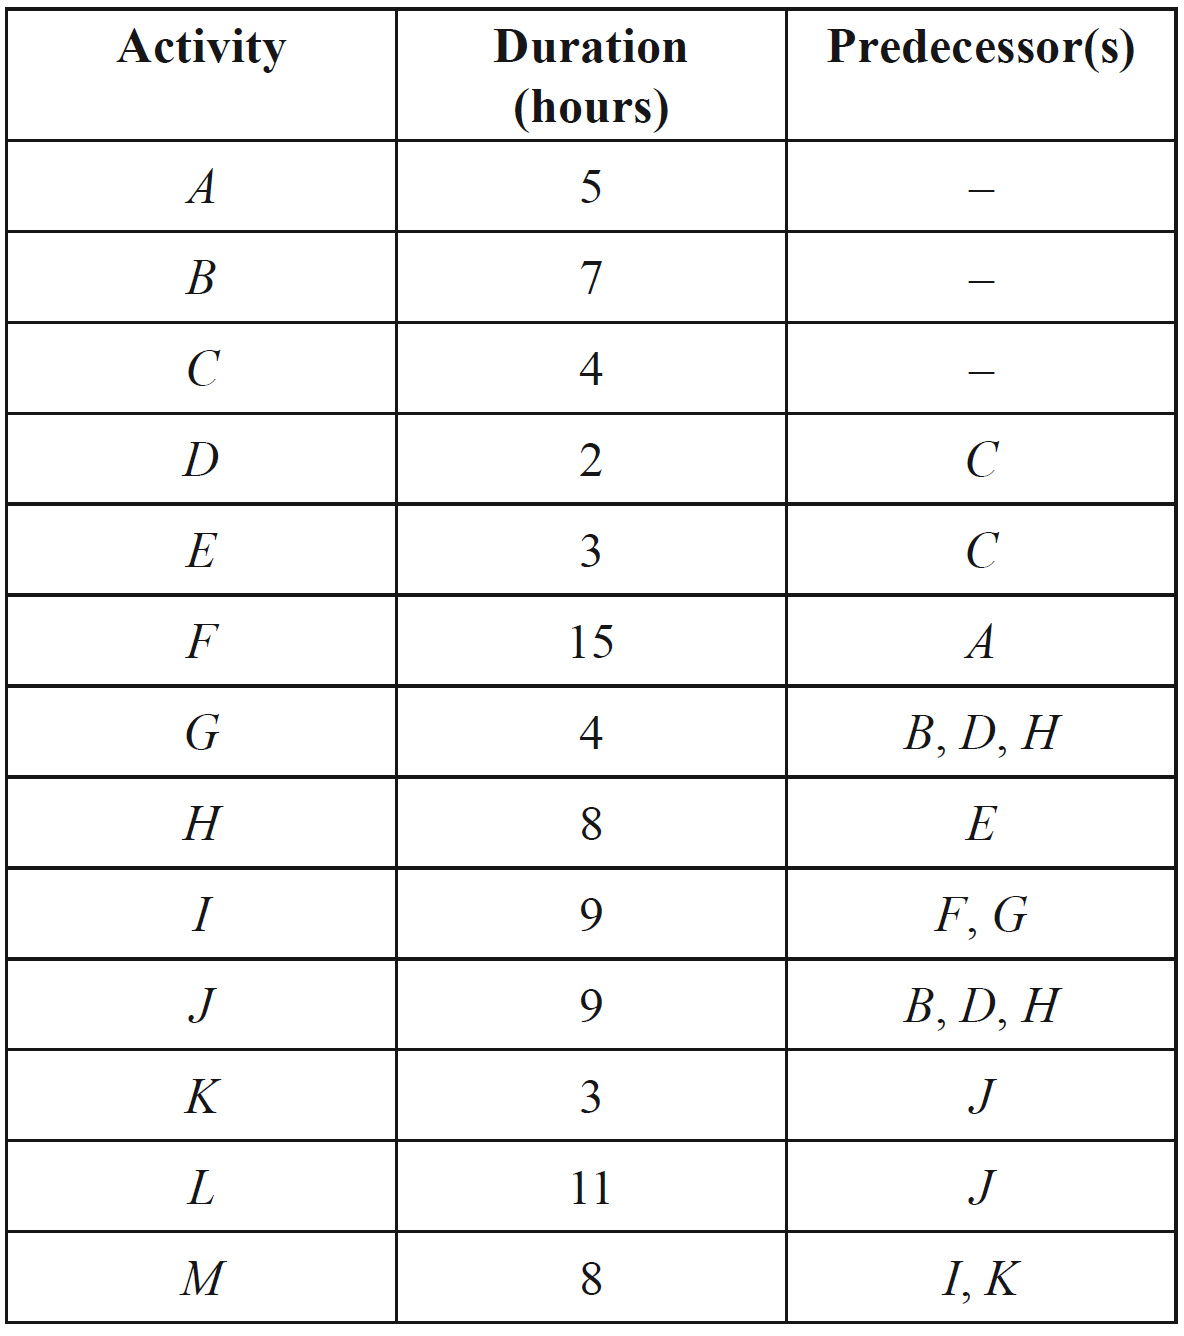
Activity `G` is missing from the network diagram for this project, which is shown below.

--- 0 WORK AREA LINES (style=lined) ---
--- 1 WORK AREA LINES (style=lined) ---
--- 1 WORK AREA LINES (style=lined) ---
--- 5 WORK AREA LINES (style=lined) ---
Explain the circumstances under which this statement will be true for this project. (1 mark)
--- 2 WORK AREA LINES (style=lined) ---
What will be the minimum completion time for the project? (1 mark)
--- 3 WORK AREA LINES (style=lined) ---

| a. | |
| b. | `text(EST of)\ H` | `= 4 + 3` |
| `= 7\ text(hours)` |
c.i. `A-F-I-M`
| c.ii. |  |
`G\ text(precedes)\ I`
`:. text(LST of)\ G = 20-4 = 16\ text(hours)`
`:. text(LST of)\ D = 16-2 = 14\ text(hours)`
d. `text(The statement will only be true if the crashed activity)`
`text(is on the critical path)\ \ A-F-I-M.`
e. `A-F-I-M\ text(is 37 hours.)`
`text(If)\ F\ text(is crashed by 2 hours, the new)`
`text(new critical path is)`
`C-E-H-G-I-M\ text{(36 hours)}`
`:.\ text(Minimum completion time = 36 hours)`
The children are taken to the zoo where they observe the behaviour of five young male lion cubs. The lion cubs are named Arnold, Barnaby, Cedric, Darcy and Edgar. A dominance hierarchy has emerged within this group of lion cubs. In the directed graph below, the directions of the arrows show which lions are dominant over others.

--- 2 WORK AREA LINES (style=lined) ---
--- 1 WORK AREA LINES (style=lined) ---
In determining the final order of dominance, the number of one-step dominances and two-step dominances are added together.
--- 3 WORK AREA LINES (style=lined) ---

Over time, the pattern of dominance changes until each lion cub has a one-step dominance over two other lion cubs.
--- 3 WORK AREA LINES (style=lined) ---

a. `text(One step dominances:)`
`text{Arnold and Edgar (1 each)}`
`text{Barnaby and Cedric (2 each)}`
b. `text(Edgar)`
| c. |  |
d. `text(Each lion has a one step dominance over 2 others.)`
`=>\ text(Each lion must have a two step)`
`text(dominance over 2 × 2 = 4 lions)`
`:.\ text(Total 2 step dominances in group)`
`= 5 xx 4`
`= 20`
Each of four children is to be driven by his or her parents to one of four different concerts. The following table shows the distance that each car would have to travel, in kilometres, to each of the four concerts.

The concerts will be allocated so as to minimise the total distance that must be travelled to take the children to the concerts. The hungarian algorithm is to be used to find this minimum value.
--- 0 WORK AREA LINES (style=lined) ---

After further steps of the hungarian algorithm have been applied, the table is as follows.

It is now possible to allocate each child to a concert.
--- 2 WORK AREA LINES (style=lined) ---
--- 0 WORK AREA LINES (style=lined) ---

--- 3 WORK AREA LINES (style=lined) ---


| a. | |
b. `text(She is the only child with a zero in the)`
`text(column for Concert 2.)`
c. `text(A possibility:)`
`text{(*3, 1, 4, 2 was also accepted.)}`
d. `text(Minimum total distance)`
`= 18 + 15 + 13 + 10`
`= 56\ text(km)`
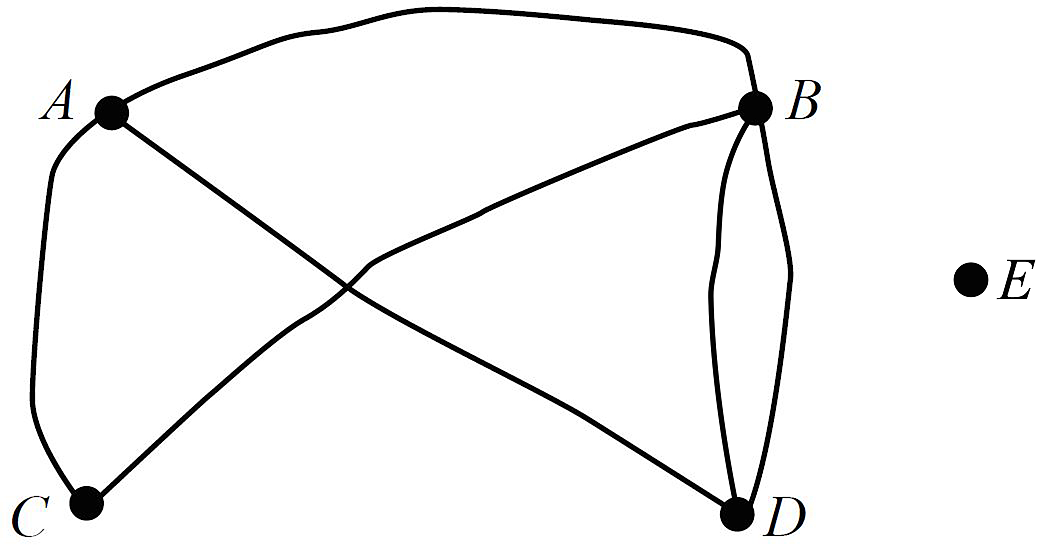
Four children, James, Dante, Tahlia and Chanel each live in a different town.
The following is a map of the roads that link the four towns, `A`, `B`, `C` and `D`.

--- 5 WORK AREA LINES (style=lined) ---
James’ father has begun to draw a network diagram that represents all the routes between the four towns on the map. This is shown below.

In this network, vertices represent towns and edges represent routes between tow
--- 0 WORK AREA LINES (style=lined) ---
--- 3 WORK AREA LINES (style=lined) ---

b.ii. `text(See worked solution)`
a. `text(Let the two unnamed intersections be)\ T_1\ text{(top) and}\ T_2.`
`text(The possible paths are:)`
`ACD, ACT_2BD, ACT_2T_1BD, AT_1T_2CD,`
`AT_1T_2BD, AT_1BD, AT_1,BT_2CD.`
`:. 7\ text(different ways from)\ A\ text(to)\ D.`
| b.i. | |
b.ii. `text(Driving each route once and arriving back at)`
`A\ text(requires an Eulerian circuit where all)`
`text(vertices must be an even degree.)`
`text(The vertices at)\ C\ text(and)\ B\ text(are odd.)`
`:.\ text(No Eulerian circuit exists.)`
James, Dante, Tahlia and Chanel are four children playing a game.
In this children’s game, seven posts are placed in the ground.
The network below shows distances, in metres, between the seven posts.
The aim of the game is to connect the posts with ribbon using the shortest length of ribbon.
This will be a minimal spanning tree.

--- 0 WORK AREA LINES (style=lined) ---

--- 2 WORK AREA LINES (style=lined) ---
--- 1 WORK AREA LINES (style=lined) ---
| a. |  |
`text(or)`

b. `text(Length of minimal spanning tree)`
`= 4 + 2 + 2 + 3 + 2 + 3`
`= 16\ text(metres)`
c. `2`
A walkway is to be built across the lake.
Eleven activities must be completed for this building project.
The directed network below shows the activities and their completion times in weeks.

--- 1 WORK AREA LINES (style=lined) ---
--- 1 WORK AREA LINES (style=lined) ---
Determine the longest float time, in weeks, on the supervisor’s list. (1 mark)
--- 1 WORK AREA LINES (style=lined) ---
A twelfth activity, `L`, with duration three weeks, is to be added without altering the critical path.
Activity `L` has an earliest start time of four weeks and a latest start time of five weeks.
--- 0 WORK AREA LINES (style=lined) ---
Determine the total overall time, in weeks, for the completion of this building project. (1 mark)
--- 4 WORK AREA LINES (style=lined) ---

a. `7\ text(weeks)`
b. `BDFGIK`
c. `H\ text(or)\ J\ text(can be delayed for a maximum)`
`text(of 3 weeks.)`
| d. | |
e. `text(The new critical path is)\ BLEGIK.`
`L\ text(now takes 7 weeks.)`
`:.\ text(Time for completion)`
`= 4 + 7 + 1 + 5 + 2 + 6`
`= 25\ text(weeks)`
The city of Robville contains eight landmarks denoted as vertices `N` to `U` on the network diagram below. The edges on this network represent the roads that link the eight landmarks. --- 1 WORK AREA LINES (style=lined) --- --- 1 WORK AREA LINES (style=lined) --- --- 1 WORK AREA LINES (style=lined) --- --- 2 WORK AREA LINES (style=lined) --- --- 2 WORK AREA LINES (style=lined) ---

Regardless of which route Steven decides to take, how many of the landmarks (including those at the start and finish) will he see on exactly two occasions? (1 mark)
The city of Robville is divided into five suburbs labelled as `A` to `E` on the map below.
A lake which is situated in the city is shaded on the map.

An adjacency matrix is constructed to represent the number of land borders between suburbs.
`{:({:qquadqquadAquadBquadCquadDquadE:}),({:(A),(B),(C),(D),(E):}[(0,1,1,1,0),(1,0,1,2,0),(1,1,0,0,0),(1,2,0,0,0),(0,0,0,0,0)]):}`
--- 1 WORK AREA LINES (style=lined) ---
In the network diagram below, vertices represent suburbs and edges represent land borders between suburbs.
The diagram has been started but is not finished.

On the diagram
--- 0 WORK AREA LINES (style=lined) ---
--- 0 WORK AREA LINES (style=lined) ---
a. `E\ text(has no land borders with other suburbs.)`
| b.i. & ii. | |
In the final challenge, each of four teams has to complete a construction project that involves activities `A` to `I`.

Table 1 shows the earliest start time (EST), latest start time (LST) and duration, in minutes, for each activity.
The immediate predecessor is also shown. The earliest start time for activity `F` is missing.
--- 1 WORK AREA LINES (style=lined) ---
--- 2 WORK AREA LINES (style=lined) ---
--- 1 WORK AREA LINES (style=lined) ---
--- 2 WORK AREA LINES (style=lined) ---
--- 3 WORK AREA LINES (style=lined) ---
--- 1 WORK AREA LINES (style=lined) ---
The following network diagram shows the distances, in kilometres, along the roads that connect six intersections `A`, `B`, `C`, `D`, `E` and `F`.

--- 1 WORK AREA LINES (style=lined) ---
Teams have to start and finish at intersection `A`.
The blue team does this and cycles the shortest possible total distance.
i. Apart from intersection `A`, through which intersections does the blue team pass more than once? (1 mark)
--- 2 WORK AREA LINES (style=lined) ---
--- 2 WORK AREA LINES (style=lined) ---
This route allows the red team to ride along every road only once.
Which two intersections does the bush path connect? (1 mark)
--- 2 WORK AREA LINES (style=lined) ---
Stormwater enters a network of pipes at either Dunlop North (Source 1) or Dunlop South (Source 2) and flows into the ocean at either Outlet 1 or Outlet 2. On the network diagram below, the pipes are represented by straight lines with arrows that indicate the direction of the flow of water. Water cannot flow through a pipe in the opposite direction. The numbers next to the arrows represent the maximum rate, in kilolitres per minute, at which stormwater can flow through each pipe. --- 0 WORK AREA LINES (style=lined) --- --- 5 WORK AREA LINES (style=lined) --- A length of pipe, show in bold on the network diagram below, has been damaged and will be replaced with a larger pipe. --- 3 WORK AREA LINES (style=lined) ---

![]()

a. `text(Storm water from Source 2 cannot reach Outlet 1)` `:.\ text(Maximum rates are)` `text(Outlet 1: 700 kL/min)` `text(Outlet 2: 700 kL/min)` c. `text(The next smallest cut in the lower pipe system is 800.)` `:.\ text(The minimum flow through the new pipe that will achieve)` `text(this is 300 kL/min.)`Show Worked Solution
♦ Mean mark of all parts (combined) was 35%.
b.

`text(The minimum cut includes the 200 kL/min pipe from Source 1.)`
A section of the Farnham showgrounds has flooded due to a broken water pipe. The public will be stopped from entering the flooded area until repairs are made and the area has been cleaned up.
The table below shows the nine activities that need to be completed in order to repair the water pipe. Also shown are some of the durations, Earliest Start Times (EST) and the immediate predecessors for the activities.

--- 2 WORK AREA LINES (style=lined) ---
--- 1 WORK AREA LINES (style=lined) ---
--- 1 WORK AREA LINES (style=lined) ---
It is more complicated to replace the broken water pipe (Activity `E`) than expected. It will now take four hours to complete instead of two hours.
--- 2 WORK AREA LINES (style=lined) ---
Turning on the water to the showgrounds (Activity `H`) will also take more time than originally expected. It will now take five hours to complete instead of one hour.
--- 2 WORK AREA LINES (style=lined) ---
At the Farnham showgrounds, eleven locations require access to water. These locations are represented by vertices on the network diagram shown below. The dashed lines on the network diagram represent possible water pipe connections between adjacent locations. The numbers on the dashed lines show the minimum length of pipe required to connect these locations in metres.

All locations are to be connected using the smallest total length of water pipe possible.
--- 0 WORK AREA LINES (style=lined) ---
--- 3 WORK AREA LINES (style=lined) ---

| a. | |
b. `text(Total length of water pipe)`
`= 60 + 60 + 40 + 60 + 50 + 40 + 60`
`+ 40 + 50 + 50`
`= 510\ text(metres)`
Aden, Bredon, Carrie, Dunlop, Enwin and Farnham are six towns.
The network shows the road connections and distances between these towns in kilometres.

--- 2 WORK AREA LINES (style=lined) ---
--- 4 WORK AREA LINES (style=lined) ---
An engineer plans to inspect all of the roads in this network.
He will start at Dunlop and inspect each road only once.
--- 1 WORK AREA LINES (style=lined) ---
Another engineer decides to start and finish her road inspection at Dunlop.
If an assistant inspects two of the roads, this engineer can inspect the remaining six roads and visit each of the other five towns only once.
--- 3 WORK AREA LINES (style=lined) ---
Part of the graph of the function `f: R-> R, f(x) = -x^2 + ax + 12` is shown below. If the shaded area is 45 square units, find the values of `a, m` and `n` where `m` and `n` are the `x`-axis intercepts of the graph of `y = f(x).` (5 marks)

To restore a vintage train, 13 activities need to be completed.
The network below shows these 13 activities and their completion times in hours.

--- 1 WORK AREA LINES (style=lined) ---
The minimum time in which all 13 activities can be completed is 21 hours.
--- 3 WORK AREA LINES (style=lined) ---
--- 4 WORK AREA LINES (style=lined) ---
Just before they started restoring the train, the members of the club needed to add another activity, `X`, to the project.
Activity `X` will take seven hours to complete.
Activity `X` has no predecessors, but must be completed before activity `G` starts.
--- 6 WORK AREA LINES (style=lined) ---
Activity `A` can be crashed by up to four hours at an additional cost of $90 per our.
This may reduce the minimum completion time for the project, including activity `X`.
--- 8 WORK AREA LINES (style=lined) ---
The diagram below shows a network of train lines between five towns: Attard, Bower, Clement, Derrin and Eden.
The numbers indicate the distances, in kilometres, that are travelled by train between connected towns.

Charlie followed an Eulerian path through this network of train lines.
--- 1 WORK AREA LINES (style=lined) ---
ii. What distance did he travel? (1 mark)
--- 2 WORK AREA LINES (style=lined) ---
Brianna will follow a Hamiltonian path from Bower to Attard.
--- 2 WORK AREA LINES (style=lined) ---
The train line between Derrin and Eden will be removed. If one other train line is removed from the network, Andrew would be able to follow an Eulerian circuit through the network of train lines.
In the boxes below, write down the pair of towns that this train line connects. (1 mark)
--- 0 WORK AREA LINES (style=lined) ---

Planning a train club open day involves four tasks.
Table 1 shows the number of hours that each club member would take to complete these tasks.

The Hungarian algorithm will be used to allocate the tasks to club members so that the total time taken to complete the tasks is minimised.
The first step of the Hungarian algorithm is to subtract the smallest element in each row of Table 1 from each of the elements in that row.
The result of this step is shown in Table 2 below.
--- 0 WORK AREA LINES (style=lined) ---

After completing Table 2, Andrew decided that an allocation of tasks to minimise the total time taken was not yet possible using the Hungarian algorithm.
--- 2 WORK AREA LINES (style=lined) ---
Table 3 shows the final result of all steps of the Hungarian algorithm.

--- 1 WORK AREA LINES (style=lined) ---
--- 2 WORK AREA LINES (style=lined) ---

| a. | |
b. `text(The minimum number of lines to cover all zeros)`
`text(is less than four.)`
c.i. `text(Equipment)`
c.ii. `text(Total hours to plan)`
`= 8 +10 +10 + 8`
`= 36`
Nine activities are needed to prepare a daily delivery of groceries from the factory to the towns.
The duration, in minutes, earliest starting time (EST) and immediate predecessors for these activities are shown in the table below.

The directed network that shows these activities is shown below.

All nine of these activities can be completed in a minimum time of 26 minutes.
--- 1 WORK AREA LINES (style=lined) ---
--- 1 WORK AREA LINES (style=lined) ---
--- 1 WORK AREA LINES (style=lined) ---
--- 1 WORK AREA LINES (style=lined) ---
One Monday, Donna is sick and both activities `C` and `D` must be completed by Cassie. Cassie must complete one of these activities before starting the other.
What is the least effect of this on the usual minimum preparation time for the delivery of groceries from the factory to the five towns? (1 mark)
--- 1 WORK AREA LINES (style=lined) ---
--- 0 WORK AREA LINES (style=lined) ---
--- 1 WORK AREA LINES (style=lined) ---

a. `text(3 minutes)`
b. `text(4 minutes)`
c. `text(3 minutes)`
d. `A-C-F-H-I`
e. `text(The critical path is increased by 7 minutes)`
`text(to 33 minutes.)`
| f.i. | |
f.ii. `text(The critical path is increased by 2 minutes)`
`text(to 28 minutes.)`
The factory supplies groceries to stores in five towns, `Q`, `R`, `S`, `T` and `U`, represented by vertices on the graph below.

The edges of the graph represent roads that connect the towns and the factory.
The numbers on the edges indicate the distance, in kilometres, along the roads.
Vehicles may only travel along the road between towns `S` and `Q` in the direction of the arrow due to temporary roadworks.
Each day, a van must deliver groceries from the factory to the five towns.
The first delivery must be to town `T`, after which the van will continue on to the other four towns before returning to the factory.
--- 0 WORK AREA LINES (style=lined) ---
factory – `T` – ___________________________ – factory
--- 1 WORK AREA LINES (style=lined) ---
--- 3 WORK AREA LINES (style=lined) ---
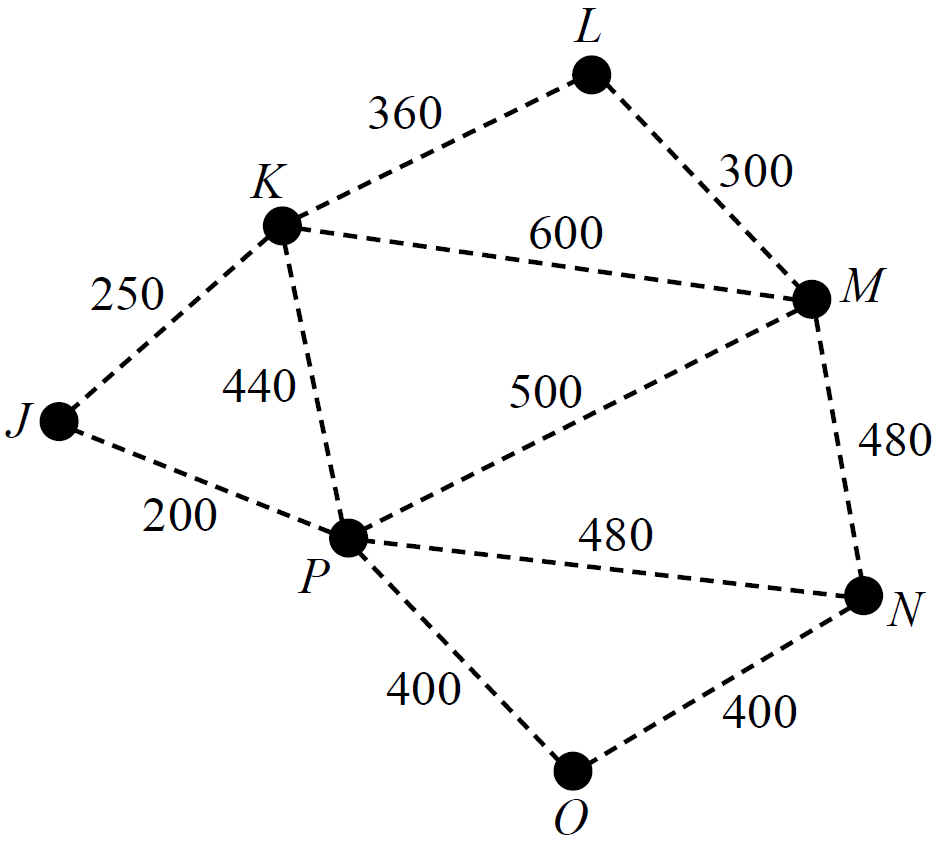
A factory requires seven computer servers to communicate with each other through a connected network of cables.
The servers, `J`, `K`, `L`, `M`, `N`, `O` and `P`, are shown as vertices on the graph below.

The edges on the graph represent the cables that could connect adjacent computer servers.
The numbers on the edges show the cost, in dollars, of installing each cable.
--- 1 WORK AREA LINES (style=lined) ---
--- 3 WORK AREA LINES (style=lined) ---
--- 1 WORK AREA LINES (style=lined) ---
Draw the minimum spanning tree on the plan below? (1 mark)
--- 0 WORK AREA LINES (style=lined) ---
--- 5 WORK AREA LINES (style=lined) ---

d.ii.`$120`
a. `$300`
b. `text(C)text(ost of)\ K\ text(to)\ N`
`= 440 + 480`
`= $920`
c. `N\ text(and)\ P\ text{(or}\ P\ text(and)\ N)`
| d.i. | |
d.ii. `text(Disconnect)\ J – P\ text(and)\ O – P`
`text(Savings) = 200 + 400 = $600`
`text(Add in)\ M – N`
`text(C)text(ost) = $480`
| `:.\ text(Net savings)` | `= 600 – 480` |
| `= $120` |
Market researchers claim that the ideal number of bookshops (`x`), sports shoe shops (`y`) and music stores (`z`) for a shopping centre can be determined by solving the equations
`2x + y + z = 12`
`x-y+z=1`
`2y-z=6`
`qquad[(qquadqquadqquadqquadqquad),(),()][(qquadquad),(qquadquad),(qquadquad)] = [(qquadquad),(qquadquad),(qquadquad)]`
--- 3 WORK AREA LINES (style=lined) ---
--- 3 WORK AREA LINES (style=lined) ---
--- 4 WORK AREA LINES (style=lined) ---
A new shopping centre called Shopper Heaven (`S`) is about to open. It will compete for customers with Eastown (`E`) and Noxland (`N`).
Market research suggests that each shopping centre will have a regular customer base but attract and lose customers on a weekly basis as follows.
80% of Shopper Heaven customers will return to Shopper Heaven next week
12% of Shopper Heaven customers will shop at Eastown next week
8% of Shopper Heaven customers will shop at Noxland next week
76% of Eastown customers will return to Eastown next week
9% of Eastown customers will shop at Shopper Heaven next week
15% of Eastown customers will shop at Noxland next week
85% of Noxland customers will return to Noxland next week
10% of Noxland customers will shop at Shopper Heaven next week
5% of Noxland customers will shop at Eastown next week
--- 0 WORK AREA LINES (style=lined) ---
`qquad{:(qquadqquadqquadtext(this week)),((qquadqquadqquad S,qquad E, quad N)),(T = [(qquadqquadqquadqquadqquadqquad),(),()]{:(S),(E),(N):}{:qquadtext(next week):}):}`
During the week that Shopper Heaven opened, it had 300 000 customers.
In the same week, Eastown had 120 000 customers and Noxland had 180 000 customers.
--- 0 WORK AREA LINES (style=lined) ---
`qquadK_0 = [(quadqquadqquadqquadqquad),(),()]{:(S),(E),(N):}`
--- 4 WORK AREA LINES (style=lined) ---
--- 5 WORK AREA LINES (style=lined) ---
A manufacturer sells three products, `A`, `B` and `C`, through outlets at two shopping centres, Eastown (`E`) and Noxland (`N`).
The number of units of each product sold per month through each shop is given by the matrix `Q`, where
`{:((qquadqquadqquad\ A,qquadquadB,qquad\ C)),(Q=[(2500,3400,1890),(1765,4588,2456)]{:(E),(N):}):}`
--- 1 WORK AREA LINES (style=lined) ---
The matrix `P`, shown below, gives the selling price, in dollars, of products `A`, `B`, `C`.
`P = [(14.50),(21.60),(19.20)]{:(A),(B),(C):}`
--- 3 WORK AREA LINES (style=lined) ---
--- 2 WORK AREA LINES (style=lined) ---
--- 2 WORK AREA LINES (style=lined) ---
To study the life-and-death cycle of an insect population, a number of insect eggs (`E`), juvenile insects (`J`) and adult insects (`A`) are placed in a closed environment. The initial state of this population can be described by the column matrix `S_0 = [(400),(200),(100),(0)]{:(E),(J),(A),(D):}` A row has been included in the state matrix to allow for insects and eggs that die (`D`). --- 1 WORK AREA LINES (style=lined) --- In this population In this population, the adult insects have been sterilised so that no new eggs are produced. In these circumstances, the life-and-death cycle of the insects can be modelled by the transition matrix `{:(qquadqquadqquadqquadquadtext(this week)),((qquadqquadqquadE,quad\ J,quadA,\ D)),(T = [(0.4,0,0,0),(0.5,0.4,0,0),(0,0.5,0.8,0),(0.1,0.1,0.2,1)]{:(E),(J),(A),(D):}):}` --- 1 WORK AREA LINES (style=lined) --- --- 1 WORK AREA LINES (style=lined) --- --- 3 WORK AREA LINES (style=lined) --- --- 1 WORK AREA LINES (style=lined) --- --- 4 WORK AREA LINES (style=lined) --- --- 3 WORK AREA LINES (style=lined) --- --- 3 WORK AREA LINES (style=lined) --- --- 3 WORK AREA LINES (style=lined) ---
The table below displays the energy content and amounts of fat, carbohydrate and protein contained in a serve of four foods: bread, margarine, peanut butter and honey.

--- 2 WORK AREA LINES (style=lined) ---
--- 3 WORK AREA LINES (style=lined) ---
--- 1 WORK AREA LINES (style=lined) ---
Matrix `A` displays the number of servings of the four foods: bread, margarine, peanut butter and honey, needed to make a peanut butter and honey sandwich.
Matrix `B` displays the energy content per serving of the four foods: bread, margarine, peanut butter and honey.
--- 2 WORK AREA LINES (style=lined) ---
--- 4 WORK AREA LINES (style=lined) ---
A series of extra rehearsals commenced in April. Each week participants could choose extra dancing rehearsals or extra singing rehearsals.
A matrix equation used to determine the number of students expected to attend these extra rehearsals is given by
`L_(n + 1) = [(0.85,0.25),(0.15,0.75)] xx L_n-[(5),(7)]`
where `L_n` is the column matrix that lists the number of students attending in week `n`.
The attendance matrix for the first week of extra rehearsals is given by
`L_1 = [(95),(97)]{:(text(dancing)),(text(singing)):}`
--- 3 WORK AREA LINES (style=lined) ---
--- 3 WORK AREA LINES (style=lined) ---
In 2009, the school entered a Rock Eisteddfod competition.
When rehearsals commenced in February, all students were asked whether they thought the school would make the state finals. The students’ responses, ‘yes’, ‘no’ or ‘undecided’ are shown in the initial state matrix `S_0`.
`S_0 = [(160),(120),(220)]{:(text(yes)),(text(no)),(text(undecided)):}`
--- 2 WORK AREA LINES (style=lined) ---
Each week some students are expected to change their responses. The changes in their responses from one week to the next are modelled by the transition matrix `T` shown below.
`{:(qquadqquadqquadtext( response this week)),(qquadqquadquadtext( yes no undecided)),(T = [(0.85quad,0.35quad,0.60),(0.10quad,0.40quad,0.30),(0.05quad,0.25quad,0.10)]{:(text(yes)),(text(no)),(text(undecided)):}qquad{:(text(response)),(text(next week)):}):}`
The following diagram can also be used to display the information represented in the transition matrix `T`.

--- 0 WORK AREA LINES (style=lined) ---
--- 1 WORK AREA LINES (style=lined) ---
--- 2 WORK AREA LINES (style=lined) ---
--- 3 WORK AREA LINES (style=lined) ---
--- 3 WORK AREA LINES (style=lined) ---
Tickets for the function are sold at the school office, the function hall and online.
Different prices are charged for students, teachers and parents.
Table 1 shows the number of tickets sold at each place and the total value of sales.

For this function
--- 0 WORK AREA LINES (style=lined) ---

--- 4 WORK AREA LINES (style=lined) ---
The Dinosaurs (`D`) and the Scorpions (`S`) are two basketball teams that play in different leagues in the same city.
The matrix `A_1` is the attendance matrix for the first game. This matrix shows the number of people who attended the first Dinosaur game and the number of people who attended the first Scorpion game.
`A_1 = [(2000),(1000)]{:(D),(S):}`
The number of people expected to attend the second game for each team can be determined using the matrix equation
`A_2 = GA_1`
where `G` is the matrix `{:(qquadqquadqquadtext(this game)),((qquadqquadqquadD,qquad\ S)),(G = [(1.2,-0.3),(0.2,0.7)]{:(D),(S):}qquad{:text(next game):}):}`
--- 2 WORK AREA LINES (style=lined) ---
--- 2 WORK AREA LINES (style=lined) ---
Assume that the attendance matrices for successive games can be determined as follows.
`A_3 = GA_2`
`A_4 = GA_3`
and so on such that `A_(n + 1) = GA_n`
--- 3 WORK AREA LINES (style=lined) ---
--- 3 WORK AREA LINES (style=lined) ---
The attendance at the first Dinosaur game was 2000 people and the attendance at the first Scorpion game was 1000 people.
Suppose, instead, that 2000 people attend the first Dinosaur game, and 1800 people attend the first Scorpion game.
--- 3 WORK AREA LINES (style=lined) ---
The basketball coach has written three linear equations which can be used to predict the number of points, `p`, rebounds, `r`, and assists, `a`, that Oscar will have in his next game.
| The equations are `p + r + a` | `= 33` |
| `2p - r + 3a` | `= 40` |
| `p + 2r + a` | `= 43` |
--- 0 WORK AREA LINES (style=lined) ---
`[(qquadqquad),(qquadqquad),(qquadqquad)][(p),(r),(a)] = [(33),(40),(43)]`
This matrix equation can be solved in the following way.
`[(p),(r),(a)] = [(7,-1,-4),(-1,0,1),(x,1,3)][(33),(40),(43)]`
--- 3 WORK AREA LINES (style=lined) ---
--- 3 WORK AREA LINES (style=lined) ---
The 300 players in Oscar’s league are involved in a training program. In week one, 90 players are doing heavy training (`H`), 150 players are doing moderate training (`M`) and 60 players are doing light training (`L`). The state matrix, `S_1`, shows the number of players who are undertaking each type of training in the first week
`S_1 = [(90),(150),(60)]{:(H),(M),(L):}`
The percentage of players that remain in the same training program, or change their training program from week to week, is shown in the transition diagram below.

--- 2 WORK AREA LINES (style=lined) ---
The information in the transition diagram above can also be written as the transition matrix `T`.
`{:(qquadqquadqquadquad\ text(this week)),((qquadqquadqquadH,quadM,\ L)),(T = [(0.5,0.1,0.1),(0.2,0.6,0.5),(0.3,0.3,0.4)]{:(H),(M),(L):}qquad{:text(next week):}):}`
--- 3 WORK AREA LINES (style=lined) ---
--- 4 WORK AREA LINES (style=lined) ---
--- 4 WORK AREA LINES (style=lined) ---
In a game of basketball, a successful shot for goal scores one point, two points, or three points, depending on the position from which the shot is thrown.
`G` is a column matrix that lists the number of points scored for each type of successful shot.
`G = [(1),(2),(3)]`
In one game, Oscar was successful with
--- 1 WORK AREA LINES (style=lined) ---
--- 3 WORK AREA LINES (style=lined) ---
--- 2 WORK AREA LINES (style=lined) ---


