SmarterEd

Aussie Maths & Science Teachers: Save your time with SmarterEd

  • Login
  • Get Help
  • About

Measurement, STD2 M1 2007 HSC 23b

A cylindrical water tank, of height 2 m, is placed in the ground at a school.

The radius of the tank is 3.78 metres. The hole is 2 metres deep. When the tank is placed in the hole there is a gap of 1 metre all the way around the side of the tank.
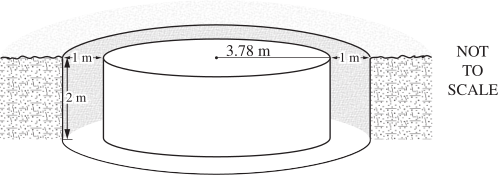
 

  1. When digging the hole for the water tank, what volume of soil was removed? Give your answer to the nearest cubic metre.   (3 marks)

    --- 6 WORK AREA LINES (style=lined) ---

  2. Sprinklers are used to water the school oval at a rate of 7500 litres per hour.   


    The water tank holds 90 000 litres when full. 


    For how many hours can the sprinklers be used before a full tank is emptied?   (1 mark)

    --- 2 WORK AREA LINES (style=lined) ---

  3. Water is to be collected in the tank from the roof of the school hall, which has an area of 400 m².


    During a storm, 20 mm of rain falls on the roof and is collected in the tank. 


    How many litres of water were collected?   (2 marks)

    --- 4 WORK AREA LINES (style=lined) ---

Show Answers Only

a.   `144\ text(m³)\ \ text{(nearest m³)}`

b.   `text(12 hours)`

c.   `8000\ text(litres)`

Show Worked Solution

a.  `V = pi r^2 h\ \ \ \ text(where)`

`h = 2\ text(and)\ r = 4.78\ text(m)`

`:.\ V` `= pi xx 4.78^2 xx 2`
  `= 143.56…= 144\ text(m)^3\ \ text{(nearest m}^3text{)}`

  
b.
  `text(Total water) = 90\ 000\ text(litres)`

`text(Usage) = 7500\ \ text(litres/hr)`

`:.\ text(Hours before it is empty)`

`= (90\ 000)/7500= 12\ text(hours)`
  

c.  `text(Water collected)`

`= 400 xx 0.020= 8\ text(m)^2= 8000\ text(litres)`

Filed Under: Areas and Volumes (Harder), FS Resources, Perimeter, Area and Volume, Volume, Mass and Capacity, Volume, Mass and Capacity Tagged With: Band 3, Band 4, smc-6304-50-Volume (Circular Measure), smc-6521-50-Volume (Circular Measure), smc-798-50-Volume (Circular Measure)

GEOMETRY, FUR1 2009 VCAA 3 MC

GEOMETRY, FUR1 2009 VCAA 3 MC 

The locations of three towns, `Q`, `R` and `T`, are shown in the diagram above.

Town `T` is due south of town `R`.

The angle `TRQ` is `48^@`.

The bearing of town `R` from town `Q` is

A.   `048^@`

B.   `132^@`

C.   `138^@`

D.   `228^@`

E.   `312^@`

Show Answers Only

`E`

Show Worked Solution

GEOMETRY, FUR1 2009 VCAA 3 MC Answer

`∠RQA = 48^@    text{(} text(alternate)\ RT\ text(||)\ QA text{})`

`∴ text(Bearing of)\ R\ text(from)\ Q`

`= 360 – 48`

`= 312^@`

`=>  E`

Filed Under: Trig - Bearings Tagged With: Band 4

GEOMETRY, FUR1 2009 VCAA 5 MC

GEOMETRY, FUR1 2009 VCAA 5 MC

A right triangular prism has a volume of 160 cm3.

A second right triangular prism is made with the same width, twice the height and three times the length of the prism shown.

The volume of the second prism (in cm3) is

A.     `320`

B.     `640`

C.     `960`

D.   `1280`

E.   `1920`

Show Answers Only

`C`

Show Worked Solution

`text(Volume of existing prism)\ (V)`

  `= 1/2 xx b xx h xx l`
  `= 160 \ text(cm³)`


`text(Volume of new prism)\ (V_1)`

  `= 1/2 xx b xx 2h xx 3l`
  `= 6 xx 1/2 xx b xx h xx l`
  `= 6 xx V`
  `= 6 xx 160`
  `= 960 \ text(cm³)`

 `=>  C`

Filed Under: Perimeter, Area and Volume Tagged With: Band 4

Financial Maths, STD2 F1 2007 HSC 23a

Lilly and Rose each have money to invest and choose different investment accounts.

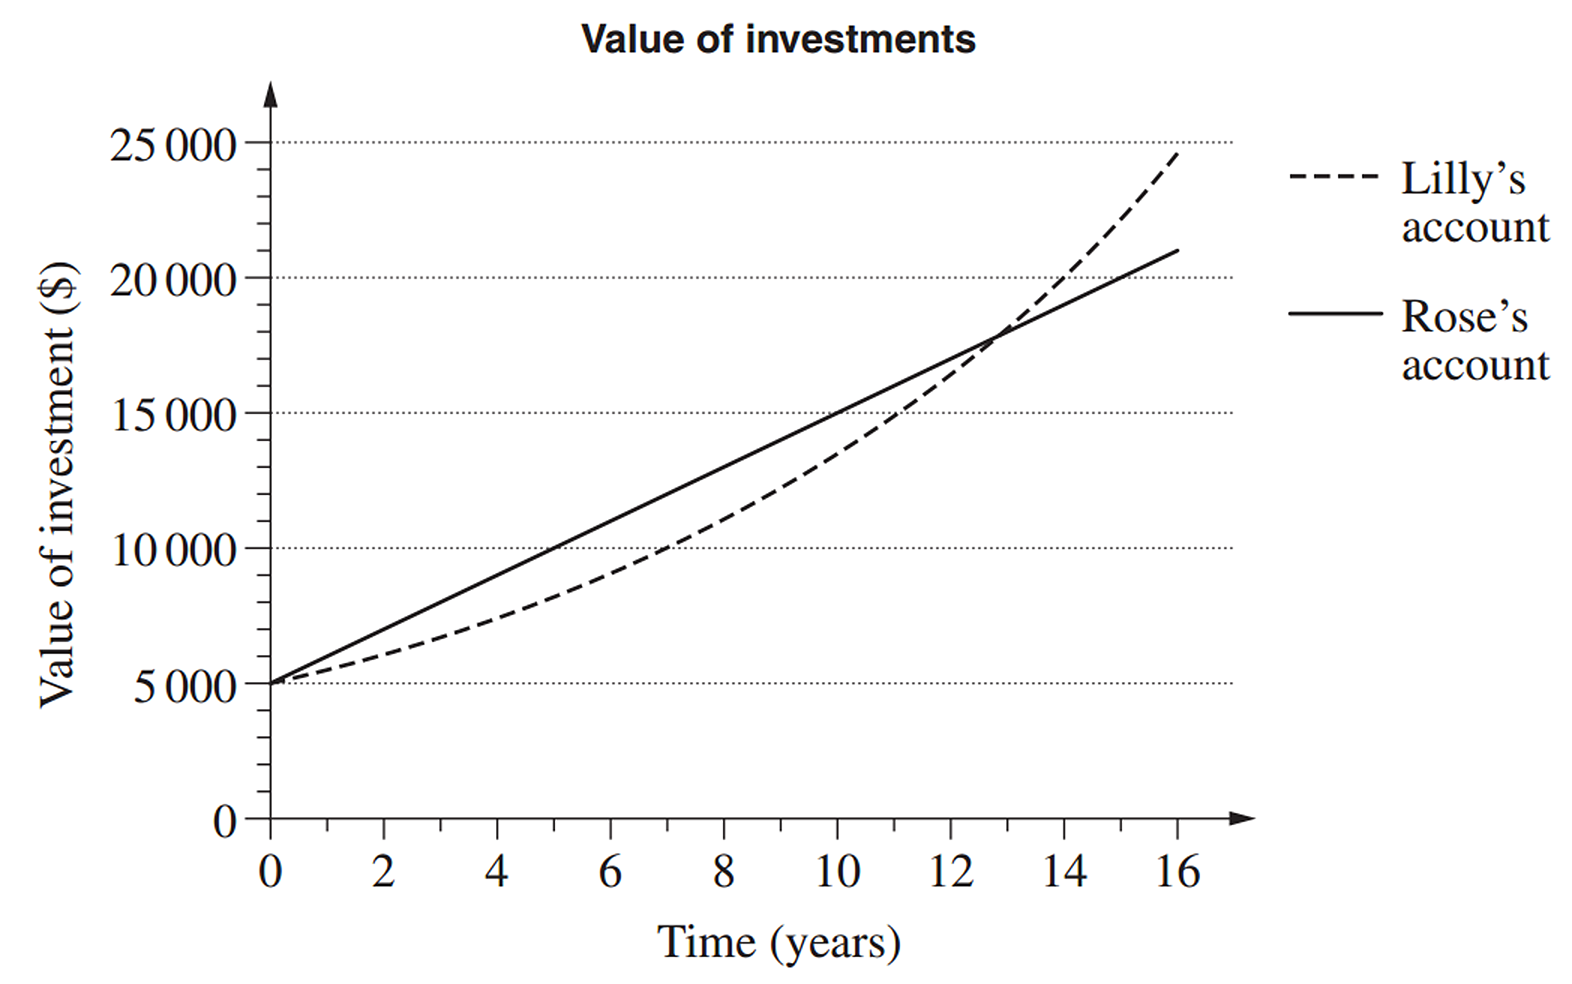
The graph shows the values of their investments over time.


  1. How much was Rose’s original investment?   (1 mark)

    --- 1 WORK AREA LINES (style=lined) ---

  2. At the end of  6 years, which investment will be worth the most and by how much?   (2 marks)

    --- 4 WORK AREA LINES (style=lined) ---

  3. Lilly’s investment will reach a value of  $20 000  first.
  4. How much longer will it take Rose’s investment to reach a value of  $20 000?   (1 mark)

    --- 2 WORK AREA LINES (style=lined) ---

Show Answers Only

a.    `$5000`

b.    `text(Rose’s is worth $2000 more.)`

c.    `text(It takes Lilly 14 years to reach $20 000 and it takes)`

`text{Rose 1 year longer (15 years) to reach the same value}`

Show Worked Solution

a.    `$5000\ (y text(-intercept) text{)}`
 

b.    `text(After 6 years,)`

`text(Lilly’s investment)= $9000`

`text(Rose’s investment)= $11\ 000`
  

`:.\ text(Rose’s is worth $2000 more.)`
    

c.    `text(It takes Lilly 14 years to reach $20 000 and it)`

`text{takes Rose 1 year longer (15 years) to reach the}`

`text(same value.)`

Filed Under: Compound Interest and Shares, F2 Investment (Y12), FM2 - Investing, Investment, Investment (Y12), Simple Interest and S/L Depreciation, Simple Interest and S/L Depreciation Tagged With: Band 2, Band 3, Band 4, smc-1108-30-i/r comparisons (incl. graphs), smc-1124-10-Simple Interest, smc-6831-10-Simple Interest, smc-6831-30-i/r Comparisons, smc-6924-10-Simple Interest, smc-6924-30-Interest Comparisons, smc-808-10-Simple Interest, smc-817-30-i/r comparisons (incl. graphs)

CORE*, FUR1 2009 VCAA 7 MC

The difference equation  `u_(n + 1) = 4u_n - 2`  generates a sequence.

If  `u_2 = 2`, then  `u_4`  will be equal to

A.     4

B.     8

C.   22

D.   40

E.   42

Show Answers Only

`C`

Show Worked Solution
`u_(n+1)` `= 4u_n – 2`
`∴ u_3` `= 4u_2 – 2`
  `= 4 xx 2 – 2\ \ text{(given}\ u_2 = 2 text{)}`  
  `= 6`
`∴ u_4` `= 4u_3 – 2`
  `= 4 xx 6 – 2`
  `= 22`

 
`=>  C`

Filed Under: Difference Equations - MC, Recursion - General Tagged With: Band 4, smc-714-25-RR (combination), smc-714-50-Find term(s)

GEOMETRY, FUR1 2014 VCAA 8 MC

The distance, `AC`, across a small lake can be calculated using the measurements shown in the diagram below.

In this diagram, `BCA` and `BDE` are right-angled triangles, where `CB = 40.4\ text(m), BD = 10\ text(m)` and `BE = 12\ text(m).`

The distance between the points `A` and `C`, in metres, is closest to

A.    `22.4`

B.    `26.8`

C.    `33.6`

D.    `48.5`

E.  `177.8`

Show Answers Only

`B`

Show Worked Solution

`/_ ABC = /_ DBE\ \ text{(vertically opposite angles)}`

`/_ ACB = /_ BDE = 90°\ \ text{(given)}`

`∴ Delta ABC\ \ text(|||)\ \ Delta EBD\ \ \ \ text{(equiangular)}`

`∴ (AB)/40.4` `= 12/10` `\ \ \ \ \ text{(corresponding sides}`
`\ \ \ \ \ \ text{of similar triangles)}`
`AB` `= (12 xx 40.4)/10`  
  `= 48.48\ \ text(m)`  


`text(Using Pythagoras in)\ Delta ABC:`

`48.48^2` `= x^2 + 40.4^2`
`x^2` `= 718.1504`
`x` `= 26.79\ text(m)`

 
`=>B`

Filed Under: Similarity and Scale Tagged With: Band 4

CORE*, FUR1 2011 VCAA 7 MC

Let `P_2011` be the number of pairs of shoes that Sienna owns at the end of 2011.

At the beginning of 2012, Sienna plans to throw out the oldest 10% of pairs of shoes that she owned in 2011.

During 2012 she plans to buy 15 new pairs of shoes to add to her collection.

Let `P_2012` be the number of pairs of shoes that Sienna owns at the end of 2012.

A rule that enables `P_2012` to be determined from `P_2011` is

A.   `P_2012 = 1.1 P_2011 + 15`

B.   `P_2012 = 1.1 (P_2011 + 15)`

C.   `P_2012 = 0.1 P_2011 + 15`

D.   `P_2012 = 0.9 (P_2011 + 15)`

E.   `P_2012 = 0.9 P_2011 + 15`

Show Answers Only

`E`

Show Worked Solution

`text(By throwing out 10%, Sienna keeps 90% of her)`

`text{her 2011 shoes (or 0.9} \ P_2011 text{) and then adds 15.}`

`:. P_(2012) = 0.9\ P_2011 + 15`

`=> E`

Filed Under: Difference Equations - MC, Recursion - General Tagged With: Band 4, smc-714-25-RR (combination), smc-714-60-Identify RR

PATTERNS, FUR1 2011 VCAA 4 MC

The number of bees in a colony was recorded for three months and the results are displayed in the table below.

If this pattern of increase continues, which one of the following statements is not true.

A.   There will be nine times as many bees in the colony in month 5 than in month 3.

B.   In month 4, the number of bees will equal 270.

C.   In month 6, the number of bees will equal 7290.

D.   In month 8, the number of bees will exceed 20 000.

E.   In month 10, the number of bees will be under 200 000.

Show Answers Only

`C`

Show Worked Solution

`text(Sequence is 10, 30, 90, …)`

`text(GP where)\ \ \ a` ` = 10, and`
`r` ` = t_2/t_1=30 / 10 = 3`


`text(In A,)\ \ T_5 = 10 xx 3^4 and T_3 = 10 xx 3^2`

`:. T_5 = T_3 xx 3^2\ \ text{(True)}`

`text(In B,)\ \ T_4 = 10 xx 3^3 = 270\ \ text{(True)}`

`text(In C,)\ \ T_6 = 10 xx 3^5 = 2430\ \ text{(NOT true)}`

`text(In D,)\ \ T_8 = 10 xx 3^7 = 21\ 870\ \ text{(True)}`

`text(In E,)\ \ T_10 = 10 xx 3^9 = 196\ 830\ \ text{(True)}`

`=> C`

Filed Under: APs and GPs - MC Tagged With: Band 4

CORE*, FUR1 2011 VCAA 3 MC

The graph above shows the first five terms of a sequence.

Let `A_n` be the `n`th term of the sequence.

A difference equation that generates the terms of this sequence is

A.  `A_(n+1) = 2A_n - 2` `\ \ \ \ text(where) \ \ \ \ ` `A_1 =8`
B.  `A_(n+1) = 3A_n` `\ \ \ \ text(where) \ \ \ \ ` `A_1 =8`
C.  `A_(n+1) = -2A_n` `\ \ \ \ text(where) \ \ \ \ \ \ \ \ ` `A_1 =8`
D.  `A_(n+1) = -1 / 2 A_n` `\ \ \ \ text(where) \ \ \ \ ` `A_1 =8`
E.  `A_(n+1) = -A_n - 1` `\ \ \ \ text(where) \ \ \ \ ` `A_1 =8`
Show Answers Only

`D`

Show Worked Solution

`A_1 = 8, \ \ A_2 = –4, \ \ A_3 = 2\ \ text{(from graph)}`

`text(This sequence is geometric where)`

`r=t_2/t_1=- 1/2`

`:.\ text(Difference equation is)\ \ \ A_(n+1) = -1/2 A_n`

`=> D`

Filed Under: Difference Equations - MC, Recursion - General Tagged With: Band 4, smc-714-70-RR and graphs

PATTERNS, FUR1 2011 VCAA 2 MC

The first three terms of an arithmetic sequence are  –3, –7, –11 . . .

An expression for the  `n`th  term of this sequence, `t_n`, is

A.   `t_n = 1 - 4n`

B.   `t_n = 1 - 8n`

C.   `t_n = -3 - 4n`

D.   `t_n = -3 + 4n`

E.   `t_n = -7 + 4n`

Show Answers Only

`A`

Show Worked Solution

`text(Sequence is  –3, –7, –11, …)`

`text(AP where)\ \ \ a` `= –3, and`
`d` `= –7 – (–3) = –4`
`t_n` ` = a + (n – 1) d`
  ` = –3 + (n – 1) (–4)`
  ` = –3 – 4n + 4`
  ` = 1 – 4n`

`=> A`

Filed Under: APs and GPs - MC Tagged With: Band 4

GEOMETRY, FUR1 2012 VCAA 7 MC

`PQR` is a triangle with side lengths `x, 10` and `y`, as shown below.

In this triangle, angle `RPQ = 37°` and angle `QRP = 42°.`

Which one of the following expressions is correct for triangle `PQR`?

A.    `x = 10/(sin 37°)`

B.    `y = 10/(tan 37°)`

C.    `x = 10 × (sin 42°)/(sin 37°)`

D.    `y = 10 × (sin 37°)/(sin 101°)`

E.    `10^2 = x^2 + y^2 - 2xy cos 42°`

Show Answers Only

`C`

Show Worked Solution

`∠ PQR` `= 180 – (37 + 42)\ \ \ \ text {(angle sum of}\ ΔPQR text{)}`
  `= 101°`


`text (Using the sine rule:)`

`y/sin 101= x/sin 42= 10/sin 37`

`:. x= 10 × (sin 42)/(sin 37)`

 
`rArr C`

Filed Under: Non-Right-Angled Trig Tagged With: Band 4, smc-3589-10-Sine rule

GEOMETRY, FUR1 2012 VCAA 3 MC

A rectangular sheet of cardboard has length 50 cm and width 20 cm.

This sheet of cardboard is made into an open-ended cylinder by joining the two shorter sides, with no overlap.

This is shown in the diagram below. 

The radius of this cylinder, in cm, is closest to

A.     `6.4`

B.     `8.0`

C.   `15.6`

D.   `15.9`

E.   `17.8`

Show Answers Only

`B`

Show Worked Solution

`text (Circumference) = 50\ text(cm)`

 `2pi r` `= 50`
 `:. r` `= 50/(2pi)`
  `= 7.95…\ text(cm)`

`rArr B`

Filed Under: Perimeter, Area and Volume Tagged With: Band 4

Measurement, STD2 M2 2007 HSC 20 MC

Kim lives in Perth. He wants to watch an ice hockey game being played in Toronto starting at 10.00 pm on Wednesday.

Toronto is 13 hours behind Perth.

What is the time in Perth when the game starts?

  1. 9.00 am on Wednesday
  2. 7.40 pm on Wednesday
  3. 12.20 am on Thursday
  4. 11.00 am on Thursday
Show Answers Only

`D`

Show Worked Solution

`:.\ text(Time in Perth)`

`=\ text{10 pm (Wed) + 13 hours}`

`=\ text(11 am on Thursday)`

`=>  D`

Filed Under: M2 Working with Time (Y11), M2 Working with Time (Y11), Time and Time Difference, Time and Time Difference Tagged With: Band 4, smc-1102-10-Time Differences, smc-6306-10-Time Differences, smc-6525-10-Time Differences, smc-776-10-Time Differences

Probability, STD2 S2 2007 HSC 16 MC

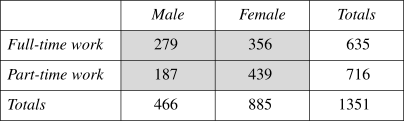
Leanne copied a two-way table into her book.


Leanne made an error in copying one of the values in the shaded section of the table.

Which value has been incorrectly copied?

  1. The number of males in full-time work
  2. The number of males in part-time work
  3. The number of females in full-time work
  4. The number of females in part-time work
Show Answers Only

`D`

Show Worked Solution

`text(By checking row and column total, the number of females in part-time)`

`text(work is incorrect.)`

`=>  D`

Filed Under: Relative Frequency, Relative Frequency, Relative Frequency, Relative Frequency and Venn Diagrams, Summary Statistics (no graph), Venn Diagrams and Expected/Relative Frequency Tagged With: Band 4, common-content, num-title-ct-pathb, num-title-qs-hsc, smc-1133-10-Surveys/Two-Way Tables, smc-4815-10-2-Way tables, smc-6936-20-Two-way Tables, smc-827-10-Surveys/Two-Way Tables, smc-990-10-Surveys/Two-Way Tables

Algebra, 2UG 2007 HSC 14 MC

Which expression is equivalent to  `3x^2 (x + 8) + x^2`?

(A)   `3x^3 + x^2 + 8`

(B)   `3x^3 + 25x^2`

(C)   `4x^3 + 32x^2`

(D)   `24x^3 + x^2`

Show Answers Only

`B`

Show Worked Solution

`3x^2 (x + 8) + x^2`

`= 3x^3 + 24x^2 + x^2`

`= 3x^3 + 25x^2`

`=>  B`

Filed Under: Linear and Other Equations Tagged With: Band 4

Probability, 2UG 2007 HSC 13 MC

The positions of President, Secretary and Treasurer of a club are to be chosen from a committee of  `5` people.

In how many ways can the three positions be chosen? 

(A)   `3`

(B)   `10`

(C)   `60`

(D)   `125`

Show Answers Only

`C`

Show Worked Solution

`text(3 positions and order matters)`

`:.\ text(# Combinations)` `= 5 xx 4 xx 3`
  `= 60`

`=>  C`

Filed Under: # Combinations Tagged With: Band 4

Financial Maths, STD2 F4 2007 HSC 12 MC

The value of a car is depreciated using the declining balance method.

Which graph best illustrates the value of the car over time?
 

VCAA 2007 12 mcii

Show Answers Only

`C`

Show Worked Solution

`text(Declining balance depreciates quicker in absolute)`

`text(terms in the early stages, and slower as time goes)`

`text(on and the balance owing decreases.)`

`=>  C`

Filed Under: Depreciation, Depreciation, Depreciation - Declining Balance, Depreciation - Declining Balance, Depreciation / Running costs Tagged With: Band 4, smc-1139-60-Depreciation Graphs, smc-6845-60-Depreciation Graphs, smc-6925-60-Depreciation Graphs, smc-813-60-Depreciation Graphs

Measurement, 2UG 2007 HSC 11 MC

`P`  and  `Q`  are points on the circumference of a circle with centre  `O`  and radius  `3`  cm.  

2007 11 mc

What is the length of the arc  `PQ`, in centimetres, correct to three significant figures?

(A)   `1.57`

(B)   `3.14`

(C)   `4.71`

(D)   `18.8`

Show Answers Only

`B`

Show Worked Solution
`text(Length of Arc)\ PQ` `= 60/360 xx 2 pi r`
  `= 1/6 xx 2pi (3)`
  `= pi`
  `= 3.14\ text(cm)`

`=>  B`

Filed Under: MM6 - Spherical Geometry Tagged With: Band 4

Probability, STD2 S2 2007 HSC 10 MC

Each time she throws a dart, the probability that Mary hits the dartboard is  `2/7`.

She throws two darts, one after the other.

What is the probability that she hits the dartboard with both darts?

  1. `1/21` 
  2. `4/49` 
  3. `2/7`
  4. `4/7`
Show Answers Only

`B`

Show Worked Solution

`P text{(hits)} = 2/7`

`P text{(hits twice)}= 2/7 xx 2/7= 4/49`  

`=>  B`

Filed Under: Multi-stage Events, Multi-Stage Events, Single and Multi-Stage Events, Single and Multi-Stage Events Tagged With: Band 4, smc-1135-20-Other Multi-Stage Events, smc-6935-20-P(A and B)=P(A) x P(B), smc-6935-25-Other Multi-Stage Events, smc-829-20-Other Multi-Stage Events

Statistics, STD2 S4 2007 HSC 9 MC

Which of the following would be most likely to have a positive correlation?

  1. The population of a town and the number of schools in that town
  2. The price of petrol per litre and the number of litres of petrol sold
  3. The hours training for a marathon and the time taken to complete the marathon
  4. The number of dogs per household and the number of televisions per household
Show Answers Only

\(A\)

Show Worked Solution

\(\text{Positive correlation means that as one variable increases,}\)

\(\text{the other tends to increase also.}\)

\(\Rightarrow A\)

Filed Under: Bivariate Data, Bivariate Data Analysis, Bivariate Data Analysis (Y12), Correlation / Body Measurements, S3 Further Statistical Analysis (Y12), S4 Bivariate Data Analysis (Y12) Tagged With: Band 4, common-content, num-title-ct-coreb, num-title-qs-hsc, smc-1001-30-Correlation, smc-1113-30-Correlation, smc-5022-35-Causality, smc-6934-30-Correlation, smc-785-30-Correlation

Financial Maths, STD2 F1 2007 HSC 7 MC

Margaret has a weekly income of $900 and allocates her money according to the budget shown in the sector graph.


How long will it take Margaret to save $3600?

  1. 4 weeks
  2. 5 weeks
  3. 16 weeks
  4. 18 weeks
Show Answers Only

`D`

Show Worked Solution
`text(Savings)` `= 80/360\ \ \ text{(sector graph)}`
  `= 80/360 xx 900= $200\ text(per week)`

`:.\ text(Time to save $3600)= 3600/200= 18\ text(weeks)`

`=>  D`

Filed Under: Budgeting, Budgeting, Earning Money and Budgeting, Earning Money and Budgeting, FM1 - Earning money Tagged With: Band 4, smc-1126-30-Budgeting, smc-6279-30-Personal Budget, smc-6518-30-Personal Budget, smc-810-30-Budgeting

Financial Maths, STD2 F1 2007 HSC 6 MC

The price of a CD is $22.00, which includes 10% GST.

What is the amount of GST included in this price?

  1.    $2.00
  2.    $2.20
  3.    $19.80
  4.    $20.00
Show Answers Only

`A`

Show Worked Solution

`text(CD costs $22.00 incl. GST`

`text(Let)\ C = text(original cost)`

`C + text(10%) xx C` `= 22`
`1.1C` `= 22`
`C` `= 20`

  
`:.\ text(GST)= 22.00-20.00= $2.00`

  
`=>  A`

Filed Under: FM3 - Taxation, Purchasing Goods, Purchasing Goods, Tax and Percentage Increase/Decrease, Tax and Percentage Increase/Decrease Tagged With: Band 4, smc-1125-20-GST, smc-6278-20-GST/VAT, smc-6517-20-GST/VAT, smc-831-20-GST

Financial Maths, STD2 F1 2007 HSC 3 MC

Joe is about to go on holidays for four weeks. His weekly salary is $280 and his holiday loading is 17.5% of four weeks pay.

What is Joe’s total pay for the four weeks holiday?

  1. $196
  2. $329
  3. $1169 
  4. $1316 
Show Answers Only

`D`

Show Worked Solution

`text(Salary)\ text{(4 weeks)}= 4 xx 280= $1120`

`text(Holiday loading)= 1120 xx 17.5%= $196`

`:.\ text(Total pay)= 1120 + 196= $1316`

`=>  D`

Filed Under: Earning and Spending Money, Earning Money and Budgeting, Earning Money and Budgeting, FM1 - Earning money, Tax and Percentage Increase/Decrease, Tax and Percentage Increase/Decrease, Ways of Earning, Ways of Earning Tagged With: Band 4, num-title-ct-corea, num-title-qs-hsc, smc-1125-30-% Increase/Decrease, smc-1126-10-Wages, smc-4331-10-Wages, smc-4331-30-Leave loading, smc-6276-10-Wages/Salaries, smc-6515-10-Wages/Salaries, smc-810-10-Wages, smc-831-30-% Increase/Decrease

GEOMETRY, FUR1 2014 VCAA 6-7 MC

A cross-country race is run on a triangular course. The points  `A, B` and `C` mark the corners of the course, as shown below.


The distance from `A` to `B` is 2050 m.

The distance from `B` to `C` is 2250 m.

The distance from `A` to `C` is 1900 m.

The bearing of `B` from `A` is 140°.


Part 1

The bearing of `C` from `A` is closest to

A.   `032°`

B.   `069°`

C.   `192°`

D.   `198°`

E.   `209°`


Part 2

The area within the triangular course `ABC`, in square metres, can be calculated by evaluating

A.  `sqrt (3100 xx 1200 xx 1050 xx 850)`

B.  `sqrt (3100 xx 2250 xx 2050 xx 1900)`

C.  `sqrt (6200 xx 4300 xx 4150 xx 3950)`

D.  `1/2 xx 2050 xx 2250 xx sin\ (140^@)`

E.  `1/2 xx 2050 xx 2250 xx sin\ (40^@)`

Show Answers Only

`text(Part 1:)\ E`

`text(Part 2:)\ A`

Show Worked Solution

`text(Part 1)`

♦ Mean mark 43%.

`text(Using the cosine rule:)`

`cos ∠CAB` `= ((AC)^2 + (AB)^2 – (CB)^2)/(2 xx AC xx AB)`
  `= (1900^2 + 2050^2 – 2250^2)/(2 xx 1900 xx 2050)`
  `= 0.3530…`
`/_ CAB` `= 69.32…°`


`∴\ text(Bearing of C from A)`

`= 140 + 69.32…`

`= 209.32…°`

`=>E`


`text(Part 2)`

`text(Using Heron’s rule,)`

`text{Semi-perimeter (s)}`

`= (1900 + 2050 + 2250)/2`

`= 3100`
 

`∴ A` `= sqrt{s (s-a)(s-b)(s-c)}`
  `= sqrt{3100 xx 1200 xx 1050 xx 850}`

 
`=> A`

Filed Under: Trig - Bearings Tagged With: Band 4, Band 5

GEOMETRY, FUR1 2014 VCAA 5 MC

A rectangular box, `ABCDEFGH` is 22 cm long, 16 cm wide and 8 cm high, as shown below.

A thin rod is resting in the box. One end of the rod sits at `X` and the other end of the rod sits at `H.`

The point `X` lies on the line `AB` at a distance of 10 cm from `B.`

The length of the rod, in centimetres, is closest to

A.  `17.89`

B.  `18.87`

C.  `20.00`

D.  `21.54`

E.  `26.83`

Show Answers Only

`D`

Show Worked Solution

`text(Consider)\ \ Delta AEX,`

`AX = 22 – 10 = 12\ text{cm  (from diagram)}`

`text(Using Pythagoras in)\ Delta EAX,`

`x^2` `= 16^2 + 12^2`
  `= 400`
`:. x` `= 20`


`text(Consider)\ \ Delta HEX,\ text(where)\ \ HX = d`

`text(Using Pythagoras in)\ Delta HEX,`

`d^2` `= 8^2 + 20^2`
  `= 464`
`∴ d` `= 21.54…\ text(cm)`

`=>D`

Filed Under: Trig - Harder Applications Tagged With: Band 4

CORE*, FUR1 2014 VCAA 7 MC

The first term of a Fibonacci-related sequence is  `p`.

The second term of the same Fibonacci-related sequence is  `q`.

The difference in value between the fourth and fifth terms of this sequence is

A.   `p - q`  

B.   `q - p`  

C.   `p + q`

D.   `p + 2q`

E.   `2p + 3q`

Show Answers Only

`C`

Show Worked Solution

`text(Fibonacci sequence general form is)`

♦ Mean mark 42%.

`t_(n+2) = t_(n+1) + t_n`

`t_1 = p`

`t_2 = q`

`t_3 = p + q`

`t_4 = (p + q) + q = p + 2q`

`t_5 = p + 2q + (p + q) = 2p + 3q`

`∴ t_5 – t_4` `= 2p + 3q – (p + 2q)`
  `= p + q`

 
`=>  C`

Filed Under: Difference Equations - MC, Recursion - General Tagged With: Band 4, smc-714-30-RR (Fibonacci), smc-714-50-Find term(s)

PATTERNS, FUR1 2014 VCAA 5 MC

Mary plans to read a book in seven days.
Each day, Mary plans to read 15 pages more than she read on the previous day.
The book contains 1155 pages.
The number of pages that Mary will need to read on the first day, if she is to finish reading the book in seven days, is

A.   `112` 

B.   `120` 

C.   `150`

D.   `165`

E.   `180`

Show Answers Only

`B`

Show Worked Solution

`text(Sequence is)\ \ a, a+15, a + 2 xx 15, …`

`=>\ text(AP where)\ \ \d=15`

`text(Find)\ \ a\ \ text(when)\  S_7 = 1155`

`S_n` `=n/2[2a + (n-1)d]`
`1155` `=7/2[2a + (7-1)15]`
`1155` `=7/2[2a + 90]`
  `=7a + 315`
`7a` `=840`
`a` `=120`

`=>  B`

Filed Under: APs and GPs - MC Tagged With: Band 4

CORE, FUR1 2014 VCAA 9 MC

The equation of a least squares regression line is used to predict the fuel consumption, in kilometres per litre of fuel, from a car’s weight, in kilograms.

This equation predicts that a car weighing 900 kg will travel 10.7 km per litre of fuel, while a car weighing 1700 kg will travel 6.7 km per litre of fuel.

The slope of this least squares regression line is closest to

A.   `–250`

B.   `–0.005`

C.   `–0.004`

D.   `0.005`

E.   `200`

Show Answers Only

`B`

Show Worked Solution


`text(Gradient)` `=(y_2-y_1)/(x_2 – x_1)`
  `=(6.7 – 10.7)/(1700 – 900)`
  `=- 4/800`
  `=-0.005`

 
`=>  B`

Filed Under: Correlation and Regression Tagged With: Band 4, smc-265-20-Find LSRL Equation/Gradient

CORE, FUR1 2011 VCAA 13 MC

The table below shows the number of broadband users in Australia for each of the years from 2004 to 2008.
 

core 2011  VCAA 13
 

A two-point moving mean, with centring, is used to smooth the time series.

The smoothed value for the number of broadband users in Australia in 2006 is

A.   `2 \ 958 \ 000`

B.   `3 \ 379 \ 600`

C.   `3 \ 455 \ 500`

D.   `3 \ 661 \ 500`

E.   `3 \ 900 \ 000`

Show Answers Only

`D`

Show Worked Solution

`text(Two point mean for)`

`text(2005/06)` `= (2 \ 016 \ 000 + 3 \ 900 \ 000) / 2`
  `= 2 \ 958 \ 000`
   
`text(2006/07)`  `= (3 \ 900 \ 000 + 4 \ 830 \ 000) / 2`
  `= 4 \ 365 \ 000`
`:.\ text(Centered mean)` `= (2 \ 958 \ 000 + 4 \ 365 \ 000) / 2`
  `= 3 \ 661 \ 500`

`=> D`

Filed Under: Time Series Tagged With: Band 4, smc-266-60-MEAN Smoothing

CORE, FUR1 2011 VCAA 11 MC

For a group of 15-year-old students who regularly played computer games, the correlation between the time spent playing computer games and fitness level was found to be  `r = -0.56.`

On the basis of this information it can be concluded that

  1. 56% of these students were not very fit.
  2. these students would become fitter if they if they spent less time playing computer games.
  3. these students would become fitter if they if they spent more time playing computer games.
  4. the students in the group who spent a short amount of time playing computer games tended to be fitter.
  5. the students in the group who spent a large amount of time playing computer games tended to be fitter.
Show Answers Only

`D`

Show Worked Solution

`text(Negative correlation means that as time spent playing)`

`text(computer games decreases, fitness levels tend to increase.)`

`text(Note that)\ B\ text(is incorrect because it assumes one causes the)`

`text(other.)`

`=> D`

Filed Under: Correlation and Regression Tagged With: Band 4, smc-265-10-r / r^2 and Association

CORE, FUR1 2011 VCAA 9-10 MC

The length of a type of ant is approximately normally distributed with a mean of 4.8 mm and a standard deviation of 1.2 mm.

Part 1

From this information it can be concluded that around 95% of the lengths of these ants should lie between

A.   `text(2.4 mm and 6.0 mm)`

B.   `text(2.4 mm and 7.2 mm)`

C.   `text(3.6 mm and 6.0 mm)`

D.   `text(3.6 mm and 7.2 mm)`

E.   `text(4.8 mm and 7.2 mm)`


Part 2

A standardised ant length of  `z = text(−0.5)`  corresponds to an actual ant length of

A.   `text(2.4 mm)`

B.   `text(3.6 mm)`

C.   `text(4.2 mm)`

D.   `text(5.4 mm)`

E.   `text(7.0 mm)`

Show Answers Only

`text(Part 1:)\ B`

`text(Part 2:)\ C`

Show Worked Solution

`text(Part 1)`

`text(95% of scores lie between ±2 std dev)`

`bar x = 4.8, \ \ \ s = 1.2`

`text(Lower limit)` `= bar x – 2text(s)`
  `= 4.8 – 2(1.2)`
  `= 2.4\ text(mm)`
`text(Upper limit)` `= bar x + 2text(s)`
  `= 4.8 + 2(1.2)`
  `= 7.2\ text(mm)`

 
`=>B`
 

`text(Part 2)`

`z` `= \ \ (x – bar x)/s`
`-0.5` `= \ \ (x – 4.8)/1.2`
`-0.6` `= \ \ x – 4.8`
`x` `= \ \ 4.2\ text(mm)`

 
`=>C`


Filed Under: Normal Distribution Tagged With: Band 3, Band 4, smc-600-10-Single z-score, smc-600-20-z-score Intervals

CORE, FUR1 2011 VCAA 6-8 MC

When blood pressure is measured, both the systolic (or maximum) pressure and the diastolic (or minimum) pressure are recorded.

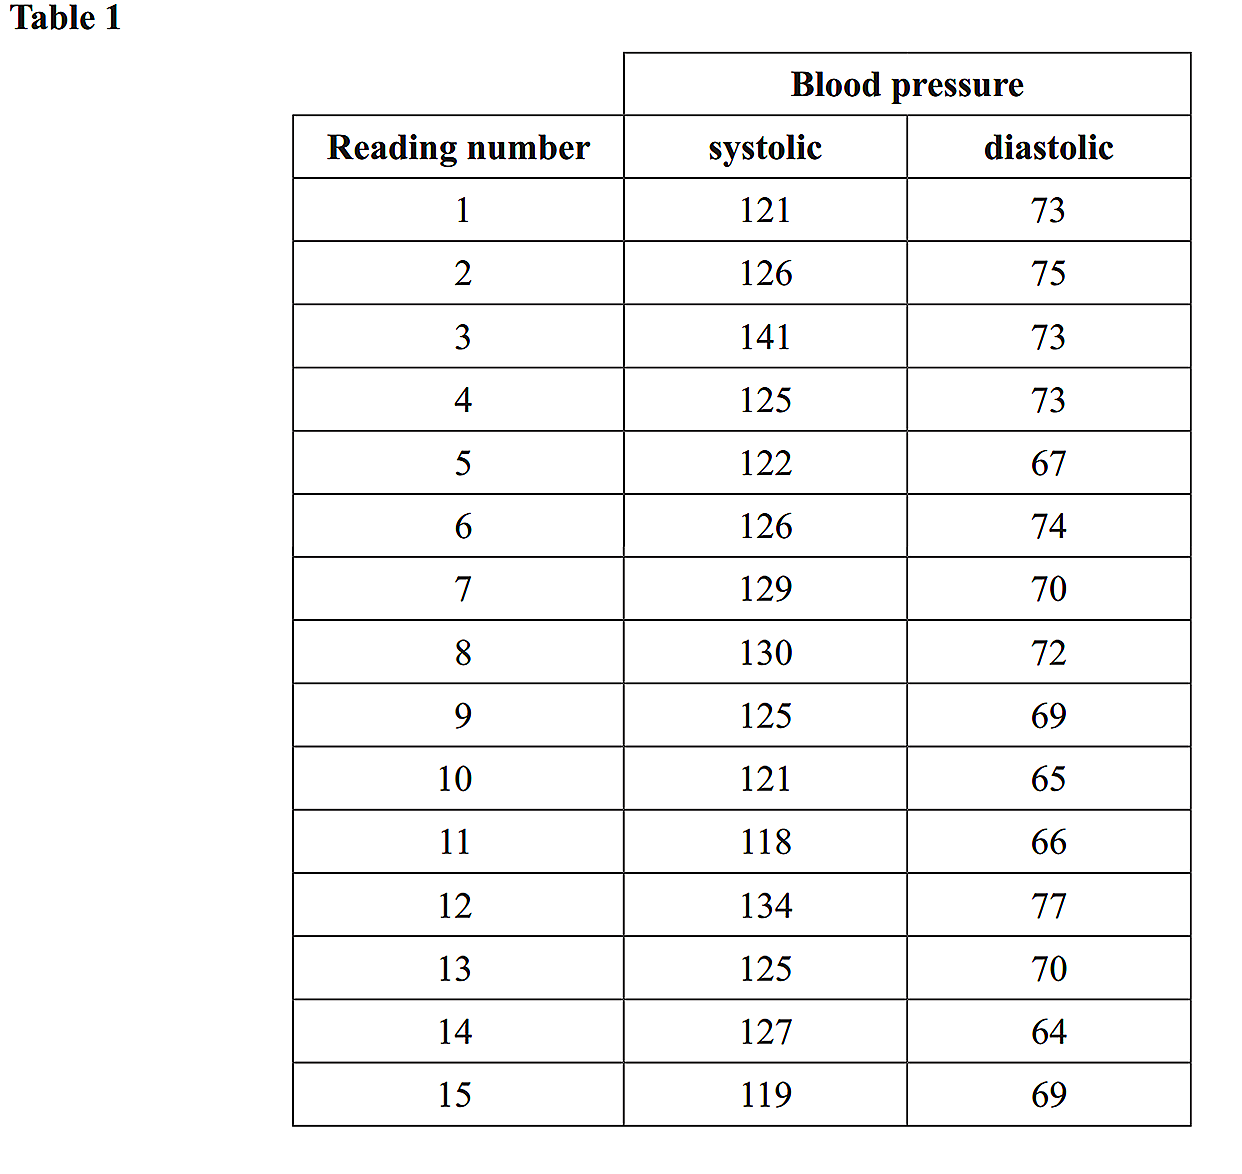
Table 1 displays the blood pressure readings, in mmHg, that result from fifteen successive measurements of the same person's blood pressure.
 

core 2011  VCAA 6-8

Part 1

Correct to one decimal place, the mean and standard deviation of this person's systolic blood pressure measurements are respectively

A.   `124.9 and 4.4`

B.   `125.0 and 5.8`

C.   `125.0 and 6.0`

D.   `125.9 and 5.8`

E.   `125.9 and 6.0`


Part 2

Using systolic blood pressure (systolic) as the response variable, and diastolic blood pressure (diastolic) as the explanatory variable, a least squares regression line is fitted to the data in Table 1.

The equation of the least squares regression line is closest to

A.   `text(systolic) = 70.3 + 0.790 xx text(diastolic)`

B.   `text(diastolic) = 70.3 + 0.790 xx text(systolic)`

C.   `text(systolic) = 29.3 + 0.330 xx text(diastolic)`

D.   `text(diastolic) = 0.330 + 29.3 xx text(systolic)`

E.   `text(systolic) = 0.790 + 70.3 xx text(diastolic)`


Part 3

From the fifteen blood pressure measurements for this person, it can be concluded that the percentage of the variation in systolic blood pressure that is explained by the variation in diastolic blood pressure is closest to

A.   `25.8text(%)`

B.   `50.8text(%)`

C.   `55.4text(%)`

D.   `71.9text(%)`

E.   `79.0text(%)`

Show Answers Only

`text(Part 1:)\ E`

`text(Part 2:)\ A`

`text(Part 3:)\ A`

Show Worked Solution

`text(Part 1)`

`text{By calculator (using sample standard deviation)}`

`text{the results are: }`

`text(Mean = 125.9, std dev = 6.0)`

`=>E`


`text(Part 2)`

`text{By calculator (making sure diastolic values are}`

`text{the explanatory or}\ x text{-variable), the regression line}`

`text(can be expressed as follows,)`

`text(systolic) = 70.3 + 0.790 xx text(diastolic)`

`=>A`


`text(Part 3)`

`text{By calculator, the regression line (above) should}`

`text(have found) \ \ r^2 = 0.258,\ text(which means that)`

`text(25.8% of the variation in systolic pressure can be)`

`text(explained by variation in diastolic pressure.)`

`=>A`

Filed Under: Correlation and Regression, Summary Statistics Tagged With: Band 4, smc-265-10-r / r^2 and Association, smc-265-20-Find LSRL Equation/Gradient, smc-468-20-Mean, smc-468-30-Std Dev

CORE, FUR1 2011 VCAA 5 MC

The boxplots below display the distribution of average pay rates, in dollars per hour, earned by workers in 35 countries for the years 1980, 1990 and 2000.
 

Based on the information contained in the boxplots, which one of the following statements is not true?

  1. In 1980, over 50% of the countries had an average pay rate less than $8.00 per hour.
  2. In 1990, over 75% of the countries had an average pay rate greater than $5.00 per hour.
  3. In 1990, the average pay rate in the top 50% of the countries was higher than the average pay rate for any of the countries in 1980.
  4. In 1990, over 50% of the countries had an average pay rate less than the median average pay rate in 2000.
  5. In 2000, over 75% of the countries had an average pay rate greater than the median average pay rate in 1980. 


Show Answers Only

`E`

Show Worked Solution

`text(By elimination,)`

`text(In A, 1980 median is below $8.00. True)`

`text(In B, 1990 Q1 is above $5.00. True)`

`text(In C, 1990 median is above 1980 high. True)`

`text(In D, 1990 median is below 2000 median. True)`

`text(In E, 2000 Q1 is below 1980 median. NOT true)`

`=>  E`

Filed Under: Graphs - Stem/Leaf and Boxplots Tagged With: Band 4, smc-643-20-Parallel Box-Plots

CORE, FUR1 2009 VCAA 12 MC

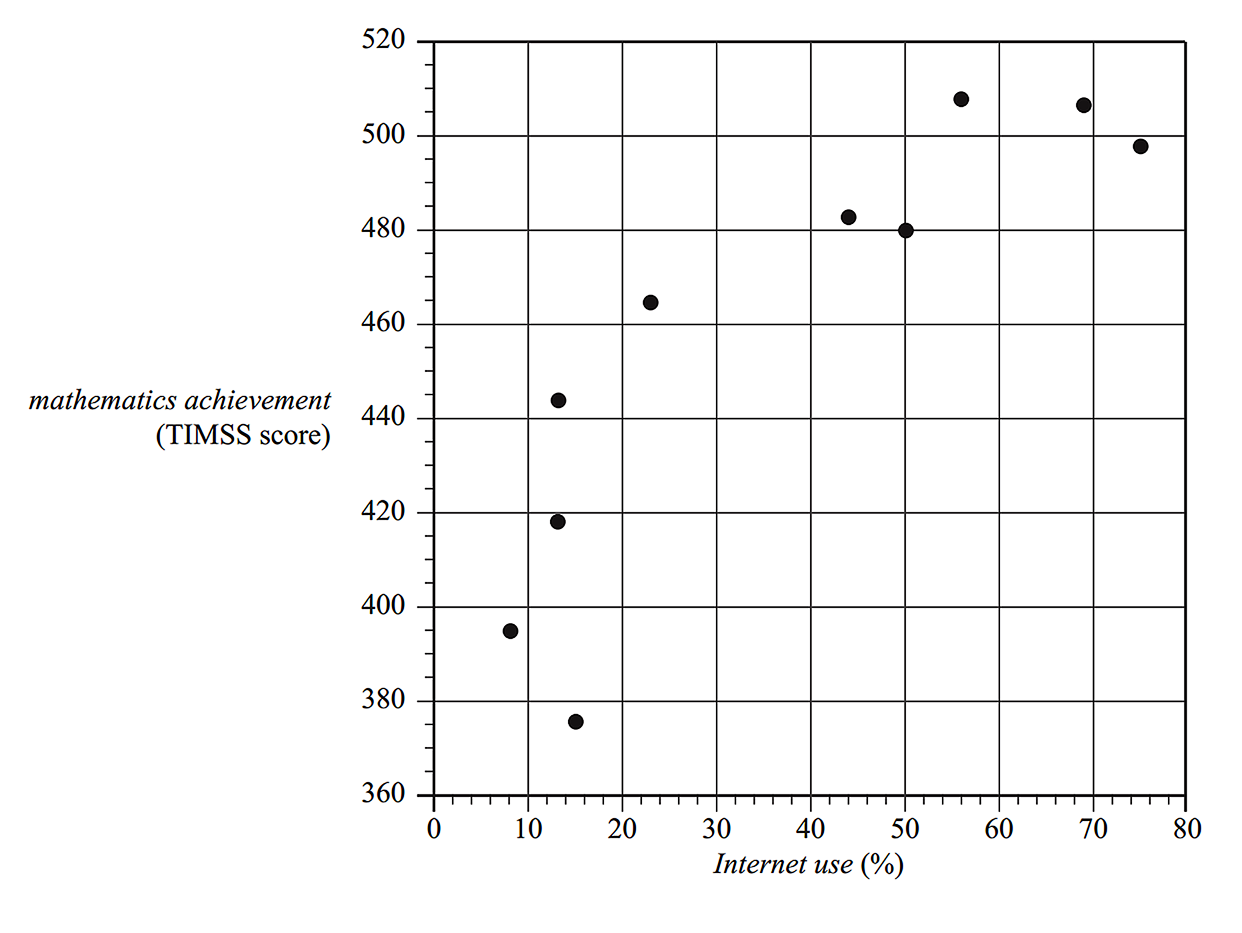
The mathematics achievement level (TIMSS score) for grade 8 students and the general rate of Internet use (%) for 10 countries are displayed in the scatterplot below.

To linearise the data, it would be best to plot 

A.   mathematics achievement against Internet use.

B.   log (mathematics achievement) against Internet use.

C.   mathematics achievement against log (Internet use).

D.   mathematics achievement against (Internet use)2.

E.  ` 1/text(mathematics achievement)` against Internet use.

Show Answers Only

`C`

Show Worked Solution

`text(The shape of the data is logarithmic.)`

`:.\ text(To linearise the data, it would be best to)`

`text{plot mathematics achievement against}`

`text{log (Internet use). }`

`=>  C`

Filed Under: Correlation and Regression Tagged With: Band 4, smc-265-70-Linearise - log10

CORE, FUR1 2009 VCAA 7 MC

The level of oil use in certain countries is approximately normally distributed with a mean of 42.2 units and a standard deviation of 10.2 units.

The percentage of these countries in which the level of oil use is greater than 32 units is closest to

A.     5%

B.   16%

C.   34%

D.   84%

E.   97.5%

Show Answers Only

`D`

Show Worked Solution
`bar x` `=42.2` `s` `=10.2`
`z text(-score (32))` `=(x – barx)/s`
  `=(32-42.2)/10.2`
  `=–1`

 
`text(68% lie between)\ z text(-score of  –1 and 1)`

`=>\ text(34%  lie between z-score  –1 and 0)`

`text(50% lie above z-score of 0)`

`∴\ text(% above 32 units)` `=34 + 50`
  `= 82text(%)`

 
`rArr  D`

Filed Under: Normal Distribution Tagged With: Band 4, smc-600-10-Single z-score

CORE, FUR1 2008 VCAA 10 MC

A large study of Year 12 students shows that there is a negative association between the time spent doing homework each week and the time spent watching television. The correlation coefficient is `r = – 0.6`.

From this information it can be concluded that

  1. the time spent doing homework is 60% lower than the time spent watching television.  
  2. 36% of students spend more time watching television than doing homework.  
  3. the slope of the least squares regression line is 0.6.
  4. if a student spends less time watching television, they will do more homework.
  5. an increased time spent watching television is associated with a decreased time doing homework.
Show Answers Only

`E`

Show Worked Solution

`text(A negative correlation means that the greater the time)`

`text(spent watching television is associated with the less)`

`text(time spent doing homework.)`

`D\ text(assumes one causes the other and is therefore incorrect.)`

`=>E`

Filed Under: Correlation and Regression Tagged With: Band 4, smc-265-10-r / r^2 and Association

CORE, FUR1 2008 VCAA 8-9 MC

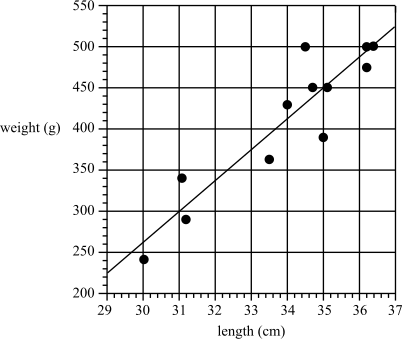
The weights (in g) and lengths (in cm) of 12 fish were recorded and plotted in the scatterplot below. The least squares regression line that enables the weight of these fish to be predicted from their length has also been plotted.
 

Part 1

The least squares regression line predicts that the weight (in g) of a fish of length 30 cm would be closest to

A.   `240`

B.   `252`

C.   `262`

D.   `274`

E.   `310`

 
Part 2

The median weight (in g) of the 12 fish is closest to

A.   `346`

B.   `375`

C.   `440`

D.   `450`

E.   `475`

Show Answers Only

`text(Part 1:)\ C`

`text(Part 2:)\ C`

Show Worked Solution

`text(Part 1)`

`text{The regression line crosses the 30cm length (on the}`

`xtext{-axis) at approx 262.}`

`=>C`


`text(Part 2)`

`text(12 weight data points – the median will be the average of)`

`text(the 6th and 7th.)`

`text(From the graph,)`

`text(6th highest weight = 430 g)`

`text(7th highest weight = 450 g)`

`:.\ text(Median)` `=(430+450)/2`
  `=440\ text(g)`

`=> C` 

Filed Under: Correlation and Regression, Summary Statistics Tagged With: Band 4, smc-468-40-Median Mode and Range

CORE, FUR1 2008 VCAA 6-7 MC

The pulse rates of a large group of 18-year-old students are approximately normally distributed with a mean of 75 beats/minute and a standard deviation of 11 beats/minute.

Part 1

The percentage of 18-year-old students with pulse rates less than 75 beats/minute is closest to

A.   32%

B.   50%

C.   68%

D.   84%

E.   97.5%


Part 2

The percentage of 18-year-old students with pulse rates less than 53 beats/minute or greater than 86 beats/minute is closest to

A.      2.5%

B.      5%

C.    16%

D.    18.5%

E.     21%

Show Answers Only

`text(Part 1:)\ B`

`text(Part 2:)\ D`

Show Worked Solution

`text(Part 1)`

`barx=75,\ \ \ s=11`

`text(In a normal distribution, mean = median.)`

`:.\ text(50% of group are below mean of 75)`

`=>B`


`text(Part 2)`

♦ Mean mark 44%.
MARKERS’ COMMENT: Two applications of the 68-95-99.7% rule are required. A good strategy is to first draw a normal curve and shade the required areas.

`barx=75,\ \ \ s=11`

`z text{-score (53)}` `=(x-barx) /s`
   `=(53-75)/11`
   `= – 2`


`z text{-score (86)}` `= (86-75)/11`
  `=1`

core 2008 VCAA 6-7

`text(From the diagram, the % of students that have a)`

`z text(-score below –2 or above 1)`

 `=2.5+16`

`=18.5 text(%)`

 `=>D`

Filed Under: Normal Distribution Tagged With: Band 4, Band 5, smc-600-10-Single z-score, smc-600-20-z-score Intervals

CORE, FUR1 2008 VCAA 5 MC

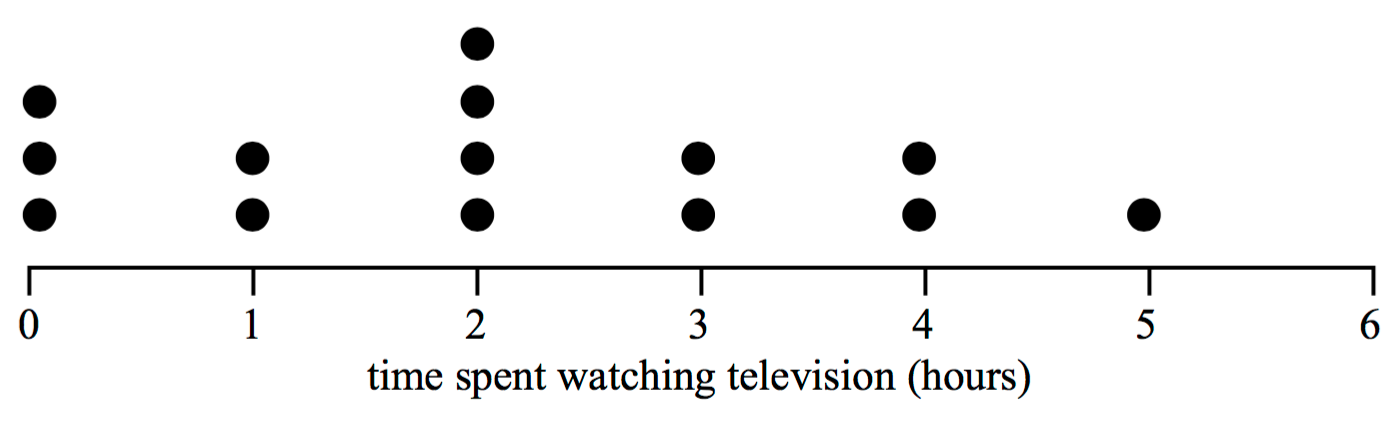
A sample of 14 people were asked to indicate the time (in hours) they had spent watching television on the previous night. The results are displayed in the dot plot below.
 

    2008 5
 

Correct to one decimal place, the mean and standard deviation of these times are respectively

A.   `bar x=2.0\ \ \ \ \ s=1.5`

B.   `bar x=2.1\ \ \ \ \ s=1.5`  

C.   `bar x=2.1\ \ \ \ \ s=1.6`

D.   `bar x=2.6\ \ \ \ \ s=1.2`

E.   `bar x=2.6\ \ \ \ \ s=1.3` 

Show Answers Only

`C`

Show Worked Solution

`text(Data points are:)`

`0,0,0,1,1,2,2,2,2,3,3,4,4,5`

`text(By calculator (using sample standard deviation))`

`bar x=2.1,\ \ s=1.6`

`=>  C`

Filed Under: Graphs - Histograms and Other, Summary Statistics Tagged With: Band 4, smc-468-20-Mean, smc-468-30-Std Dev, smc-644-10-Dot Plots

CORE, FUR1 2008 VCAA 1-4 MC

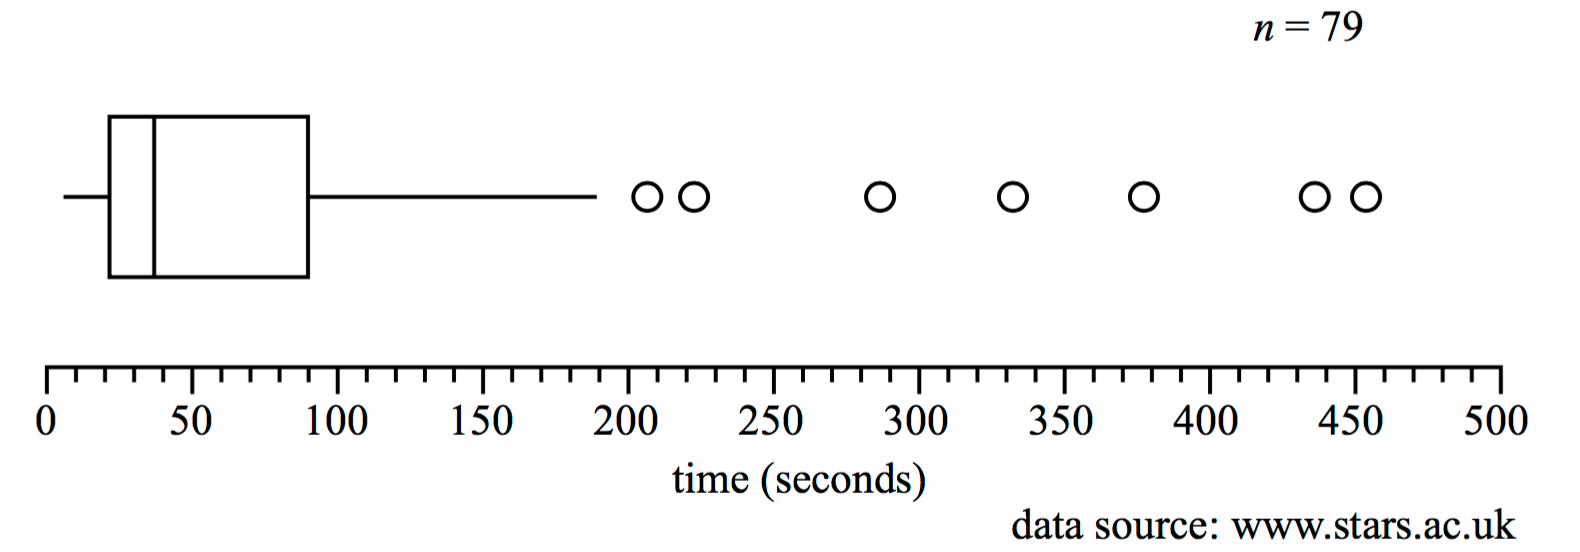
The box plot below shows the distribution of the time, in seconds, that 79 customers spent moving along a particular aisle in a large supermarket.
 

     2008 1-4

Part 1

The longest time, in seconds, spent moving along this aisle is closest to

A.    `40`

B.    `60`

C.   `190`

D.   `450`

E.   `500`


Part 2

The shape of the distribution is best described as

A.   symmetric.

B.   negatively skewed.

C.   negatively skewed with outliers.

D.   positively skewed.

E.   positively skewed with outliers.


Part 3

The number of customers who spent more than 90 seconds moving along this aisle is closest to

A.    `7`

B.   `20`

C.   `26`

D.   `75`

E.   `79`


Part 4

From the box plot, it can be concluded that the median time spent moving along the supermarket aisle is

A.   less than the mean time.

B.   equal to the mean time.

C.   greater than the mean time

D.   half of the interquartile range.

E.   one quarter of the range.

Show Answers Only

`text(Part 1:)\ D`

`text(Part 2:)\ E`

`text(Part 3:)\ B`

`text(Part 4:)\ A`

Show Worked Solution

`text(Part 1)`

`text(Longest time is represented by the farthest right)`

`text(data point.)`

`=>D`


`text(Part 2)`

`text(Positively skewed as the tail of the distribution can)`

`text(clearly be seen to extend to the right.)`

`text(The data also clearly shows outliers.)`

`=>E`


`text(Part 3)`

♦ Mean mark 43%.
MARKERS’ COMMENT: Note that the outliers are already accounted for in the boxplot.

`text(From the box plot,)`

`text(Q)_3=90\ text{s}\ \ text{(i.e. 25% spend over 90 s)}`

`:.\ text(Customers that spend over 90 s)`

`= 25text(%) xx 79`

`=19.75`

`=>B`


`text(Part 4)`

`text(The mean is greater than the median for positively)`

`text(skewed data.)`

`=>A`

Filed Under: Graphs - Stem/Leaf and Boxplots Tagged With: Band 3, Band 4, Band 5, smc-643-10-Single Box-Plots, smc-643-70-Distribution Description

CORE*, FUR1 2010 VCAA 7 MC

Each trading day, a share trader buys and sells shares according to the rule

 `T_(n+1)=0.6 T_n + 50\ 000` 

where `T_n` is the number of shares the trader owns at the start of the `n`th trading day.

From this rule, it can be concluded that each day

  1. the trader sells 60% of the shares that she owned at the start of the day and then buys another 50 000 shares.
  2. the trader sells 40% of the shares that she owned at the start of the day and then buys another 50 000 shares.
  3. the trader sells 50 000 of the shares that she owned at the start of the day.
  4. the trader sells 60% of the 50 000 shares that she owned at the start of the day.
  5. the trader sells 40% of the 50 000 shares that she owned at the start of the day.
Show Answers Only

`B`

Show Worked Solution

`T_(n+1)=0.6\ \T_n + 50\ 000`

`text(The difference equation describes a rule)`

`text(where a trader sells 40% of shares owned on)`

`text{the day before (left with 60% or 0.6}T_n text{)} `

`text(and then buys another 50 000 each day.)`

`=> B`

Filed Under: Difference Equations - MC, Recursion - General Tagged With: Band 4, smc-714-60-Identify RR

PATTERNS, FUR1 2012 VCAA 6 MC

The second and third terms of a geometric sequence are 100 and 160 respectively.

The sum of the first ten terms of this sequence is closest to

A.   `4300`

B.   `6870`

C.  `11\ 000`

D.  `11\ 290`

E.  `11\ 350`

Show Answers Only

`E`

Show Worked Solution

`text (GP where)\ \ \ T_2 = 100, and T_3 = 160` 

`:. r= T_3/T_2 = 160/100 = 1.6`

`T_2` `= ar`
`100`  `= a xx 1.6`
 `:. a` `= 62.5`


`text (Find)\ \ S_10`

`S_n` `= (a (r^n – 1))/ (r-1)`
`S_10` `= (62.5 (1.6^10 – 1))/(1.6 – 1)`
  `=11\ 349.07…`

`rArr E`

Filed Under: APs and GPs - MC Tagged With: Band 4

PATTERNS, FUR1 2012 VCAA 3-4 MC

 Use the following information to answer Parts 1 and 2.

As part of a savings plan, Stacey saved $500 the first month and successively increased the amount that she saved each month by $50. That is, in the second month she saved $550, in the third month she saved $600, and so on.

Part 1

The amount Stacey will save in the 20th month is

A.  `$1450`

B.  `$1500`

C.  `$1650`

D.  `$1950`

E.  `$3050`


Part 2

The total amount Stacey will save in four years is

A.  `$13\ 400`

B.  `$37\ 200`

C.  `$58\ 800`

D.  `$80\ 400`

E.  `$81\ 600`

Show Answers Only

`text (Part 1:)\ A`

`text (Part 2:)\ D`

Show Worked Solution

`text (Part 1)`

`text (Sequence is 500, 550, 600,…)`

`text (AP where)\ \  a` `= 500, and` 
 `d` `= text (550 – 500 = 50)`
 `T_n` `= a + (n – 1) d` 
`T_20` `= 500 + (20 – 1)50`
  `= 1450`

`rArr A`


`text (Part 2)`

`n` `= 4 xx 12 = 48` 
 `S_n` `= n/2 [2a + (n-1)d]`
`S_4` `= 48/2 [2 xx 500 + (48-1)50]`
  `= 24 [1000 + 2350]`
  `= 80\ 400`

`rArr D`

Filed Under: APs and GPs - MC Tagged With: Band 3, Band 4

GEOMETRY, FUR1 2010 VCAA 5-6 MC

A soccer goal is 7.4 metres wide.

A rectangular region `ABCD` is marked out directly in front of the goal.

In this rectangular region, `AB = DC = 11.0\ text(metres)` and `AD = BC = 5.5\ text(metres.)`

The goal line `XY` lies on `DC` and `M` is the midpoint of both `DC` and `XY`.

Part 1

Ben kicks the ball from point `B`. It travels in a straight line to the base of the goal post at point `Y` on the goal line.

Angle `CBY`, the angle that the path of the ball makes with the line `BC`, is closest to

A.   `18°` 

B.   `33°` 

C.   `45°` 

D.   `67°` 

E.   `72°` 


 Part 2

David kicks the ball from point `D` in a straight line to Tara. Tara is standing near point `T` on the line `AB`, a distance of 4.5 metres from point `A`. Tara then kicks the ball from point `T` in a straight line to the midpoint of the goal line at `M`.

The total distance that the ball will travel in moving from point `D` to `T` to `M` is closest to

A.    `5.5\ text(m)`

B.   `12.1\ text(m)`

C.   `12.5\ text(m)`

D.   `12.7\ text(m)`

E.   `12.9\ text(m)`

Show Answers Only

`text(Part 1:)\ A`

`text(Part 2:)\ D`

Show Worked Solution

`text(Part 1)`


`YC + 7.4 + DX` `=11.0`
`2YC` `= 3.6\ \ \ (DX=YC)`
`YC` `= 1.8`
`tan\ /_ CBY` `= 1.8/5.5 = 0.3272…`
`/_ CBY` `= 18.12…°`

`=> A`


`text(Part 2)`

`text(Using Pythagoras in)\ Delta DAT,`

`DT^2` `= 5.5^2 + 4.5^2`
  `= 50.5`
`:. DT` `= 7.106…`


`text(In)\ Delta MFT`

`FT = 5.5 – 4.5 = 1`

`text(Using Pythagoras)`

`MT^2` `= 1^2 + 5.5^2`
  `= 31.25`
`MT` `= 5.59…`


`:.\ text(The distance the ball travels)`

`= 7.106… + 5.59…`

`= 12.69…\ text(m)`

`=> D`


Filed Under: Trig - Harder Applications Tagged With: Band 4

GEOMETRY, FUR1 2010 VCAA 2 MC

A circle has a circumference of 10 cm.

The radius of this circle is closest to

A.  `1.3\ text(cm)`

B.  `1.6\ text(cm)`

C.  `1.8\ text(cm)`

D.  `3.2\ text(cm)`

E.  `5.0\ text(cm)`

Show Answers Only

`B`

Show Worked Solution
`C` `= 2πr`
`10` `= 2 xx π xx r`
`:. r` `= 10/(2 xx π)`
  `= 1.59…\ text(cm)`

`=> B`


Filed Under: Perimeter, Area and Volume Tagged With: Band 4

GEOMETRY, FUR1 2010 VCAA 3 MC

An equilateral triangle of side length 6 cm is cut from a sheet of cardboard.

A circle is then cut out of the triangle, leaving a hole of diameter 2 cm as shown below.
 

The area of cardboard remaining, as shown by the shaded region in the diagram above, is closest to

A.    `3\ text(cm²)`

B.    `9\ text(cm²)`

C.  `12\ text(cm²)`

D.  `15\ text(cm²)`

E.  `16\ text(cm²)`

Show Answers Only

`C`

Show Worked Solution

`text(Equilateral triangle)\ =>\ 3 xx 60°\ text(angles.)`

`text(Area of)\ Delta` `= 1/2 ab sin C`
  `= 1/2 xx 6 xx 6 xx sin 60°`
  `= 15.58\ text(cm²)`


`text(Area of circle)` `= pir^2`
  `= pi xx 1^2`
  `= 3.14\ text(cm²)`

 
`:.\ text(Area of cardboard remaining)`

`= 15.58- 3.14`

`= 12.44\ text(cm²)`

 
`=> C`

Filed Under: Non-Right-Angled Trig, Perimeter, Area and Volume Tagged With: Band 4, smc-3589-10-Sine rule

CORE, FUR1 2010 VCAA 7-9 MC

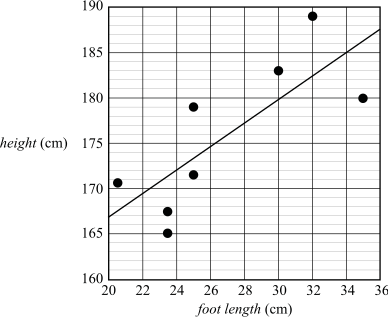
The height (in cm) and foot length (in cm) for each of eight Year 12 students were recorded and displayed in the scatterplot below.
A least squares regression line has been fitted to the data as shown.
 

Part 1

By inspection, the value of the product-moment correlation coefficient `(r)` for this data is closest to

  1. `0.98`
  2. `0.78`
  3. `0.23`
  4. `– 0.44`
  5. `– 0.67`


Part 2

The explanatory variable is foot length.

The equation of the least squares regression line is closest to

  1. height = –110 + 0.78 × foot length.
  2. height = 141 + 1.3 × foot length.
  3. height = 167 + 1.3 × foot length.
  4. height = 167 + 0.67 × foot length.
  5. foot length = 167 + 1.3 × height.


Part 3

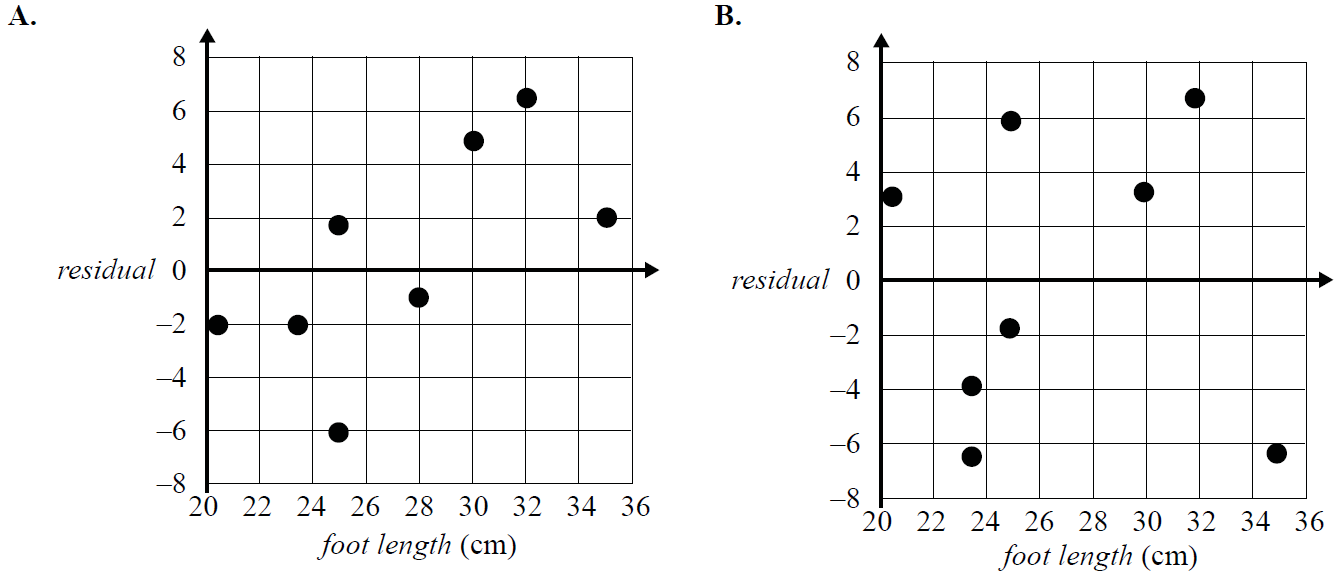
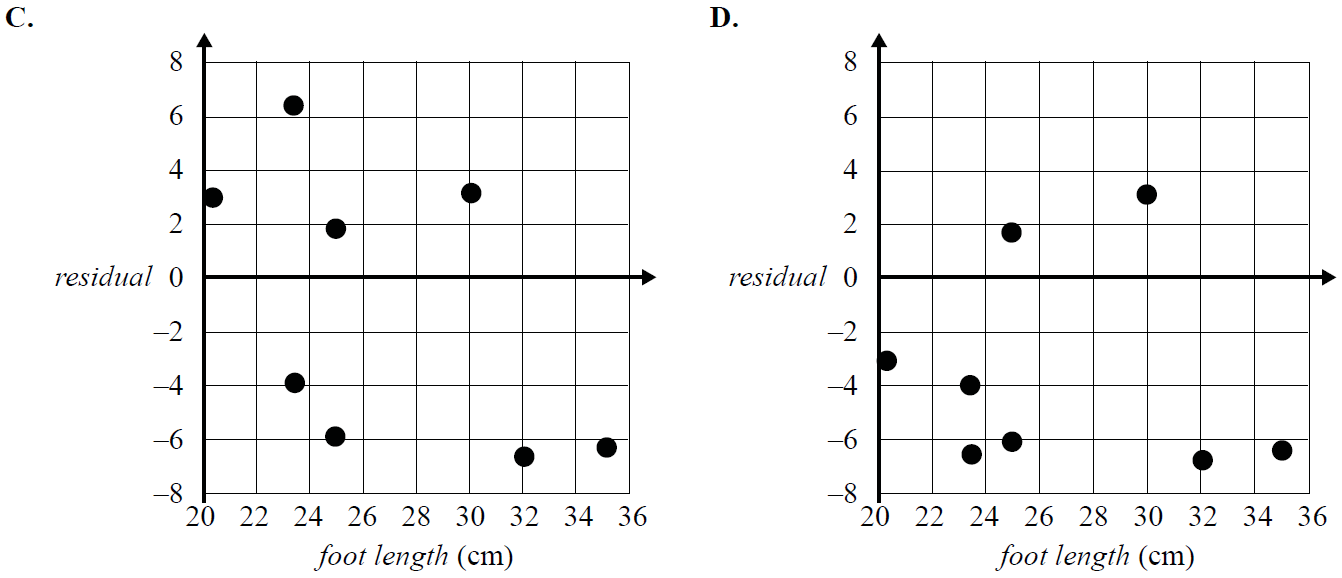
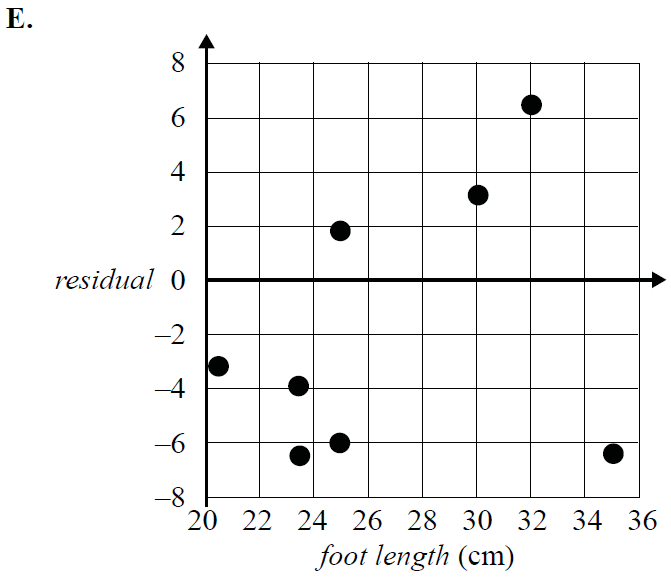
The plot of the residuals against foot length is closest to

CORE, FUR1 2010 VCAA 7-9 MCab

CORE, FUR1 2010 VCAA 7-9 MCcd

CORE, FUR1 2010 VCAA 7-9 MCe

Show Answers Only

`text(Part 1:)\ B`

`text(Part 2:)\ B`

`text(Part 3:)\ B`

Show Worked Solution

`text(Part 1)`

`text(The correlation is positive and strong.)`

`text(Eliminate)\ C, D\ text(and)\ E.`

`r= 0.98\  text(is too strong. Eliminate)\ A.`

`=> B`


`text(Part 2)`

♦♦ Mean mark 35%.
STRATEGY: An alternate but less efficient strategy could be to find 2 points and calculate the gradient and then use the point gradient formula.

`text(The intercept with the height axis)\ (ytext{-axis)}`

`text{is below 167 because that is the height when}`

`text{foot length = 20 cm.}`

`text(Eliminate)\ C, D\ text(and)\ E.`

`text(The gradient is approximately 1.3, by observing)`

`text(the increase in height values when the foot)`

`text(length increases from 20 to 22 cm.)`

`=>  B`


`text(Part 3)`

`text(First residual is positive. Eliminate)\ A, D, E.`

`text(The next 3 residuals are negative. Eliminate)\ C`

`=>  B`

Filed Under: Correlation and Regression Tagged With: Band 3, Band 4, Band 5, smc-265-10-r / r^2 and Association, smc-265-20-Find LSRL Equation/Gradient, smc-265-50-Residuals

Trig Ratios, EXT1 2008 HSC 6a

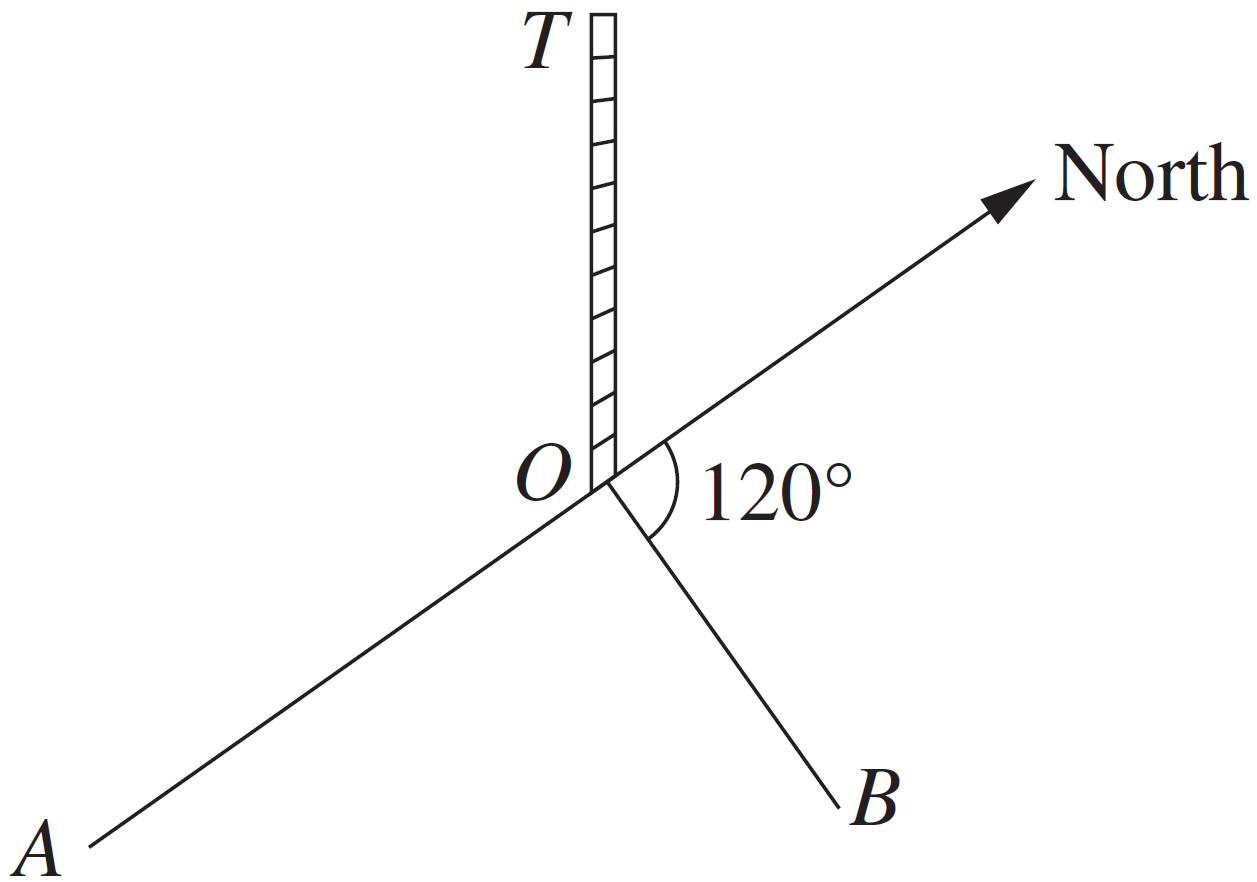
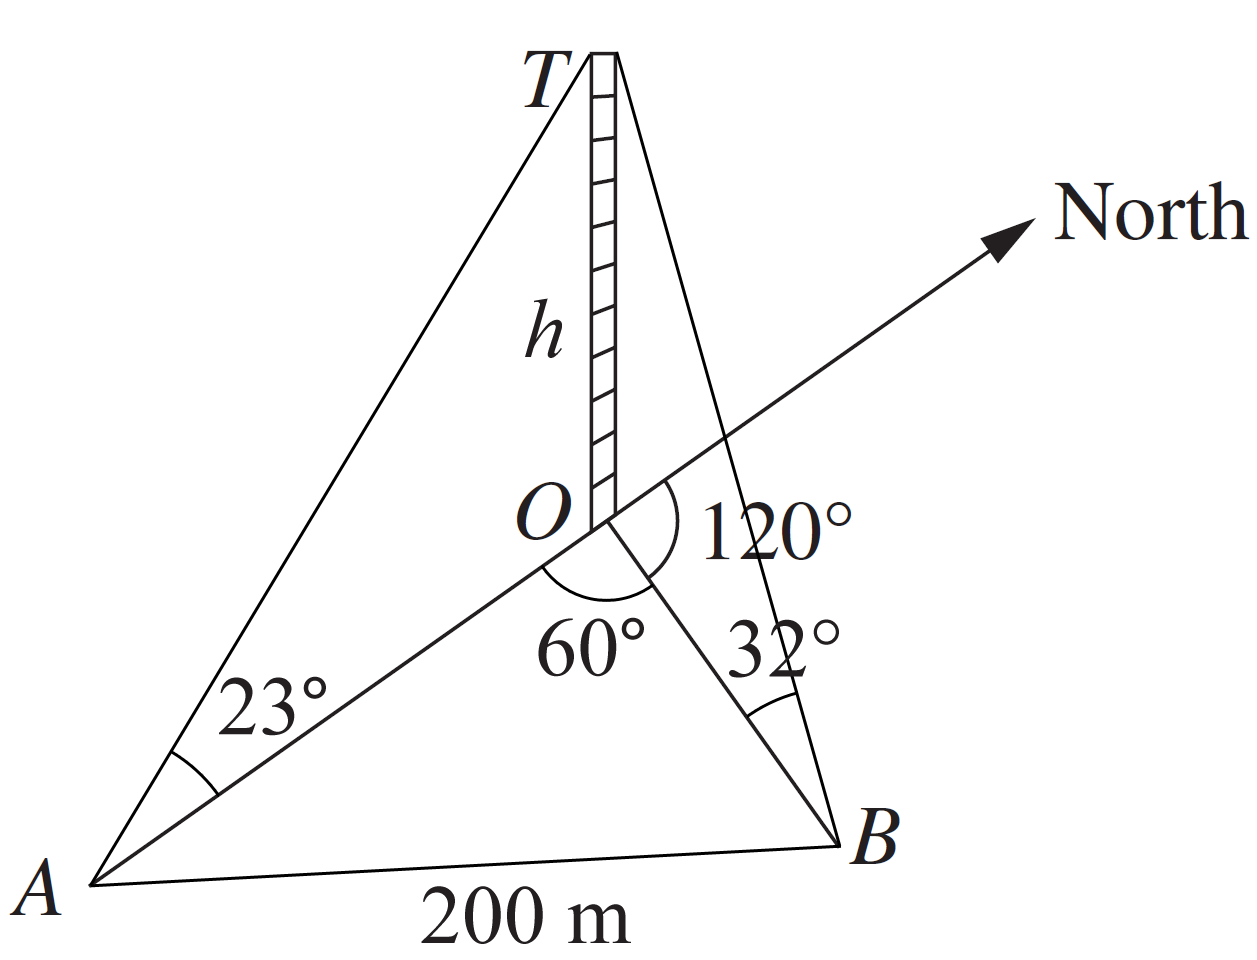
From a point  `A`  due south of a tower, the angle of elevation of the top of the tower  `T`, is 23°. From another point  `B`, on a bearing of 120° from the tower, the angle of elevation of  `T`  is 32°. The distance  `AB`  is 200 metres.
 

Trig Ratios, EXT1 2008 HSC 6a 
 

  1. Copy or trace the diagram into your writing booklet, adding the given information to your diagram.  (1 mark)
  2. Hence find the height of the tower.   (3 marks)
Show Answers Only
  1. Trig Ratios, EXT1 2008 HSC 6a Answer

  2. `96\ text(m)`
Show Worked Solution

(i) 

Trig Ratios, EXT1 2008 HSC 6a Answer 


(ii)  `text(Find)\ \ OT = h`

`text(Using the cosine rule in)\ Delta AOB :`

`200^2 = OA^2 + OB^2 – 2 * OA * OB * cos 60\ …\ text{(*)}`

 `text(In)\ Delta OAT,\tan 23^@= h/(OA)`

`=> OA= h/(tan 23^@)\  …\ (1)`

 `text(In)\ Delta OBT,\ tan 32^@= h/(OB)`

`=> OB= h/(tan 32^@)\ \ \ …\ (2)`
 

`text(Substitute)\ (1)\ text(and)\ (2)\ text(into)\ text{(*)}`

`200^2` `= (h^2)/(tan^2 23^@) + (h^2)/(tan^2 32^@) – 2 * h/(tan 23^@) * h/(tan 32^@) * 1/2`
  `= h^2 (1/(tan^2 23^@) + 1/(tan^2 32^@) + 1/(tan23^@ * tan32^@) )`
  `= h^2 (4.340…)`
`h^2` `= (40\ 000)/(4.340…)`
  `= 9214.55…`
`:. h` `= 95.99…`
  `= 96\ text(m)\ \ \ text{(to nearest m)}`

Filed Under: 5. Trig Ratios EXT1 Tagged With: Band 3, Band 4

Functions, EXT1 F1 2008 HSC 5a

Let  `f(x) = x-1/2 x^2`  for  `x <= 1`.  This function has an inverse,  `f^(-1) (x)`. 

  1.  Sketch the graphs of  `y = f(x)`  and  `y = f^(-1) (x)`  on the same set of axes. (Use the same scale on both axes.)  (2 marks)

    --- 8 WORK AREA LINES (style=lined) ---

  2.  Find an expression for  `f^(-1) (x)`.   (3 marks)

    --- 6 WORK AREA LINES (style=lined) ---

  3.  Evaluate  `f^(-1) (3/8)`.   (1 mark)

    --- 3 WORK AREA LINES (style=lined) ---

Show Answers Only

 a.    
Inverse Functions, EXT1 2008 HSC 5a Answer

b.    `y = 1-sqrt(1-2x)`

c.    `1/2`

Show Worked Solution
a.    

Inverse Functions, EXT1 2008 HSC 5a Answer

b.     `y = x-1/2 x^2,\ \ \ x <= 1`

 
`text(Inverse function: swap)\ \ x↔y,`

`x` `= y-1/2 y^2,\ \ \ y <= 1`
`2x` `= 2y-y^2`
`y^2-2y + 2x` `= 0`


`y` `= (2 +- sqrt( (-2)^2-4 * 1 * 2x) )/2`
  `= (2 +- sqrt(4-8x))/2`
  `= (2 +- 2 sqrt(1-2x))/2`
  `= 1 +- sqrt (1-2x)`


`:. y = 1-sqrt(1-2x), \ \ (y <= 1)`


c.     `f^(-1) (3/8)` `= 1-sqrt(1 -2(3/8))`
    `= 1-sqrt(1-6/8)`
    `= 1-sqrt(1/4)`
    `= 1-1/2`
    `= 1/2`

Filed Under: Inverse Functions, Inverse Functions, Other Inverse Functions EXT1 Tagged With: Band 4, smc-1034-20-Other Functions, smc-6641-20-Other Functions

CORE, FUR1 2012 VCAA 11-12 MC

Use the following information to answer Parts 1 and 2.

The table below shows the long-term average rainfall (in mm) for summer, autumn, winter and spring. Also shown are the seasonal indices for summer and autumn. The seasonal indices for winter and spring are missing.

Part 1

The seasonal index for spring is closest to

A.  `0.90`

B.  `1.03`

C.  `1.13`

D.  `1.15`

E.  `1.17`


Part 2

In 2011, the rainfall in autumn was 48.9 mm.

The deseasonalised rainfall (in mm) for autumn is closest to

A.  `48.4`

B.  `48.9`

C.  `49.4`

D.  `50.9`

E.  `54.0`

Show Answers Only

`text (Part 1:)\ C`

`text (Part 2:)\ A`

Show Worked Solution

`text (Part 1)`

`text (Average Seasonal Rainfall)`

`= (52.0 + 54.5 + 48.8 + 61.3)/4` 

`=54.15`

`:.\ text {Seasonal index (Spring)}`

`= 61.3/54.15`

`= 1.132…`

`rArr C`


`text (Part 2)`

`:.\ text {Deseasonalised Rainfall (Autumn)}`

`= 48.9/1.01`

`=48.415`

`rArr A`

Filed Under: Time Series Tagged With: Band 4, smc-266-10-Seasonal Index from a Table, smc-266-20-(De)Seasonalising Data

CORE, FUR1 2012 VCAA 10 MC

Which one of the following statistics is never negative?

A.  a median

B.  a residual

C.  a standardised score

D.  an interquartile range

E.  a correlation coefficient

Show Answers Only

`D`

Show Worked Solution

`text (S) text(ince IQR)\ = Q_3 – Q_1, and`

`Q_1\ text(is always less than)\ Q_3,`

`text(IQR is always positive.)`

`rArr D`

Filed Under: Summary Statistics Tagged With: Band 4, smc-468-40-Median Mode and Range, smc-468-50-IQR / Outliers

CORE, FUR1 2012 VCAA 8 MC

The maximum wind speed and maximum temperature were recorded each day for a month. The data is displayed in the scatterplot below and a least squares regression line has been fitted. The response variable is temperature. The explanatory variable is wind speed.
 

 The equation of the least squares regression line is closest to

A.  `text(temperature) = 25.7 - 0.191 xx text(wind speed)`

B.  `text(wind speed) = 25.7 - 0.191 xx text(temperature)`

C.  `text(temperature) = 0.191 + 25.7 xx text(wind speed)`

D.  `text(wind speed) = 25.7 + 0.191 xx text(temperature)`

E.  `text(temperature) = 25.7 + 0.191 xx text(wind speed)`

Show Answers Only

`A`

Show Worked Solution

`text (Using the form)\ \ y = mx +b\ \ text(where)`

`y rArr text (temperature)`

`x rArr text (wind speed)`

`text (b = 25.7 (y intercept))`


`text (Gradient is negative because temperature decreases as)`

`text(wind speed increases.)`

`:.\ text (Equation must take the form of A.)`

`rArr A`

Filed Under: Correlation and Regression Tagged With: Band 4, smc-265-20-Find LSRL Equation/Gradient

CORE, FUR1 2012 VCAA 7 MC

The table below shows the percentage of students in two age groups (15–19 years and 20–24 years) who regularly use the internet at one or more of three locations.

  • at home
  • at an educational institution
  • at work 


For the students surveyed, which one of the following statements, by itself, supports the contention that the location of internet use is associated with the age group of the internet user?

  1. 85% of students aged 15–19 years used the internet at an educational institution.
  2. 95% of students aged 15–19 years used the internet at home, but only 38% of 15–19 year olds used it at work.
  3. 95% of students aged 15–19 years used the internet at home and 18% of 20–24 year olds used the internet at an educational institution.
  4. The percentage of students who used the internet at an educational institution decreased from 85% for those aged 15–19 years to 18% for those aged 20–24 years.
  5. The percentage of students who used the internet at home was 95% for those aged 15–19 years and 95% for those aged 20–24 years. 
Show Answers Only

`D`

Show Worked Solution

`text (The contention requires that the two age groups are)`

`text(compared at the same location.)`

`:.\ text(Eliminates A, B, and C.)`
 

`text (Considering E,)`

`text(the usage at home is THE SAME for both groups)`

`text(and therefore age group doesn’t matter.)`
 

`text (Considering D,)`

`text(the same location is used and the usage differs)`

`text(between groups.)`

`rArr D`

Filed Under: Correlation and Regression Tagged With: Band 4, smc-265-10-r / r^2 and Association

CORE, FUR1 2012 VCAA 5 MC

The temperature of a room is measured at hourly intervals throughout the day.

The most appropriate graph to show how the temperature changes from one hour to the next is a

A.  boxplot.

B.  stem plot.

C.  histogram.

D.  time series plot.

E.  two-way frequency table.

Show Answers Only

`D`

Show Worked Solution

` text (A time series plot is best because the temperature)`

`text(is measured at regular time intervals.)`

`rArr D`

Filed Under: Graphs - Histograms and Other, Graphs - Stem/Leaf and Boxplots Tagged With: Band 4, smc-643-10-Single Box-Plots, smc-643-40-Stem and Leaf, smc-644-20-Histograms

CORE, FUR1 2010 VCAA 5-6 MC

The lengths of the left feet of a large sample of  Year 12 students were measured and recorded. These foot lengths are approximately normally distributed with a mean of 24.2 cm and a standard deviation of 4.2 cm.

Part 1

A Year 12 student has a foot length of 23 cm.
The student’s standardised foot length (standard `z` score) is closest to

A.   –1.2

B.   –0.9

C.   –0.3

D.    0.3

E.     1.2


Part 2

The percentage of students with foot lengths between 20.0 and 24.2 cm is closest to

A.   16%

B.   32%

C.   34%

D.   52%

E.   68%

Show Answers Only

`text(Part 1:)\ C`

`text(Part 2:)\ C`

Show Worked Solution

`text(Part 1)`

`bar(x) = 24.2,`    `s=4.2`
`z text{-score (23)}` `=(x – bar(x))/s`
  `= (23 – 24.2)/4.2`
  `= -0.285…`

`=>  C`


`text(Part 2)`

   `z text{-score (20)}` `=(20- 24.2)/4.2`
  `= -1`
 `z text{-score (24.2)}` `= 0`


`text(68% have a)\ z text(-score between  –1 and 1)`

`:.\ text(34% have a)\ z text(-score between  –1 and 0)`

`=>  C`

Filed Under: Normal Distribution Tagged With: Band 3, Band 4, smc-600-10-Single z-score, smc-600-20-z-score Intervals

CORE, FUR1 2010 VCAA 1-3 MC

To test the temperature control on an oven, the control is set to 180°C and the oven is heated for 15 minutes.
The temperature of the oven is then measured. Three hundred ovens were tested in this way. Their temperatures were recorded and are displayed below using both a histogram and a boxplot.
 

CORE, FUR1 2010 VCAA 1-3 MC

Part 1

A total of 300 ovens were tested and their temperatures were recorded.

The number of these temperatures that lie between 179°C and 181°C is closest to

A.     `40` 

B.     `50` 

C.     `70`

D.   `110`

E.   `150`


Part 2

The interquartile range for temperature is closest to 

A.   `1.3°text(C)`  

B.   `1.5°text(C)`  

C.   `2.0°text(C)`  

D.   `2.7°text(C)`  

E.   `4.0°text(C)`  


Part 3

Using the 68–95–99.7%  rule, the standard deviation for temperature is closest to

A.   `1°text(C)`  

B.   `2°text(C)`  

C.   `3°text(C)`  

D.   `4°text(C)`  

E.   `6°text(C)`  


Show Answers Only

`text(Part 1:)\ D`

`text(Part 2:)\ D`

`text(Part 3:)\ B`

Show Worked Solution

`text(Part 1)`

`text(22% of ovens had temperatures between 179 – 180°)`

`text{and 16% between 180 – 181° (from bar chart).}`
 

`:.\ text(Number of ovens between 179° and 181°)`
              `=\ text{(22% + 16%)} xx 300`
  `= 38text(%) xx 300`
  `= 114`

 
`=>  D`


`text(Part 2)`

`text(IQR)` `=\ text(Q3 – Q1)`
  `= 181.5- 179`
  `= 2.5text(%)`

 
`=>  D`


`text(Part 3)`

♦ Mean mark 43%.

`text(The percentage of ovens between 179 – 181°)`

`=21 + 16 = 38text(%)`
 

`text(Taking another bar column either side, we have)`

`text{178 – 179° (13%) and 181–182° (15%).}`

`:.\ text(178 – 182° accounts for approximately 66% of all values.)`

`:.\ text(1 standard deviation is approximately 2°.)`

`=>  B`

Filed Under: Graphs - Stem/Leaf and Boxplots Tagged With: Band 4, Band 5, smc-643-10-Single Box-Plots

CORE, FUR1 2009 VCAA 9-10 MC

The table below lists the average life span (in years) and average sleeping time (in hours/day) of 12 animal species.


Part 1

Using sleeping time as the independent variable, a least squares regression line is fitted to the data.

The equation of the least squares regression line is closest to

A.   life span = 38.9 – 2.36 × sleeping time.

B.   life span = 11.7 – 0.185 × sleeping time.

C.   life span = – 0.185 – 11.7 × sleeping time.

D.   sleeping time = 11.7 – 0.185 × life span.

E.   sleeping time = 38.9 – 2.36 × life span.


Part 2

The value of Pearson’s product-moment correlation coefficient for life span and sleeping time is closest to

A.  `–0.6603`

B.  `–0.4360`

C.  `–0.1901`

D.   `0.4360`

E.   `0.6603` 

Show Answers Only

`text(Part 1:)\ A`

`text(Part 2:)\ A`

Show Worked Solution

`text(Part 1)`

♦ Mean mark 49%.
MARKERS’ COMMENT: Almost a quarter of students incorrectly assumed the independent variable was in the first column!

`text{By calculator (with “life span” as the}`

`text{dependent variable), the equation is:}`

`text(life span = 38.9 – 2.36 × sleeping time.)`

`=>A`


`text(Part 2)`

`text (By calculator)`

`=>A`

Filed Under: Correlation and Regression Tagged With: Band 4, Band 5, smc-265-10-r / r^2 and Association, smc-265-20-Find LSRL Equation/Gradient

CORE, FUR1 2012 VCAA 4 MC

A class of students sat for a Biology test and a Legal Studies test. Each test had a possible maximum score of 100 marks. The table below shows the mean and standard deviation of the marks obtained in these tests.


The class marks in each subject are approximately normally distributed.

Sashi obtained a mark of 81 in the Biology test.

The mark that Sashi would need to obtain on the Legal Studies test to achieve the same standard score for both Legal Studies and Biology is

A.   81

B.   82

C.   83

D.   87

E.   95

Show Answers Only

`D`

Show Worked Solution
`z text {-score (Biology)}` `= ( x – bar x)/ s`
  `= (81-54)/15`
  `= 1.8`


`text(Legal Studies mark must have a) \ z text(-score of 1.8:)`

`1.8` `= (x-78)/5`
`9`  `= x – 78`
`x` `= 87`

 
`rArr D`

Filed Under: Normal Distribution Tagged With: Band 4, smc-600-30-Comparing Data / Data Sets

CORE, FUR1 2008 VCAA 11-13 MC

The time series plot below shows the number of users each month of an online help service over a twelve-month period.
 

2008 11-13

Part 1

The time series plot has

A.   no trend. 

B.   no variability.  

C.   seasonality only.

D.   an increasing trend with seasonality.

E.   an increasing trend only.


Part 2

The data values used to construct the time series plot are given below.

2008 12

A four-point moving mean with centring is used to smooth timeline series.
The smoothed value of the number of users in month number 5 is closest to


A.   `357`

B.   `359`

C.   `360`

D.   `365`

E.   `373`


Part 3

A least squares regression line is fitted to the time series plot.
The equation of this least squares regression line is

number of users = 346 + 2.77 × month number

Let month number 1 = January 2007, month number 2 = February 2007, and so on.

Using the above information, the regression line predicts that the number of users in December 2009 will be closest to

A.   `379`

B.   `412`

C.   `443`

D.   `446`

E.   `448`

Show Answers Only

`text(Part 1:)\ E`

`text(Part 2:)\ C`

`text(Part 3:)\ D`

Show Worked Solution

`text(Part 1)`

♦ Mean mark 39%.
MARKERS’ COMMENT: 50% of students incorrectly read the three large random fluctuations in monthly sales as seasonality, which can’t be determined over only 12 months.

`text(The time series is clearly trending upwards with)`

`text(higher lows and higher highs occurring.)`

`text(The large fluctuations are random and should)`

`text(not be confused with seasonality.)`

`=>E`


`text(Part 2)`

`text(Mean for months 3-6)`

`=(354+356+373+353)/4`

`=359`

`text(Mean for months 4-7)`

`=(356+373+353+364)/4`

`=361.5`


`:.\ text(Four point moving mean with centring)`

`=(359+361.5)/2`

`=360.25`

`=>  C`


`text(Part 3)`

`text(December 2009 will be month number 36.)`

`:.\ text(Number of users)` `= 346+2.77xx36`
  `= 445.72`

`=>  D`

Filed Under: Time Series Tagged With: Band 4, Band 5, smc-266-40-Time Series Trends, smc-266-60-MEAN Smoothing

CORE, FUR1 2012 VCAA 1-2 MC

The following bar chart shows the distribution of wind directions recorded at a weather station at 9.00 am on each of 214 days in 2011.
 

Part 1

According to the bar chart, the most frequently observed wind direction was

A.  south-east.

B.  south.

C.  south-west.

D.  west.

E.  north-west.

 
Part 2

According to the bar chart, the percentage of the 214 days on which the wind direction was observed to be east or south-east is closest to

A.  `10text(%)`

B.  `16text(%)`

C.  `25text(%)`

D.  `33text(%)`

E.  `35text(%)`

Show Answers Only

`text(Part 1:)\ E`

`text(Part 2:)\ B`

Show Worked Solution

`text(Part 1)`

`text{North-west (highest bar)}`

`=>E`


`text(Part 2)`

`text (# Days with East or South East wind)`

`= 10 + 25`

`= 35`

`:.\ text(% Days)` `= 35/text (Total Days) xx 100` 
  `= 35/214 xx 100`
  `= 16.355…text(%)`

`=> B`

Filed Under: Graphs - Histograms and Other Tagged With: Band 1, Band 4, smc-644-30-Bar Charts

  • « Previous Page
  • 1
  • …
  • 112
  • 113
  • 114
  • 115
  • 116
  • …
  • 121
  • Next Page »

Copyright © 2014–2026 SmarterEd.com.au · Log in