The points shown on the chart below represent monthly online sales in Australia. The variable \(y\) represents sales in millions of dollars. The variable \(t\) represents the month when the sales were made, where \(t=1\) corresponds to January 2021, \(t=2\) corresponds to February 2021 and so on. The graph of \(y=p(f)\) is shown as a dashed curve on the set of axes above. It has a local minimum at (2,2500) and a local maximum at (11,4400). --- 5 WORK AREA LINES (style=lined) --- ii. Let \(q:(12,24] \rightarrow R, q(t)=p(t-h)+k\) be a cubic function obtained by translating \(p\), which can be used to model monthly online sales in 2022. Find the values of \(h\) and \(k\) such that the graph of \(y=q(t)\) has a local maximum at \((23,4750)\). (2 marks) --- 5 WORK AREA LINES (style=lined) --- Part of the graph of \(f\) is shown on the axes below. --- 0 WORK AREA LINES (style=lined) --- Find the value of \(n\). (1 mark) --- 3 WORK AREA LINES (style=lined) --- --- 3 WORK AREA LINES (style=lined) --- --- 4 WORK AREA LINES (style=lined) --- ai. \(a\approx -5.21, b\approx 101.65, c\approx -344.03, d\approx 2823.18\) aii. \(h=12, k=350\) bi. bii. \( n=360\) biii. \(f^{\prime}(t)=30-\dfrac{350\pi}{3}\sin\left(\dfrac{\pi t}{6}\right)-\dfrac{400\pi}{3}\sin\left(\dfrac{\pi t}{3}\right)\) biv. \(\text{Maximum rate occurs at }t=10.2, 22.2, 34.2\) \(\text{Maximum rate}\ \approx 725\ \text{million/month}\) \(a\approx -5.21, b\approx 101.65, c\approx -344.03, d\approx 2823.18\) aii. \(\text{Local maximim }p(t)\ \text{is}\ (11, 4400)\) bi. \(\text{Plotting points from CAS:}\) \((24,4820), (26, 3930), (28, 3290), (30, 3600), (32, 3410), (34, 4170), (36, 5180)\) bii. \(\text{Using CAS: }\) \(\therefore\ n=360\) \(\text{Maximum rate occurs at }t=10.2, 22.2, 34.2\) \(\text{Maximum rate using CAS:}\) \(f^{\prime}(10.2)=f^{\prime}(22.2)=f^{\prime}(34.2)=725.396\approx 725\ \text{million/month}\)
i. Find, correct to two decimal places, the values of \(a, b, c\) and \(d\). (3 mark)
\(f:(0,36] \rightarrow R, f(t)=3000+30 t+700 \cos \left(\dfrac{\pi t}{6}\right)+400 \cos \left(\dfrac{\pi t}{3}\right)\)


\(\text{Using CAS:}\)
\begin{cases}
8a+4b+2c+d=2500 \\
1331a+121b+11c+d=4400 \\
12a+4b+c=0 \\
363a+22b+c=0
\end{cases}\)
\(\therefore\ h\)
\(=23-11=12\)
\(k\)
\(=4750-4400=350\)
\(f(12)-f(0)\)
\(=4460-4100=360\)
\(f(24)-f(12)\)
\(=4820-4460=360\)
\(f(36)-f(24)\)
\(=5180-4820=360\)
biii.
\(f(t)\)
\(=3000+30t+700\cos\left(\dfrac{\pi t}{6}\right)+400\cos\left(\dfrac{\pi t}{3}\right)\)
\(f^{\prime}(t)\)
\(=30-\dfrac{700\pi}{6}\sin\left(\dfrac{\pi t}{6}\right)-\dfrac{400\pi}{3}\sin\left(\dfrac{\pi t}{3}\right)\)
\(=30-\dfrac{350\pi}{3}\sin\left(\dfrac{\pi t}{6}\right)-\dfrac{400\pi}{3}\sin\left(\dfrac{\pi t}{3}\right)\)
biv. \(\text{Max instantaneous rate of change occurs when }f^{\prime\prime}(t)=0\)
Functions, MET2 2023 VCAA 2
The following diagram represents an observation wheel, with its centre at point \(P\). Passengers are seated in pods, which are carried around as the wheel turns. The wheel moves anticlockwise with constant speed and completes one full rotation every 30 minutes.When a pod is at the lowest point of the wheel (point \(A\)), it is 15 metres above the ground. The wheel has a radius of 60 metres.

Consider the function \(h(t)=-60\ \cos(bt)+c\) for some \(b, c \in R\), which models the height above the ground of a pod originally situated at point \(A\), after time \(t\) minutes.
- Show that \(b=\dfrac{\pi}{15}\) and \(c=75\). (2 marks)
--- 5 WORK AREA LINES (style=lined) ---
- Find the average height of a pod on the wheel as it travels from point \(A\) to point \(B\).
- Give your answer in metres, correct to two decimal places. (2 marks)
--- 3 WORK AREA LINES (style=lined) ---
- Find the average rate of change, in metres per minute, of the height of a pod on the wheel as it travels from point \(A\) to point \(B\). (1 mark)
--- 3 WORK AREA LINES (style=lined) ---
After 15 minutes, the wheel stops moving and remains stationary for 5 minutes. After this, it continues moving at double its previous speed for another 7.5 minutes.
The height above the ground of a pod that was initially at point \(A\), after \(t\) minutes, can be modelled by the piecewise function \(w\):
\(w(t) = \begin {cases}
h(t) &\ \ 0 \leq t < 15 \\
k &\ \ 15 \leq t < 20 \\
h(mt+n) &\ \ 20\leq t\leq 27.5
\end{cases}\)
where \(k\geq 0, m\geq 0\) and \(n \in R\).
- i.State the values of \(k\) and \(m\). (1 mark)
--- 2 WORK AREA LINES (style=lined) ---
ii. Find all possible values of \(n\). (2 marks)--- 4 WORK AREA LINES (style=lined) ---
iii. Sketch the graph of the piecewise function \(w\) on the axes below, showing the coordinates of the endpoints. (3 marks)
--- 0 WORK AREA LINES (style=lined) ---

Show Answers Only
a. \(\text{See worked solution}\)
b. \(\approx 36.80\ \text{m}\)
c. \(8\)
d.i. \(k=135, m=2\)
d.ii. \(n=30p+5,\ p\in Z\)
d.iii.

Show Worked Solution
| a. | \(\text{Period:}\) | \(\dfrac{2\pi}{b}\) | \(=30\) |
| \(\therefore\ b\) | \(=\dfrac{\pi}{15}\) |
\(\text{Given }h(t)=-60\cos(bt)+c,\ \text{evaluate when }t=0, h=15\ \text{to find }c.\)
| \(-60\ \cos(0)+c\) | \(=15\) |
| \(c\) | \(=75\) |
\(\therefore\ h(t)=-60\cos(\dfrac{\pi t}{15})+75\)
| b. | \(\text{Average height}\) | \(=\dfrac{1}{\frac{30}{4}-0}\displaystyle\int_0^{\frac{30}{4}}\Bigg(-60\cos\Bigg(\dfrac{\pi}{15}t\Bigg)+75\Bigg)\,dt\) |
| \(=\dfrac{2}{15}\left[75t-\dfrac{900\ \sin(\frac{\pi}{15}t)}{\pi}\right]_{0}^{7.5}\) | ||
| \(=\dfrac{2}{15}\Bigg[75\times 7.5-\dfrac{900\ \sin(\frac{\pi}{15}\times 7.5)}{\pi}\Bigg]-\Bigg[0\Bigg]\) | ||
| \(=\dfrac{75\pi-120}{\pi}=\dfrac{15(5\pi-8)}{\pi}\) | ||
| \(=36.802\dots\approx 36.80\ \text{m}\) |
♦♦ Mean mark (b) 45%.
MARKER’S COMMENT: \(\frac{1}{60}\int_0^{60} h(t)dt\) was a common error.
Others incorrectly found average rate of change instead of average value.
MARKER’S COMMENT: \(\frac{1}{60}\int_0^{60} h(t)dt\) was a common error.
Others incorrectly found average rate of change instead of average value.
c. \(\text{Av rate of change of height}\)
| \(=\dfrac{h(7.5)-h(0)}{7.5}\) | |
| \(=\dfrac{\Bigg(75-60\cos(\dfrac{\pi \times 7.5}{15})\Bigg)-\Bigg(75-60\cos(\dfrac{\pi\times 0}{15})\Bigg)}{7.5}\) | |
| \(=\dfrac{75-15}{7.5}=8\) |
♦ Mean mark (c) 50%.
MARKER’S COMMENT: Common incorrect answer was – 8.
MARKER’S COMMENT: Common incorrect answer was – 8.
| di. | \(\text{Period is 30 minutes, so after 15 minutes pod}\) \(\text{is at the top of the wheel.}\) |
| \(\therefore\ k=75-60\ \cos(\frac{\pi}{15}\times 15)=135\) |
\(\text{Pod is travelling at twice its previous speed}\)
\(\text{so one revolution takes 15 minutes}\)
| \(\therefore\ \text{Period}\rightarrow\) | \(\dfrac{2\pi}{bm}\) | \(=15\) |
| \(bm\) | \(=\dfrac{2\pi}{15}\) | |
| \(\dfrac{\pi}{15}\cdot m\) | \(=\dfrac{2\pi}{15}\) | |
| \(m\) | \(=\dfrac{2\pi}{15}\times \dfrac{15}{\pi}\) | |
| \(=2\) |
♦♦ Mean mark (d)(i) 40%.
MARKER’S COMMENT: Many students could find \(k\) but not \(m\) with \(m=\frac{1}{2}\) a common error.
MARKER’S COMMENT: Many students could find \(k\) but not \(m\) with \(m=\frac{1}{2}\) a common error.
| dii. | \(\text{When }t=20\ \text{the pod is at the top of the wheel and height is 135.}\) \(\text{When }t=27.5\ \text{the pod is back at the start and height is 15.}\) |
\(\text{Using CAS solve for }t=20:\rightarrow\ h(2(20)+n)=135\ \rightarrow\ n=30p+5\)
\(\text{Using CAS solve for }t=27.5:\rightarrow\ h(2(27.5)+n)=15\ \rightarrow\ n=30p+5\)
\(\therefore\ n=30p+5,\ p\in Z\)
♦♦♦ Mean mark (d)(ii) 20%.
MARKER’S COMMENT: Many students set up the correct equations to solve but did not provide the general solution. Some incorrectly stated the variable as an element of R.
MARKER’S COMMENT: Many students set up the correct equations to solve but did not provide the general solution. Some incorrectly stated the variable as an element of R.
diii.
♦♦♦ Mean mark (d)(iii) 40%.
MARKER’S COMMENT: Students are reminded to include all endpoints and be particular about the curvature of graph.
MARKER’S COMMENT: Students are reminded to include all endpoints and be particular about the curvature of graph.
Graphs, MET1 2022 VCAA 6
The graph of `y=f(x)`, where `f:[0,2 \pi] \rightarrow R, f(x)=2 \sin(2x)-1`, is shown below.

- On the axes above, draw the graph of `y=g(x)`, where `g(x)` is the reflection of `f(x)` in the horizontal axis. (2 marks)
--- 0 WORK AREA LINES (style=lined) ---
- Find all values of `k` such that `f(k)=0` and `k \in[0,2 \pi]`. (3 marks)
--- 5 WORK AREA LINES (style=lined) ---
- Let `h: D \rightarrow R, h(x)=2 \sin(2x)-1`, where `h(x)` has the same rule as `f(x)` with a different domain.
- The graph of `y=h(x)` is translated `a` units in the positive horizontal direction and `b` units in the positive vertical direction so that it is mapped onto the graph of `y=g(x)`, where `a, b \in(0, \infty)`.
-
- Find the value for `b`. (1 mark)
--- 2 WORK AREA LINES (style=lined) ---
- Find the smallest positive value for `a`. (1 mark)
--- 2 WORK AREA LINES (style=lined) ---
- Hence, or otherwise, state the domain, `D`, of `h(x)`. (1 mark)
--- 2 WORK AREA LINES (style=lined) ---
- Find the value for `b`. (1 mark)
Show Answers Only
a. Graph `y=g(x)`

b. `\frac{\pi}{12}, \frac{5 \pi}{12}, \frac{13 \pi}{12}, \frac{17 \pi}{12}`
c.i. `b=2`
cii. `=\frac{\pi}{2}`
ciii. `\left[-\frac{\pi}{2}, \frac{3 \pi}{2}\right]`
Show Worked Solution
a.
| b. `2 \sin (2 k)-1` | `=0` `0<=k<=2\pi` | |
| `sin (2 k)` | `=1/2` | |
| `2k` | `=\frac{\pi}{6}, \frac{5 \pi}{6}, \frac{13 \pi}{6}, \frac{17 \pi}{6}` | |
| `k` | `=\frac{\pi}{12}, \frac{5 \pi}{12}, \frac{13 \pi}{12}, \frac{17 \pi}{12}` |
| c.i ` 2 \sin 2(x-a)-1+b` | `=-(2 \sin 2 x-1)` | |
| `:.\ -1+b` | `=1` | |
| `b` | `=2` |
| c.ii `2 \sin 2(x-a)` | `=-(2 \sin 2 x-1)` | |
| `\sin (2 x-2 a)` | `=-\sin 2 x` | |
| `\therefore 2 a` | `=\pi` | |
| `a` | `=\frac{\pi}{2}` |
♦ Mean mark (c.ii) 50%.
MARKER’S COMMENT: Students confused vertical and horizontal translations. Common error `a=\frac{\pi}{4}.`
MARKER’S COMMENT: Students confused vertical and horizontal translations. Common error `a=\frac{\pi}{4}.`
c.iii The domain for `f(x)` is `[0,2pi]`
`:. \ D` is `\left[-\frac{\pi}{2}, \frac{3 \pi}{2}\right]`
♦♦♦ Mean mark (c.iii) 10%.
MARKER’S COMMENT: Common error was translating in the wrong direction. A common incorrect answer was `\left[-\frac{\pi}{2}, \frac{5 \pi}{2}\right].`
MARKER’S COMMENT: Common error was translating in the wrong direction. A common incorrect answer was `\left[-\frac{\pi}{2}, \frac{5 \pi}{2}\right].`
Calculus, MET1-NHT 2018 VCAA 7
Let `f : [ 0, (pi)/(2)] → R, \ f(x) = 4 cos(x)` and `g : [0, (pi)/(2)] → R, \ g(x) = 3 sin(x)`.
- Sketch the graph of `f` and the graph of `g` on the axes provided below. (2 marks)
--- 0 WORK AREA LINES (style=lined) ---
`qquad qquad `
- Let `c` be such that `f(c) = g(c)`, where `c∈[0, (pi)/(2)]`
Find the value of `sin(c)` and the value of `cos(c)`. (3 marks)--- 4 WORK AREA LINES (style=lined) ---
- Let `A` be the region enclosed by the horizontal axis, the graph of `f` and the graph of `g`.
-
- Shade the region `A` on the axes provided in part a. and also label the position of `c` on the horizontal axis. (1 mark)
--- 0 WORK AREA LINES (style=lined) ---
- Calculate the area of the region `A`. (3 marks)
--- 7 WORK AREA LINES (style=lined) ---
- Shade the region `A` on the axes provided in part a. and also label the position of `c` on the horizontal axis. (1 mark)
Show Worked Solution
a.

b. `text(At intersection:)`
| `4cos(c)` | `= 3sin(c)` |
| `tan(c)` | `= (4)/(3)` |

`sin(c) = (4)/(5)`
`cos(c) = (3)/(5)`
c. i.

| ii. `A` | `= int_0^c g(x)\ dx + int_c^((pi)/(2)) f(x)\ dx` |
| `= int_0^c 3sin x \ dx + int_c^((pi)/(2)) 4cos \ x \ dx` | |
| `= 3[-cos x]_0^c + 4[sin x]_c^((pi)/(2))` | |
| `= 3(-cos(c) + cos \ 0) + 4(sin \ (pi)/(2)-sin(c))` | |
| `= 3(-(3)/(5) + 1) + 4(1-(4)/(5))` | |
| `= (6)/(5) + (4)/(5)` | |
| `= 2 \ \ text(u²)` |
Graphs, MET1 2019 VCAA 4
- Solve `1-cos (x/2) = cos (x/2)` for `x in [-2 pi, pi]`. (2 marks)
--- 5 WORK AREA LINES (style=lined) ---
- The function `f: [-2pi, pi] -> R,\ \ f(x) = cos (x/2)` is shown on the axes below.

Let `g: [-2pi, pi] -> R,\ \ g(x) = 1-f(x)`.
Sketch the graph of `g` on the axes above. Label all points of intersection of the graphs of `f` and `g`, and the endpoints of `g`, with their coordinates. (2 marks)
--- 2 WORK AREA LINES (style=lined) ---
Show Worked Solution
| a. | `2 cos (x/2)` | `= 1` |
| `cos (x/2)` | `= 1/2` |
`=>\ text(Base angle)\ \ pi/3`
`x/2 = pi/3, -pi/3, (-5 pi)/3`
`x = (2 pi)/3, (-2 pi)/3 qquad (x in [-2pi, pi])`
b. `text(Plot points for)\ \ g(x):`
`text(- reflect)\ f(x)\ text(in)\ x text(-axis, then)`
`text(- translate 1 upwards.)`

Graphs, MET1 2018 VCAA 3
Let `f:[0,2pi] -> R, \ f(x) = 2cos(x) + 1`.
- Solve the equation `2cos(x) + 1 = 0` for `0 <= x <= 2pi`. (2 marks)
--- 5 WORK AREA LINES (style=lined) ---
- Sketch the graph of the function `f` on the axes below. Label the endpoints and local minimum point with their coordinates. (3 marks)
--- 0 WORK AREA LINES (style=lined) ---
Show Answers Only
- `(2pi)/3, (4pi)/3`
-

Show Worked Solution
| a. | `2cos(x) + 1` | `= 0` |
| `cos(x)` | `=-1/2` |
`=> cos\ pi/3 = 1/2\ text(and cos is negative)`
`text(in 2nd/3rd quadrant)`
| `:.x` | `= pi-pi/3, pi + pi/3` |
| `= (2pi)/3, (4pi)/3` |
| b. | |
Calculus, MET1 SM-Bank 28
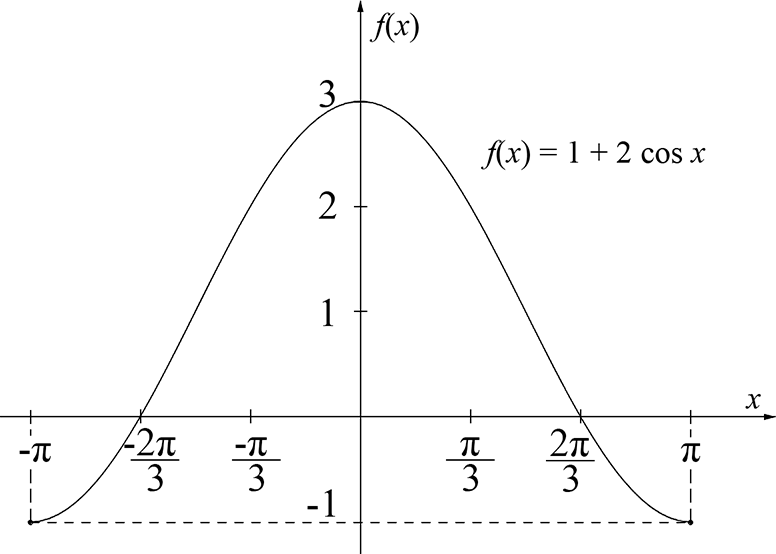
The function `f` has the rule `f(x) = 1 + 2 cos x`.
- Show that the graph of `y = f(x)` cuts the `x`-axis at `x = (2 pi)/3`. (1 mark)
--- 6 WORK AREA LINES (style=lined) ---
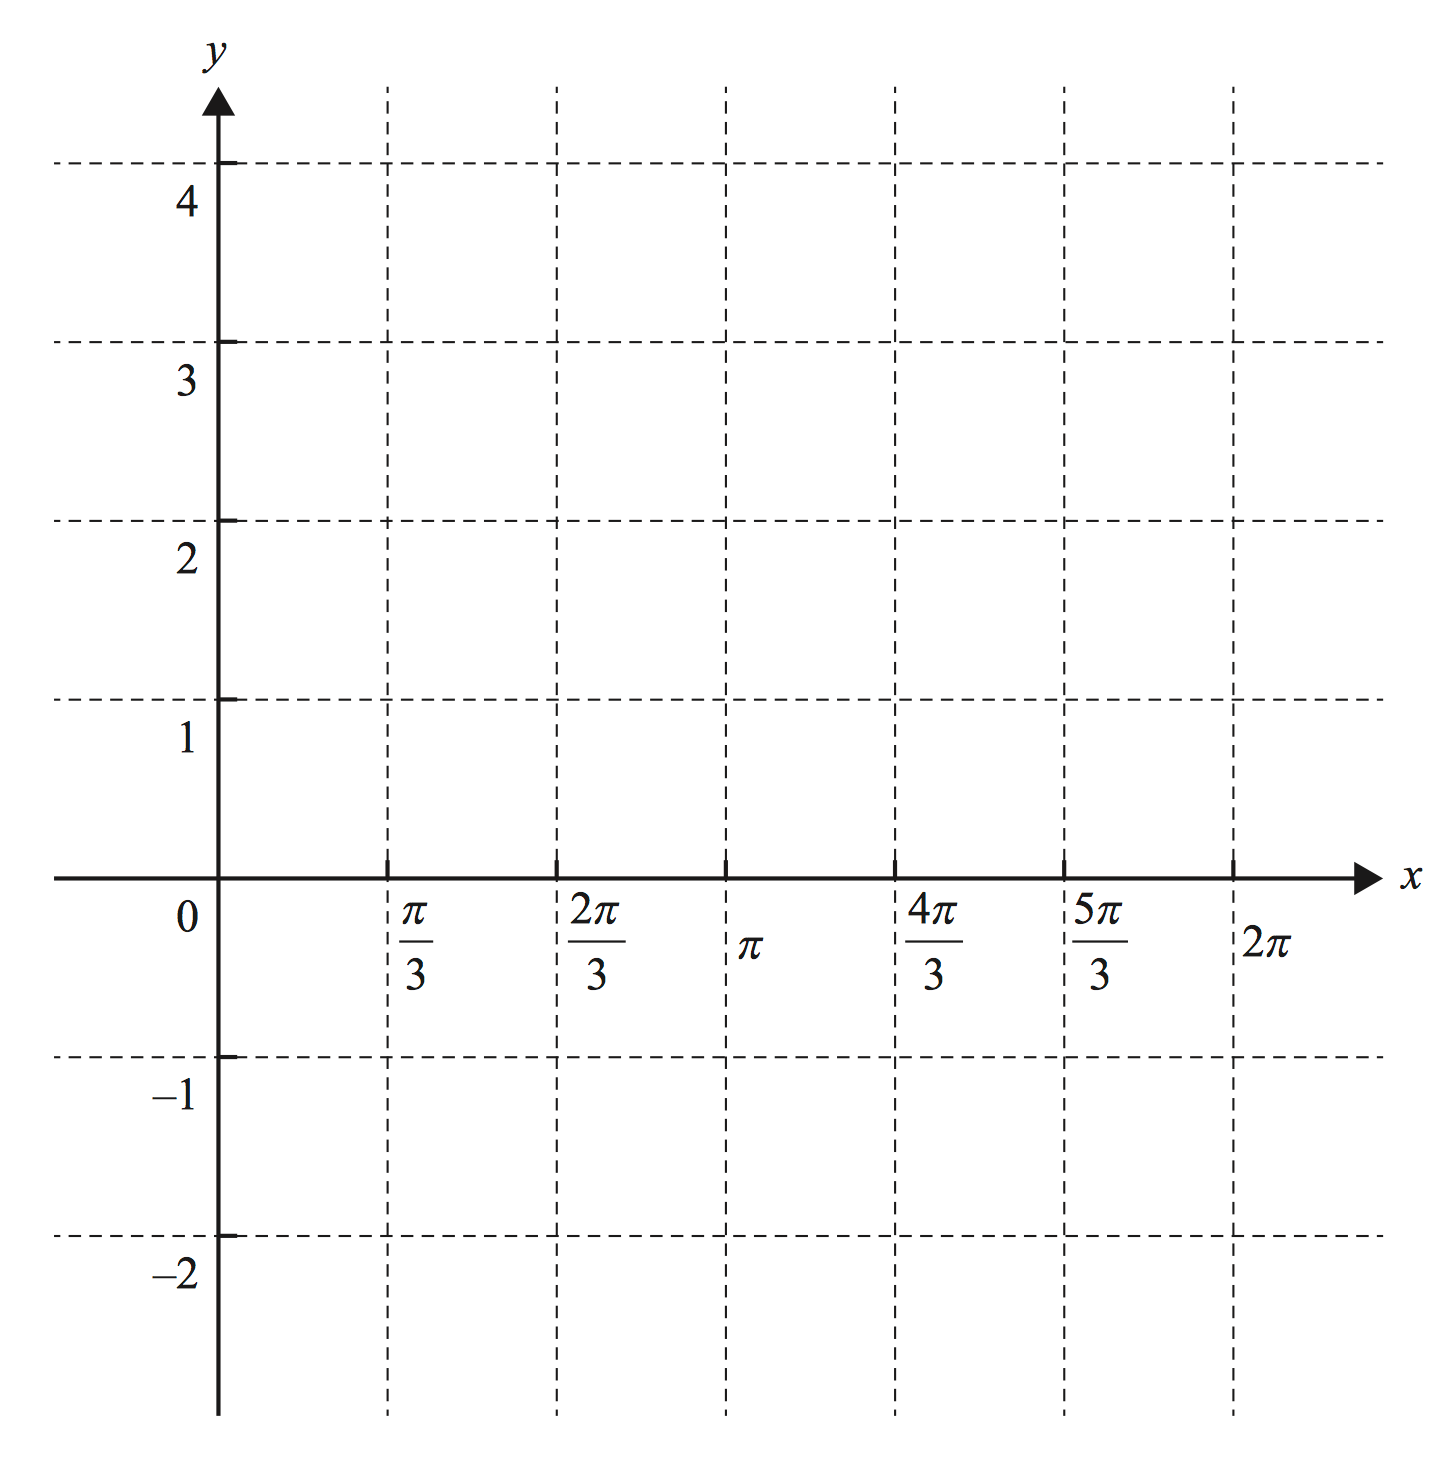
- Sketch the graph `y = f(x)` for `x in [-pi,pi]` showing where the graph cuts each of the axes. (2 marks)
--- 0 WORK AREA LINES (style=lined) ---
- Find the area under the curve `y = f(x)` between `x = -pi/2` and `x = (2 pi)/3`. (3 marks)
--- 6 WORK AREA LINES (style=lined) ---
Show Answers Only
- `text(Proof)\ \ text{(See Worked Solutions)}`
-
- `((7 pi)/6 + sqrt 3 + 1)\ text(u²)`
Show Worked Solution
a. `f(x) = 1 + 2 cos x`
`f(x)\ text(cuts the)\ x text(-axis when)\ f(x) = 0`
| `1 + 2 cos x` | `= 0` |
| `2 cos x` | `=-1` |
| `cos x` | `= -1/2` |
`:. x = (2 pi)/3\ …\ text(as required)`
| b. |  |
| c. `text(Area)` | `= int_(-pi/2)^((2 pi)/3) 1 + 2 cos x\ \ dx` |
| `= [x + 2 sin x]_(-pi/2)^((2 pi)/3)` | |
| `= [((2 pi)/3 + 2 sin (2 pi)/3)-((-pi)/2 + 2 sin (-pi)/2)]` | |
| `= ((2 pi)/3 + 2 xx sqrt 3/2)-((-pi)/2 +2(- 1))` | |
| `= (2 pi)/3 + sqrt(3) + pi/2 + 2` | |
| `= ((7 pi)/6 + sqrt(3) + 2)\ text(u²)` |
Graphs, MET1 SM-Bank 27
The graph shown is `y = A sin bx`.

- Write down the value of `A`. (1 mark)
--- 1 WORK AREA LINES (style=lined) ---
- Find the value of `b`. (1 mark)
--- 6 WORK AREA LINES (style=lined) ---
- Copy or trace the graph into your writing booklet.
On the same set of axes, draw the graph `y = 3 sin x + 1` for `0 <= x <= pi`. (2 marks)
--- 10 WORK AREA LINES (style=blank) ---
Show Worked Solution
a. `A = 4`
b. `text(S)text(ince the graph passes through)\ \ (pi/4, 4)`
`text(Substituting into)\ \ y = 4 sin bx`
| `4 sin (b xx pi/4)` | `=4` |
| `sin (b xx pi/4)` | `= 1` |
| `b xx pi/4` | `= pi/2` |
| `:. b` | `= 2` |
MARKER’S COMMENT: Graphs are consistently drawn too small by many students. Aim to make your diagrams 1/3 to 1/2 of a page.
| c. |  |
Functions, MET1 2006 VCAA 4
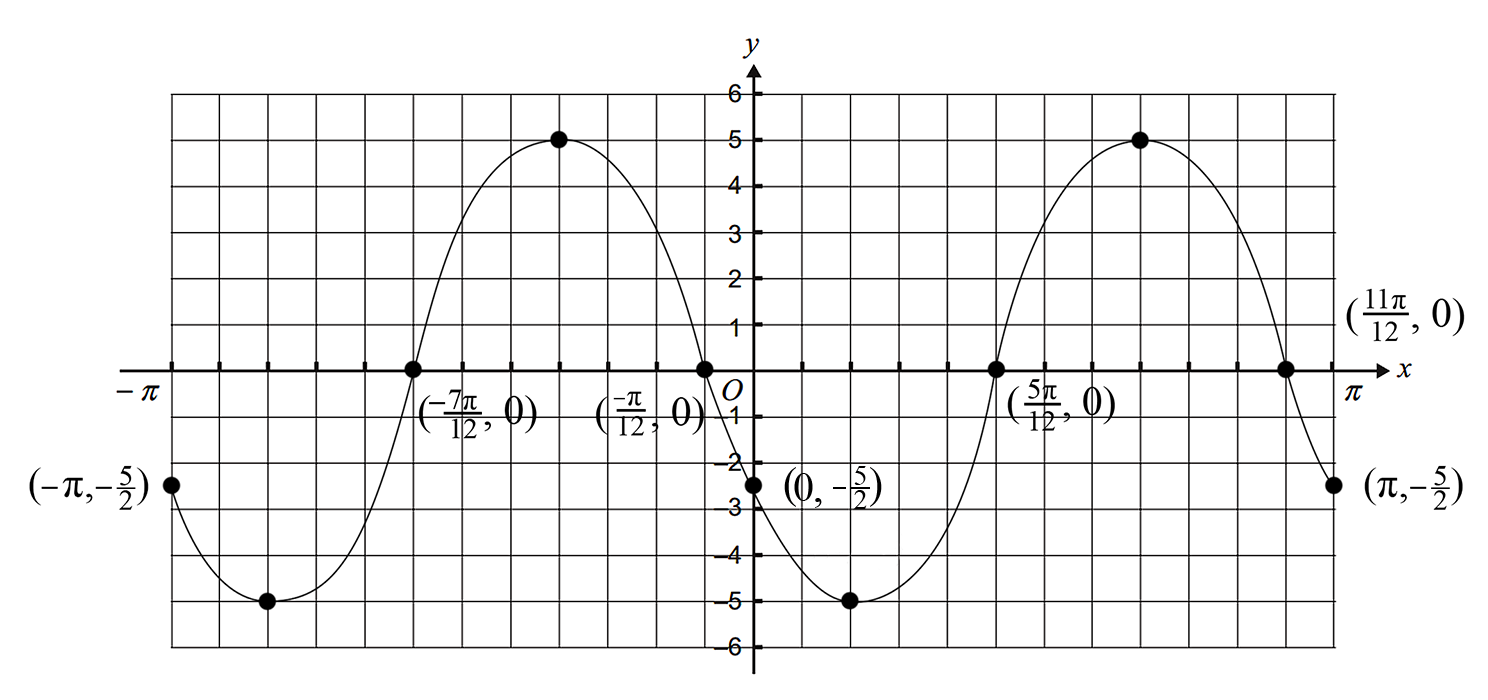
For the function `f: [-pi, pi] -> R, f(x) = 5 cos (2 (x + pi/3))`
- write down the amplitude and period of the function. (2 marks)
--- 2 WORK AREA LINES (style=lined) ---
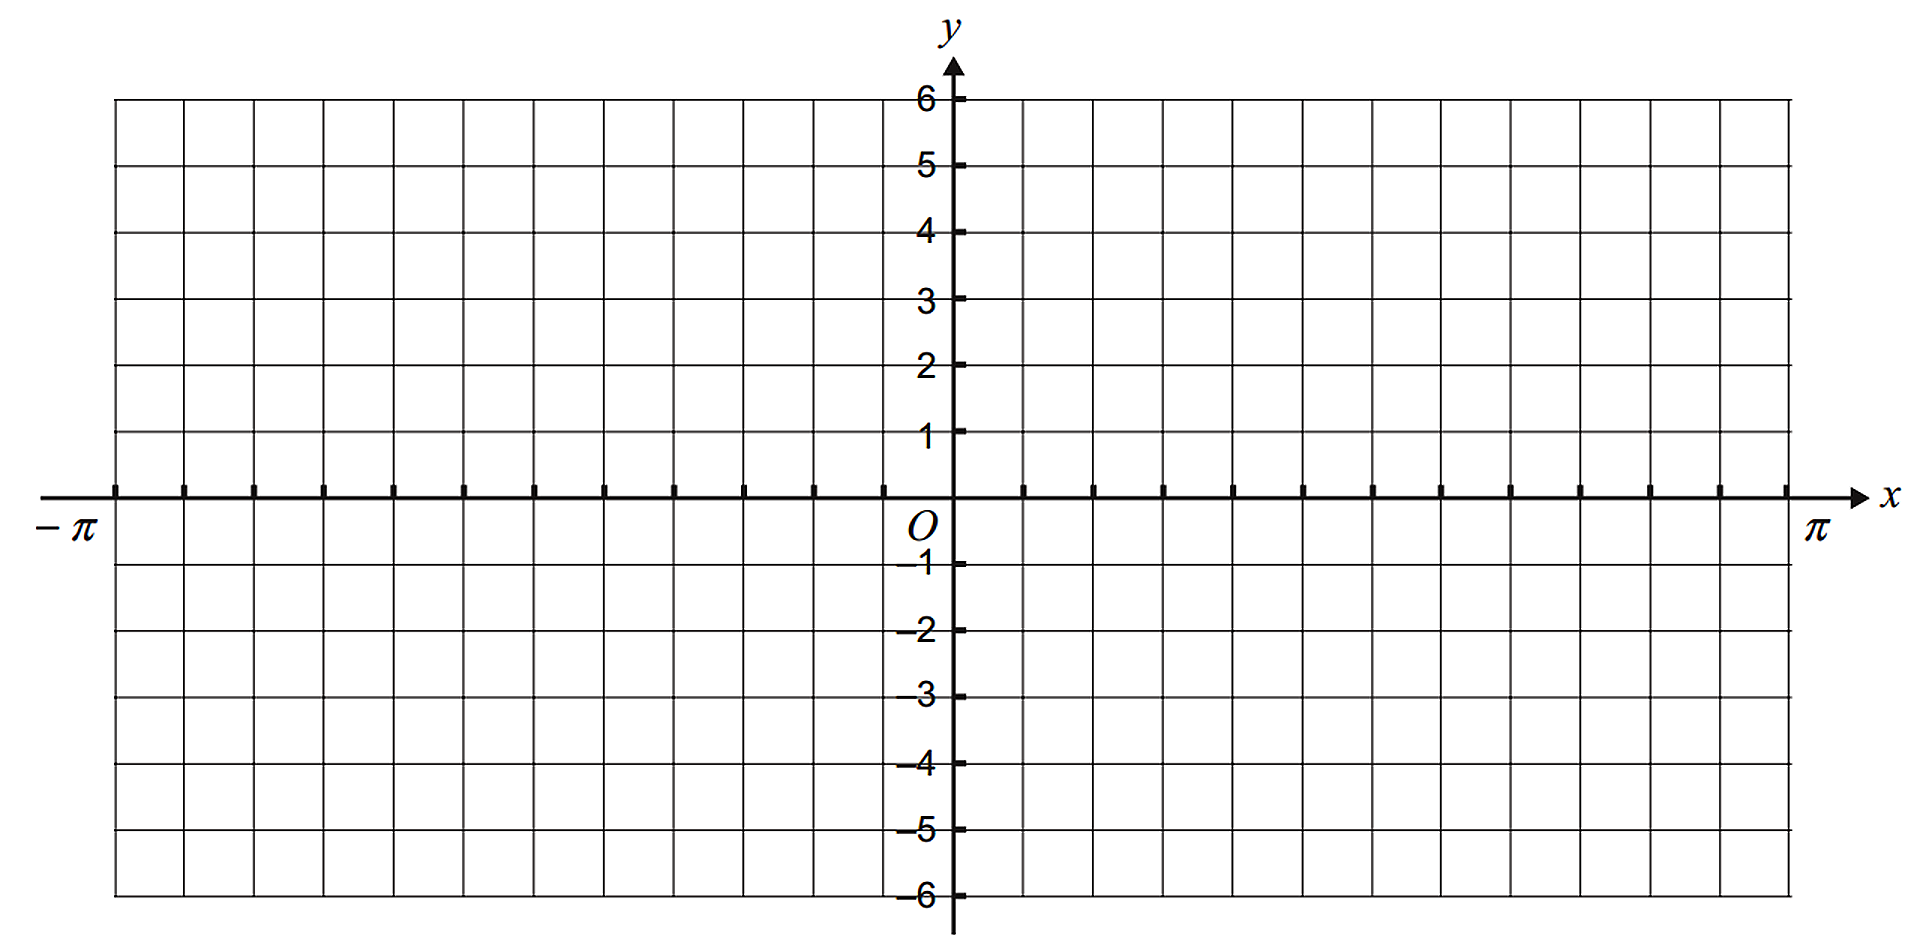
- sketch the graph of the function `f` on the set of axes below. Label axes intercepts with their coordinates.
Label endpoints of the graph with their coordinates. (3 marks)
--- 3 WORK AREA LINES (style=lined) ---
Show Answers Only
- `text(Amplitude) = 5;\ \ \ text(Period) = pi`
-
Show Worked Solution
a. `text(Amplitude) = 5`
`text(Period) = (2 pi)/2 = pi`
| b. |  |
`text(Shift)\ \ y = 5 cos (2x)\ \ text(left)\ \ pi/3\ \ text(units).`
`text(Period) = pi`
`text(Endpoints are)\ \ (-pi, -5/2) and (pi,-5/2)`