An epidemiological study was conducted to help model how many people will be affected by Type 2 diabetes globally in the future. Continuous data were collected from 1990 to 2020. From that data, the following data points were chosen to demonstrate the trend. \begin{array} {|c|c|} A prediction of the global population numbers suggests there will be about 9 billion \((9\ 000\ 000\ 000)\) people on the planet by 2040. Predict the number of people that will be affected by diabetes in 2040. Show working on your graph on the previous page and your calculations. (3 marks) --- 3 WORK AREA LINES (style=lined) ---
\hline
\rule{0pt}{2.5ex} \textit{Year} \rule[-1ex]{0pt}{0pt} & \textit{Percentage of population affected} \\
\rule{0pt}{2.5ex} \textit{} \rule[-1ex]{0pt}{0pt} & \textit{by Type 2 diabetes (%)} \\
\hline
\rule{0pt}{2.5ex} \text{1990} \rule[-1ex]{0pt}{0pt} & \text{3.1} \\
\hline
\rule{0pt}{2.5ex} \text{2000} \rule[-1ex]{0pt}{0pt} & \text{3.7} \\
\hline
\rule{0pt}{2.5ex} \text{2010} \rule[-1ex]{0pt}{0pt} & \text{4.3} \\
\hline
\rule{0pt}{2.5ex} \text{2010} \rule[-1ex]{0pt}{0pt} & \text{5.6} \\
\hline
\end{array}
BIOLOGY, M8 2024 HSC 17 MC
Over 12 months, the prevalence of a non-infectious disease will increase in a population if
- the total population increases.
- disease recovery time decreases.
- the incidence rate of the disease decreases.
- the survival time of individuals with the disease increases.
BIOLOGY, M8 2024 HSC 11 MC
The data shows the proportion of adults living in Australia who are obese.
Which of the following can be observed from the data?
- The proportion of obese adults always increases with age.
- There is a greater percentage of men who are obese than women in all age groups.
- The proportion of women who are obese increases from 13% at 18–24 to 38% at 65–74.
- The proportion of men who are obese increases from 18% at 18–24 to 35% at 45–54, then decreases to 23% at age 85 and over.
BIOLOGY, M8 2023 HSC 16 MC
Mesothelioma is a non-infectious environmental disease caused by exposure to asbestos. The table shows the number of new cases, existing cases and deaths caused by Mesothelioma in Australia in 2020.
New Cases | Existing cases - five year survival |
Deaths | |
Males | 499 | 801 | 590 |
Females | 143 | 239 | 206 |
Total | 642 | 1040 | 796 |
In 2020 the Australian population was 26 million.
What is the incidence rate for Mesothelioma in 2020 as a percentage?
- 0.000025%
- 0.000040%
- 0.0025%
- 0.0040%
BIOLOGY, M8 2019 HSC 33c
A large epidemiological study was conducted. It used historical data to investigate the association between Herpes simplex virus (HSV) infection and dementia. Dementia is caused by a variety of brain illnesses. Alzheimer's disease is the most common cause of dementia.
The study used the records of 8362 patients with HSV infection and 25086 randomly selected sex- and age-matched control patients without HSV infection. Some of the patients with HSV had been treated with antiviral medication.
The graph below shows some results of the study.
- Describe the trends shown in the data. (3 marks)
BIOLOGY, M8 2019 HSC 33b
Alzheimer's disease causes destruction of brain tissue, dementia and eventually death.
The gene with the greatest known effect on the risk of developing late-onset Alzheimer's disease is called APOE. It is found on chromosome 19.
The APOE gene has multiple alleles, including e2, e3 and e4 .
- What are multiple alleles? (2 marks)
--- 4 WORK AREA LINES (style=lined) ---
- The table shows the risk of developing Alzheimer's disease for various APOE genotypes compared to average risk in the population.
- Analyse the data to assess the risk of developing Alzheimer's disease associated with the e2, e3 and e4 alleles. (4 marks)
--- 10 WORK AREA LINES (style=lined) ---
BIOLOGY, M8 2018 HSC 30
The graph shows the expected life span (the age to which people are expected to live in years) for people of different ages during the 20th century in one country.
There have been many biological developments that have contributed to our understanding of the identification, treatment and prevention of disease.
Evaluate the impact of these developments on the expected life span. In your answer, include reference to trends in the data provided. (8 marks)
--- 18 WORK AREA LINES (style=lined) ---
BIOLOGY, M7 2019 HSC 33d
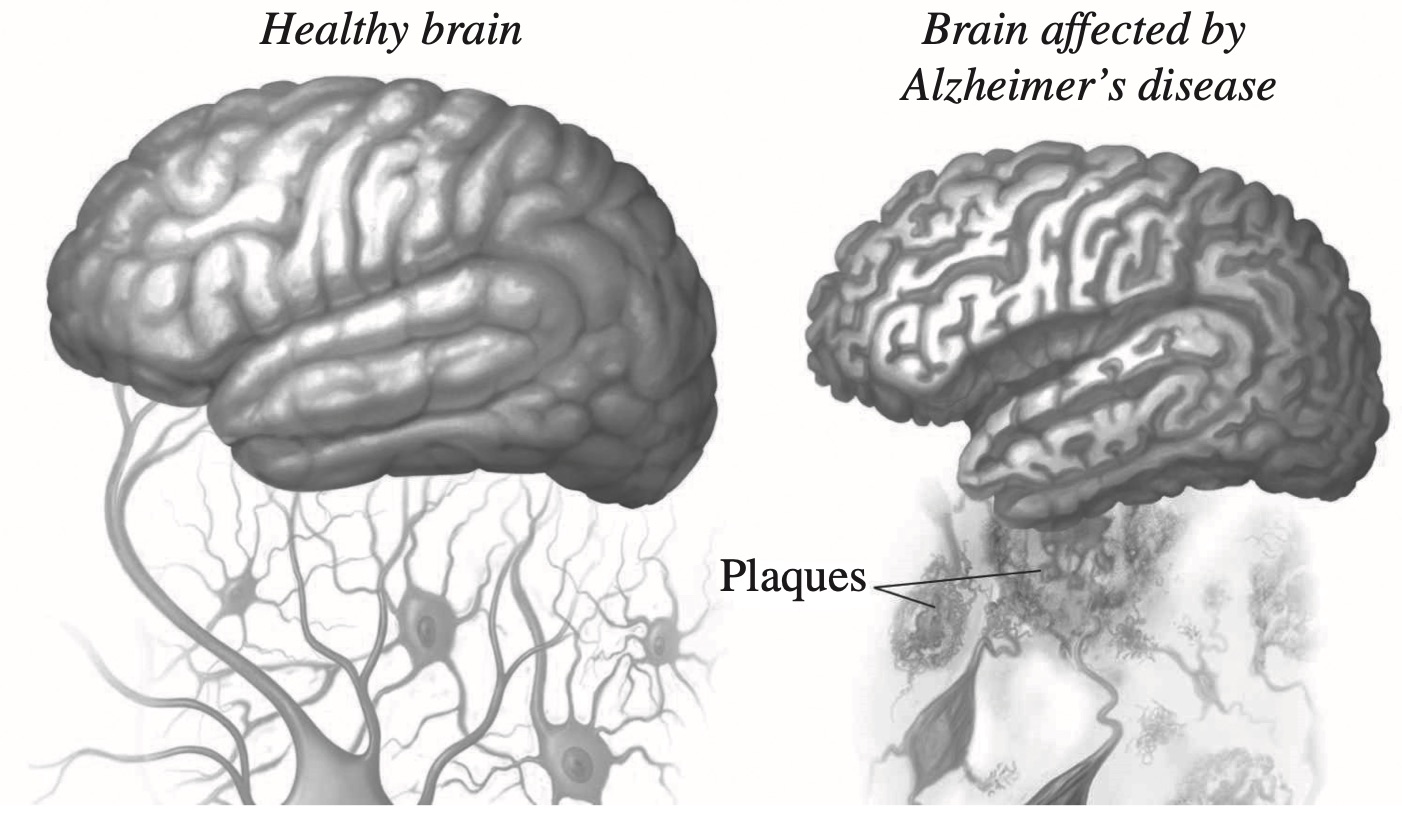
Alzheimer's disease causes destruction of brain tissue, dementia and eventually death.
The diagram shows the effect of Alzheimer's disease on the brain.
Amyloid beta protein is produced in the human brain throughout life. In people with Alzheimer's disease, it accumulates in excessive amounts.
The gene with the greatest known effect on the risk of developing late-onset Alzheimer's disease is called APOE. It is found on chromosome 19.
The APOE gene has multiple alleles, including e2, e3 and e4 .
The table shows the risk of developing Alzheimer's disease for various APOE genotypes compared to average risk in the population.
A large epidemiological study was conducted. It used historical data to investigate the association between Herpes simplex virus (HSV) infection and dementia. Dementia is caused by a variety of brain illnesses. Alzheimer's disease is the most common cause of dementia.
The study used the records of 8362 patients with HSV infection and 25086 randomly selected sex- and age-matched control patients without HSV infection. Some of the patients with HSV had been treated with antiviral medication.
The graph below shows some results of the study.
Diseases are classified as infectious or non-infectious.
Evaluate whether Alzheimer's disease should be classified as an infectious disease or a non-infectious disease. In your answer, include reference to the information and data provided above. (8 marks)
--- 18 WORK AREA LINES (style=lined) ---
BIOLOGY, M8 2022 HSC 31a
Studies have shown that lung cancer can be linked to environmental causes.
In one historical study across 29 health districts in Japan, non-smoking married women aged 40 and above were followed up for 14 years (1966-79) and annual mortality rates for lung cancer were assessed according to the smoking habits of their husbands. They were compared to women who smoked.
The results are shown.
- Evaluate the method used in this epidemiological study. (4 marks)
--- 8 WORK AREA LINES (style=lined) ---
- Justify conclusions that could be drawn from the results of the study. (3 marks)
--- 6 WORK AREA LINES (style=lined) ---
BIOLOGY, M8 2022 HSC 5 MC
Data for incidence of notifiable infectious diseases in Australia are shown in the table.
\begin{array}{|l|c|}
\hline
\rule{0pt}{2.5ex}\textit{Disease} & \textit{Percent of all cases of infectious} \\
\textit{} & \textit{disease notified for 2019} \\
\hline
\rule{0pt}{2.5ex}\text{Influenza}\rule[-1ex]{0pt}{0pt}&\text{53}\\
\hline
\rule{0pt}{2.5ex}\text{Sexually transmitted infections}\rule[-1ex]{0pt}{0pt}& \text{25}\\
\hline
\rule{0pt}{2.5ex}\text{Gastrointestinal diseases}\rule[-1ex]{0pt}{0pt}& \text{10} \\
\hline
\rule{0pt}{2.5ex}\text{Vaccine preventable diseases}\rule[-1ex]{0pt}{0pt}& \text{9} \\
\text{excluding influenza}\rule[-1ex]{0pt}{0pt}& \text{} \\
\hline
\rule{0pt}{2.5ex}\text{Other}\rule[-1ex]{0pt}{0pt}& \text{3} \\
\hline
\end{array}
Which type of graph should be chosen to best represent these data?
- A column graph because percentages are continuous.
- A column graph because diseases are categorical.
- A line graph because percentages are continuous.
- A line graph because diseases are categorical.
BIOLOGY, M8 2020 HSC 27
Exposure to arsenic in drinking water has been associated with the onset of many diseases. The World Health Organisation recommends arsenic levels in drinking water should be below 10 `mu`g L-1 .
An epidemiological study involving 58 406 young adults was conducted over an 11-year period in one country to investigate young-adult mortality due to chronic exposure to arsenic in local drinking water. Each individual's average exposure and cumulative exposure to arsenic over the time of the study were calculated. Age, sex, education and socioeconomic status were taken into account during the analysis of the results.
The graphs show survival rates for males and females over the 11-year period associated with different average levels of exposure to arsenic in drinking water.
- Identify TWO features of the method used that contributed to the validity of this study. (2 marks)
--- 2 WORK AREA LINES (style=lined) ---
- The hypothesis put forward was that exposure to arsenic in drinking water increases mortality in young adults.
- Discuss the data presented in the graphs in relation to this hypothesis. (4 marks)
--- 8 WORK AREA LINES (style=lined) ---
BIOLOGY, M8 2021 HSC 31
Millions of people around the world take drugs known as statins, which have been shown to reduce the incidence of heart attacks and strokes in vulnerable patients. However, up to 20% of people stop taking statins due to side-effects such as muscle aches, fatigue, feeling sick and joint pain.
A recent study at a public hospital focused on 60 patients who had all stopped taking statins in the past due to severe side-effects. Patients took statin tablets for four months, placebo tablets for four months and no tablets for four months.
Every day for the year the patients scored, from zero to 100, how bad their symptoms were. The results are shown.
Evaluate this study and its results. (6 marks)
--- 12 WORK AREA LINES (style=lined) ---