SmarterEd

Aussie Maths & Science Teachers: Save your time with SmarterEd

  • Login
  • Get Help
  • About

Networks, STD2 EQ-Bank 28

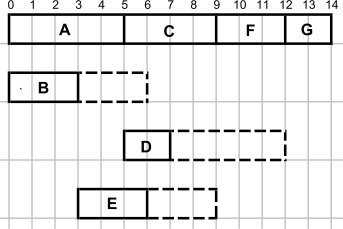
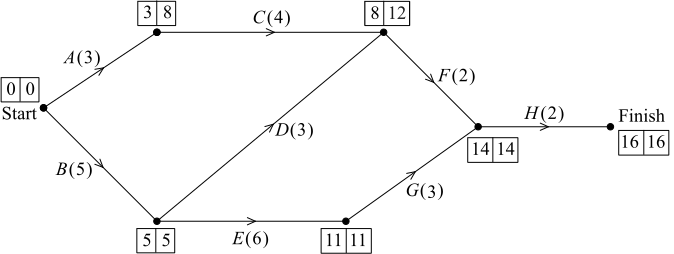
Lena is opening a new café. The project requires the completion of 7 activities, \(A\) to \(G\). The project is due to be completed in 15 days.

The directed network diagram shows these activities with their completion times in days.
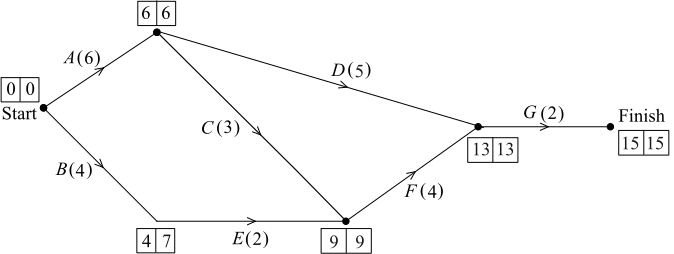


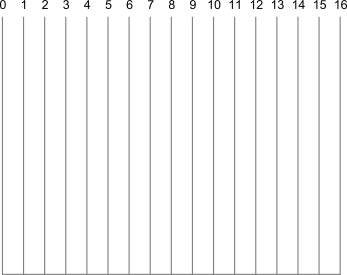
  1. Use the information from the network diagram to complete the Gantt chart, including the critical path and all other activities required for the project.   (3 marks)

    --- 0 WORK AREA LINES (style=lined) ---
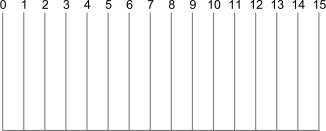


  2. List all activities, not on the critical path, which could be occurring at midday on day 7.   (1 mark)

    --- 3 WORK AREA LINES (style=lined) ---

Show Answers Only

a.
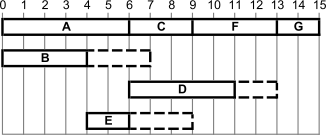
b.    \(B\text{, }D\text{ and }E\)

Show Worked Solution

a.

 
b.
    \(\text{By inspection of the Gantt chart.}\)

\(\text{Activities which could be occurring at }\approx 6.5\ \text{on chart (midday day 7):}\)

\(B\text{, }D\text{ and }E\)
Filed Under: Critical Path Analysis (Y12) Tagged With: Band 4, Band 5, smc-6916-35-Gantt Charts, syllabus-2027

Networks, STD2 EQ-Bank 27

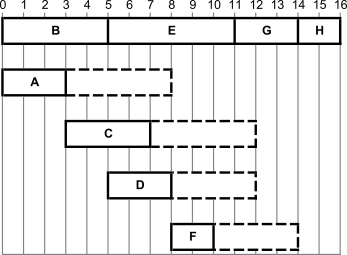
A project requires the completion of 8 activities, \(A\) to \(H\). The project is due to be completed in 16 days.

The directed network diagram shows these activities with their completion times in days.


  1. Use the information from the network diagram to complete the Gantt chart, including the critical path and all other activities required for the project.   (3 marks)

    --- 0 WORK AREA LINES (style=lined) ---


  2. List all activities, not on the critical path, which could be occurring at midday on day 9.   (1 mark)

    --- 3 WORK AREA LINES (style=lined) ---

Show Answers Only

a.

b.    \(C,  D\ \text{and}\ F\)

Show Worked Solution

a.

 
b.   
\(\text{By inspection of the Gantt chart.}\)

\(\text{Activities which could be occurring at}\ \approx 8.5\ \text{on chart (midday day 9):}\)

\(C, D\ \text{and}\ F\)

Filed Under: Critical Path Analysis (Y12) Tagged With: Band 4, Band 5, smc-6916-35-Gantt Charts, syllabus-2027

Networks, STD2 EQ-Bank 2 MC

The Gantt chart below shows the activities involved in organising a school sports carnival. 


Which activity has the greatest float time?

  1. \(\text{B}\)
  2. \(\text{D}\)
  3. \(\text{E}\)
  4. \(\text{G}\)
Show Answers Only

\(B\)

Show Worked Solution

\(\text{From the Gantt chart, the dashed extensions show:}\)

\(\text{B: float = 3 hours}\)

\(\text{D: float = 5 hours}\)

\(\text{E: float = 3 hours}\)

\(\text{G: float = 0 (critical path, no dashed extension)}\)

\(\text{Activity D has the greatest float time (5 hours).}\)

\(\Rightarrow B\)

Filed Under: Critical Path Analysis (Y12) Tagged With: Band 3, smc-6916-35-Gantt Charts, smc-6916-55-Float Times, syllabus-2027

Networks, STD2 EQ-Bank 6 MC

The Gantt chart below shows the activities involved in organising a community market day. Critical path activities are shown as solid bars and non-critical activities show available float as dashed extensions.


Activity \(D\) is delayed by 7 hours and activity \(B\) is delayed by 1 hour. What is the new minimum completion time for the project?

  1. 14 hours
  2. 15 hours
  3. 16 hours
  4. 22 hours
Show Answers Only

\(C\)

Show Worked Solution

\(\text{From the Gantt chart:}\)

\(\text{D has float of 5 hours. Delay of 7 exceeds float by 2.}\)

\(\text{B has float of 3 hours. Delay of 1 is within float.}\)

\(\text{Only the delay to D affects completion time.}\)

\(\text{New minimum} = 14+2 = 16 \text{ hours}\)

\(\Rightarrow C\)

Filed Under: Critical Path Analysis (Y12) Tagged With: Band 4, smc-6916-35-Gantt Charts, smc-6916-55-Float Times, syllabus-2027

Networks, STD2 EQ-Bank 25

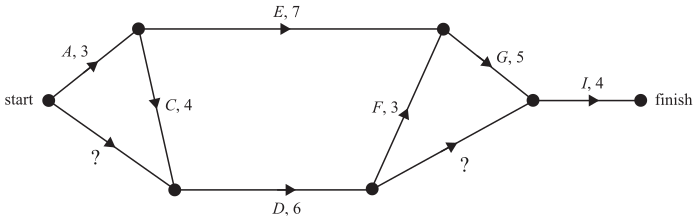
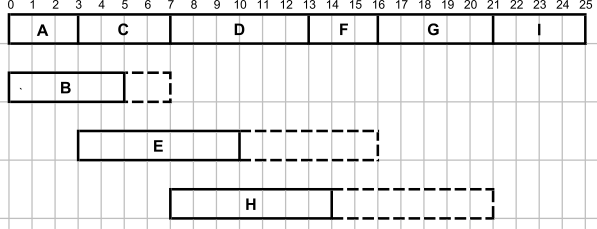
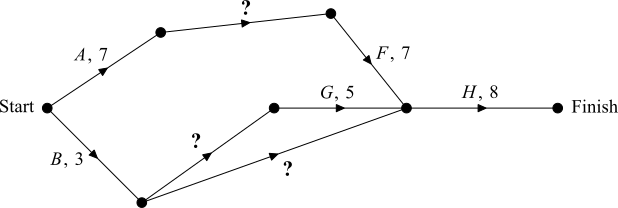
The construction of a new reptile exhibit is a project involving nine activities, \(A\) to \(I\). The network diagram below shows the activities and their completion times in weeks. Some values are missing.

The Gantt chart below has been created for this project.


  1. Using the Gantt chart, identify the critical path.   (1 mark)

    --- 2 WORK AREA LINES (style=lined) ---

  2. Use the Gantt chart to determine the missing values in the network diagram.   (2 marks)

    --- 4 WORK AREA LINES (style=lined) ---

  3. Activity \(E\) is delayed by 8 weeks. Using the Gantt chart, explain whether this will affect the minimum completion time of the project.   (2 marks)

    --- 5 WORK AREA LINES (style=lined) ---

Show Answers Only

a.    \(ACDFGI\)

b.    \(\text{B} = 5 \text{ weeks, H} = 7 \text{ weeks}\)

c.    \(\text{From the Gantt chart, activity E has a float of 6 weeks (see the dashed}\)

\(\text{extension from week 10 to 16).}\)

\(\text{The delay of 8 weeks exceeds the float of 6 weeks.}\)

\(\text{The project will be delayed by } 8-6 = 2 \text{ weeks.}\)

\(\text{New minimum completion time} = 25+2 = 27 \text{ weeks.}\)

Show Worked Solution

a.    \(\text{The critical path is the continuous solid bar on row 1 of the Gantt chart.}\)

\(\text{Critical path:}\ ACDFGI\)
 

b.    \(\text{Activities B and H are not labelled in the network diagram.}\)

\(\text{From the Gantt chart:}\)

\(\text{B starts at week 0, ends at week 5} \to \text{duration} = 5 \text{ weeks}\)

\(\text{H starts at week 7, ends at week 14} \to \text{duration} = 7 \text{ weeks}\)
 

c.    \(\text{From the Gantt chart, activity E has a float of 6 weeks (see the dashed}\)

\(\text{extension from week 10 to 16).}\)

\(\text{The delay of 8 weeks exceeds the float of 6 weeks.}\)

\(\text{The project will be delayed by } 8-6 = 2 \text{ weeks.}\)

\(\text{New minimum completion time} = 25+2 = 27 \text{ weeks.}\)

Filed Under: Critical Path Analysis (Y12) Tagged With: Band 3, Band 4, Band 5, smc-6916-35-Gantt Charts, smc-6916-40-Critical Path Adjustments, smc-6916-55-Float Times, syllabus-2027

Networks, STD2 EQ-Bank 18

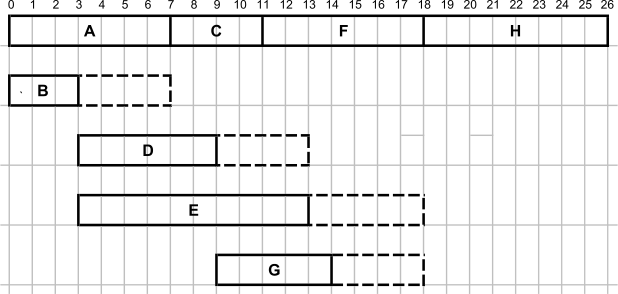
A Gantt chart for a project with activities \(A, B, C, D, E, F, G\) and \(H\) has been created. The Gantt chart can be used to complete the missing information on the edges in the network diagram.


  1. Use the Gantt chart to determine the three missing values in the network diagram.   (3 marks)

    --- 3 WORK AREA LINES (style=lined) ---

  2. State the minimum completion time for the project.   (1 mark)

    --- 2 WORK AREA LINES (style=lined) ---

Show Answers Only

a.    \(\text{C} = 4 \text{ hours, D} = 5 \text{ hours, E} = 7 \text{ hours}\)

b.    \(26 \text{ hours}\)

Show Worked Solution

a.    \(\text{Using the Gantt chart}\)

\(\text{C (between A and F):} \)

\(\Rightarrow\ \text{Starts hour 7, ends hour 11 = 4 hours duration}\)

\(\text{D (between B and G):}\)

\(\Rightarrow\ \text{Starts hour 3, ends hour 8 = 5 hours duration}\)

\(\text{E (between B and H):}\)

\(\Rightarrow\ \text{Starts hour 3, ends hour 10 = 7 hours duration}\)
 

b.    \(\text{From the Gantt chart, the project ends at hour 26.}\)

\(\text{Minimum completion time} = 26 \text{ hours}\)

Filed Under: Critical Path Analysis (Y12) Tagged With: Band 3, Band 4, smc-6916-35-Gantt Charts, syllabus-2027

Networks, STD2 EQ-Bank 26

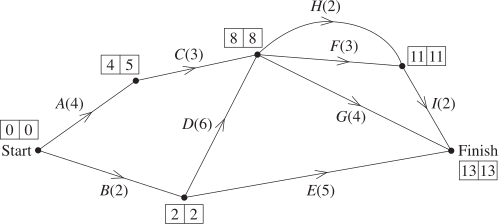
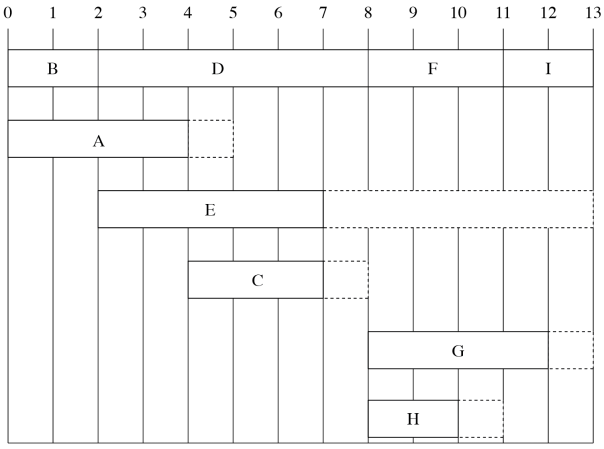
A project requires the completion of 9 activities, \(A\) to \(I\). The project is due to be completed in 13 days.

The directed network diagram shows these activities with their completion times in days.


  1. Use the information from the network diagram to complete the Gantt chart, including the critical path and all other activities required for the project.   (3 marks)

    --- 0 WORK AREA LINES (style=lined) ---


  2. List all activities, not on the critical path, which could be occurring at midday on day 8.   (1  mark)

    --- 3 WORK AREA LINES (style=lined) ---

Show Answers Only

a.    
     

b.    \(C\ \text{and}\ E\)

Show Worked Solution

a.    


b.
    \(\text{By inspection of the Gantt chart}\)

\(\text{Activities which could be occurring ~7.5 on chart (midday day 8):}

\(C\ \text{and}\ E\)

Filed Under: Critical Path Analysis (Y12) Tagged With: Band 4, Band 5, smc-6916-35-Gantt Charts, syllabus-2027

Copyright © 2014–2026 SmarterEd.com.au · Log in