SmarterEd

Aussie Maths & Science Teachers: Save your time with SmarterEd

  • Login
  • Get Help
  • About

Statistics, 2ADV EQ-Bank 6 MC

Which of these graphs best represents positively skewed data with the smaller standard deviation?
 

2UG-2006-8abMC

2UG-2006-8cdMC

Show Answers Only

`C`

Show Worked Solution

`text(By elimination:)`

`text(Positive skew when the tail on the right side is longer.)`

`:.\ text(NOT)\ B\ text(or)\ D`

`text(A smaller standard deviation occurs when data is clustered more closely.)`

`:.\ text(NOT)\ A\ text(where data is more widely spread.)`

`=>  C`

Filed Under: The Normal Distribution Tagged With: Band 4, smc-7138-40-Graphs

Statistics, 2ADV S3 2020 HSC 9 MC

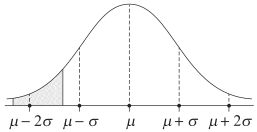
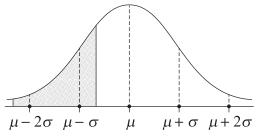
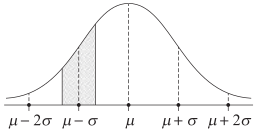
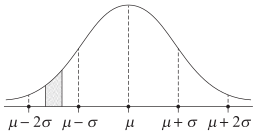
Suppose the weight of melons is normally distributed with a mean of `mu` and a standard deviation of `sigma`.

A melon has a weight below the lower quartile of the distribution but NOT in the bottom 10% of the distribution.

Which of the following most accurately represents the region in which the weight of this melon lies?
 

A. B.
C. D.
Show Answers Only

`C`

Show Worked Solution

`text(Distributions using)\ mu and sigma:`
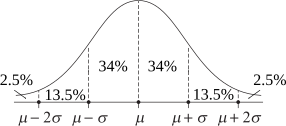


`text(Adjusting the above to identify the interval  10% < weight < 25%)`
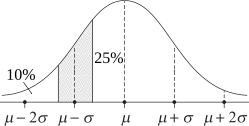
  
`=>C`

Filed Under: Normal Distribution, The Normal Distribution, The Normal Distribution (Y12) Tagged With: Band 4, common-content, smc-6919-20-z-score Intervals, smc-6919-40-Graphs, smc-7138-20-z-score Intervals, smc-7138-40-Graphs, smc-995-20-z-score Intervals, smc-995-40-Graphs

Copyright © 2014–2026 SmarterEd.com.au · Log in