All the students in a class of 30 did a test.
The marks, out of 10, are shown in the dot plot.
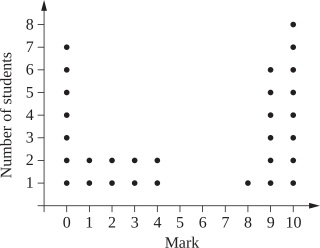
- Find the median test mark. (1 mark)
--- 1 WORK AREA LINES (style=lined) ---
- The mean test mark is 5.4. The standard deviation of the test marks is 4.22.
- Using the dot plot, calculate the percentage of the marks which lie within one standard deviation of the mean. (2 marks)
--- 4 WORK AREA LINES (style=lined) ---
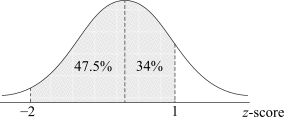
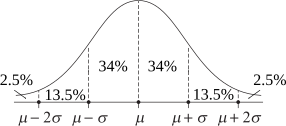
- A student states that for any data set, 68% of the scores should lie within one standard deviation of the mean. With reference to the dot plot, explain why the student’s statement is NOT relevant in this context. (1 mark)
--- 2 WORK AREA LINES (style=lined) ---