Describe how the endocrine system's release of cortisol affects an athlete's movement efficiency during periods of prolonged stress. (3 marks)
--- 7 WORK AREA LINES (style=lined) ---
Aussie Maths & Science Teachers: Save your time with SmarterEd
Describe how the endocrine system's release of cortisol affects an athlete's movement efficiency during periods of prolonged stress. (3 marks)
--- 7 WORK AREA LINES (style=lined) ---
Outline how the digestive system responds to acute stress during participation in a competitive sports event. (3 marks)
--- 7 WORK AREA LINES (style=lined) ---
Which statement best describes how protein intake affects the endocrine system's ability to support movement?
Explain how growth hormone and cortisol interact during a high-intensity interval training session. (5 marks)
--- 15 WORK AREA LINES (style=lined) ---
Describe the impact of exercise-induced thermal stress on digestive enzyme production. (3 marks)
--- 7 WORK AREA LINES (style=lined) ---
An archer notices their hands shaking before competition. This response is primarily caused by which hormone?
During a 400 metre sprint, an athlete's oxygen demand increases. Which sequence correctly shows the pathway of oxygen from inhalation to the working muscles?
A volleyball player performs a jump serve. Which respiratory system change enables efficient movement?
Outline how the principle of stability relates to safe movement in a standing position. (3 marks)
--- 6 WORK AREA LINES (style=lined) ---
In which movement does balance have the GREATEST impact on safe execution?
During a squat, which biomechanical principle is MOST important for maintaining safety?
Outline TWO structural characteristics of slow twitch muscle fibres. (3 marks)
--- 6 WORK AREA LINES (style=lined) ---
Name THREE major muscles of the upper body and outline their primary functions. (3 marks)
--- 6 WORK AREA LINES (style=lined) ---
Which pair of muscles work together in an agonist-antagonist relationship?
During a biceps curl, what occurs at the elbow joint?
Outline the joint actions that occur at the knee and ankle when performing a squat. (3 marks)
--- 6 WORK AREA LINES (style=lined) ---
Which type of muscular contraction is occurring in the quadriceps when descending into a squat?
Which row correctly identifies the action of performing a bicep curl?
\begin{align*}
\begin{array}{l}
\rule{0pt}{2.5ex} \ \rule[-1ex]{0pt}{0pt}& \\
\rule{0pt}{2.5ex}\textbf{A.}\rule[-1ex]{0pt}{0pt}\\
\rule{0pt}{2.5ex}\textbf{B.}\rule[-1ex]{0pt}{0pt}\\
\rule{0pt}{2.5ex}\textbf{C.}\rule[-1ex]{0pt}{0pt}\\
\rule{0pt}{2.5ex}\textbf{D.}\rule[-1ex]{0pt}{0pt}\\
\end{array}
\begin{array}{|l|l|l|}
\hline
\rule{0pt}{2.5ex}\textbf{Agonist Muscle}\rule[-1ex]{0pt}{0pt}& \textbf{Muscular Contraction}& \textbf{Joint Action} \\
\hline
\rule{0pt}{2.5ex}\text{Biceps brachii}\rule[-1ex]{0pt}{0pt}&\text{Isometric eccentric}&\text{Elbow extension}\\
\hline
\rule{0pt}{2.5ex}\text{Biceps brachii}\rule[-1ex]{0pt}{0pt}& \text{Isometric concentric}&\text{Elbow flexion}\\
\hline
\rule{0pt}{2.5ex}\text{Triceps brachii}\rule[-1ex]{0pt}{0pt}& \text{Isometric concentric}&\text{Elbow flexion} \\
\hline
\rule{0pt}{2.5ex}\text{Triceps brachii}\rule[-1ex]{0pt}{0pt}& \text{Isometric eccentric}&\text{Elbow extension} \\
\hline
\end{array}
\end{align*}
Which row in the table shows the current infant mortality and life expectancy trends in Australia?
\begin{align*}
\begin{array}{l}
\rule{0pt}{2.5ex} \ \rule[-1ex]{0pt}{0pt}& \\
\rule{0pt}{2.5ex}\quad\textbf{A.}\rule[-1ex]{0pt}{0pt}\\
\rule{0pt}{2.5ex}\quad\textbf{B.}\rule[-1ex]{0pt}{0pt}\\
\rule{0pt}{2.5ex}\quad\textbf{C.}\rule[-1ex]{0pt}{0pt}\\
\rule{0pt}{2.5ex}\quad\textbf{D.}\rule[-1ex]{0pt}{0pt}\\
\end{array}
\begin{array}{|c|c|}
\hline
\rule{0pt}{2.5ex}\textit{Infant Mortality}\rule[-1ex]{0pt}{0pt}& \textit{Life Expectancy} \\
\hline
\rule{0pt}{2.5ex}\text{Decreasing}\rule[-1ex]{0pt}{0pt}&\text{Increasing}\\
\hline
\rule{0pt}{2.5ex}\text{Decreasing}\rule[-1ex]{0pt}{0pt}& \text{Decreasing}\\
\hline
\rule{0pt}{2.5ex}\text{Increasing}\rule[-1ex]{0pt}{0pt}& \text{Stable} \\
\hline
\rule{0pt}{2.5ex}\text{Stable}\rule[-1ex]{0pt}{0pt}& \text{Increasing} \\
\hline
\end{array}
\end{align*}
An Olympic weightlifter continues to train despite a minor injury because they are afraid of losing their sponsorship deals and disappointing their parents who have invested significant money in their career. This athlete's motivation is primarily:
A swimmer trains consistently at 5 a.m. every morning, setting personal goals to improve their technique and times, with the aim of qualifying for the Olympic team. This athlete's motivation is primarily:
A torque is applied to a nut, using a wrench, as shown.

Suggest TWO ways that the applied torque could be increased. (2 marks)
--- 4 WORK AREA LINES (style=lined) ---
A towbar hitch and shear pin is shown. The hitch is exposed to various environmental conditions. Outline a method to protect against corrosion. (2 marks) --- 5 WORK AREA LINES (style=lined) ---

Outline ways in which satellite services have benefited people living and working in rural areas. (2 marks) --- 5 WORK AREA LINES (style=lined) ---
Outline how 'Black Box' flight data recorders have led to improved aviation safety. (2 marks) --- 3 WORK AREA LINES (style=lined) ---
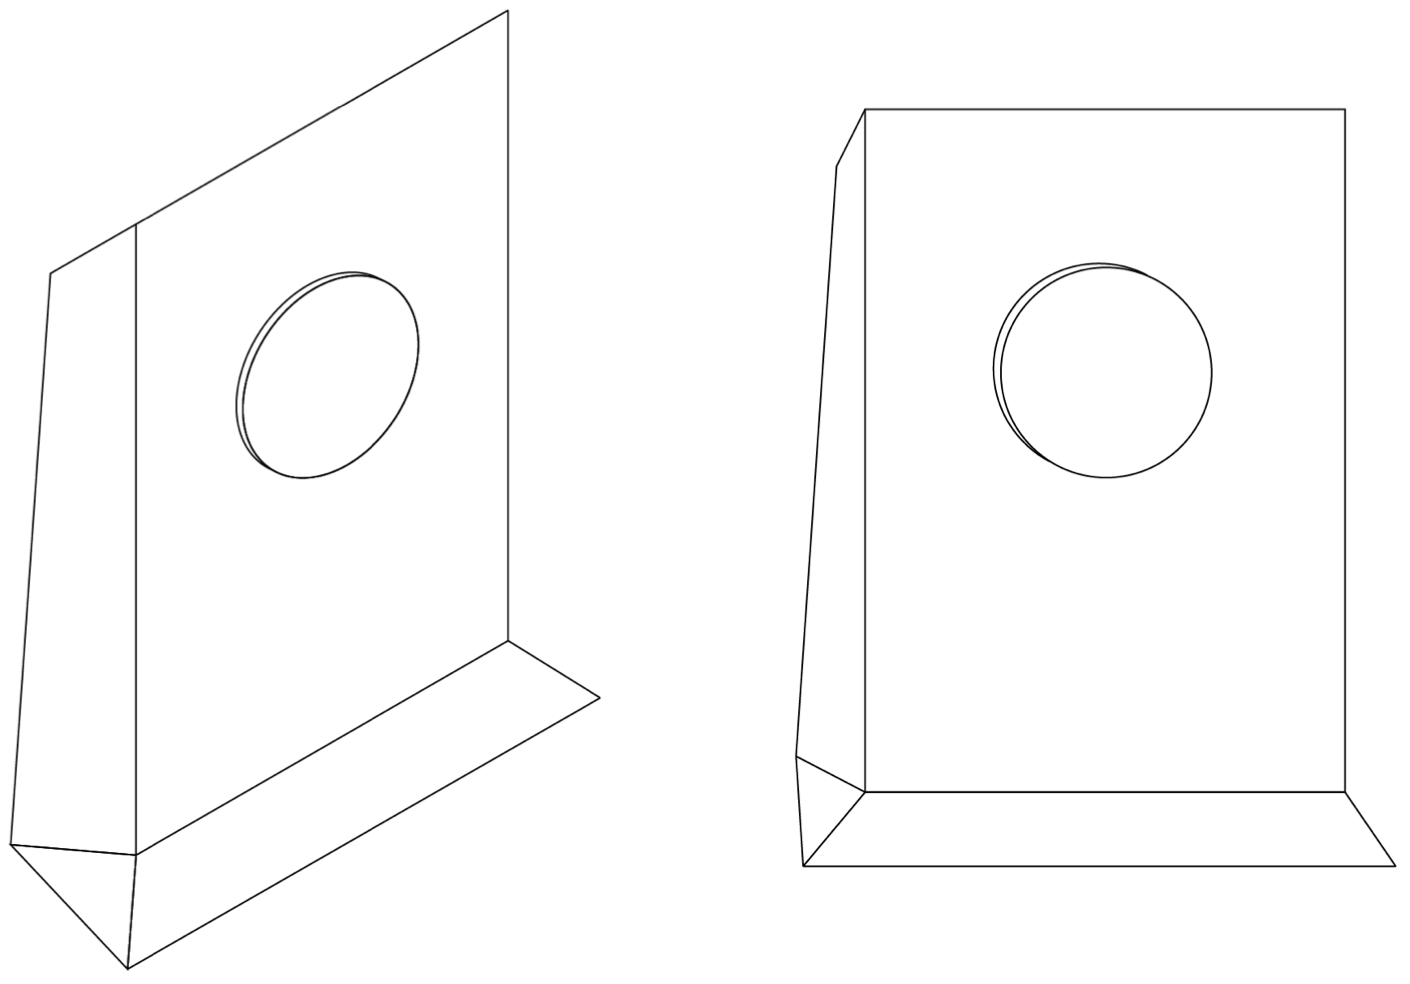
An orthogonal drawing of a wi-fi router is shown. Construct a freehand pictorial sketch of the wi-fi router as viewed in the direction of the arrow. (3 marks) --- 0 WORK AREA LINES (style=blank) --- \begin{array} {|l|} Answers could include: Answers could include:


\hline
\ \qquad \qquad \qquad \qquad \qquad \qquad \qquad \qquad \qquad \qquad \qquad \qquad \qquad \qquad \qquad \qquad \qquad \\
\ \\
\ \\
\ \\
\ \\
\ \\
\ \\
\ \\
\ \\
\ \\
\ \\
\ \\
\ \\
\ \\
\hline
\end{array}
Show Answers Only
Show Worked Solution
Telecommunications engineers face many work health and safety risks while carrying out their duties. With reference to ONE issue, describe strategies that can be implemented to reduce the risk for the engineer. (3 marks) --- 6 WORK AREA LINES (style=lined) ---
Discuss the use of computer-aided drawing (CAD) in aeronautical engineering. (3 marks) --- 6 WORK AREA LINES (style=lined) ---
Outline the environmental responsibilities of an aeronautical engineer. (2 marks) --- 5 WORK AREA LINES (style=lined) ---
Two piers from different eras, used to support civil structures, are shown. Outline how innovations in engineering materials have improved the inservice properties of piers. (2 marks) --- 5 WORK AREA LINES (style=lined) ---

Which is the correct angle of repose for rock fill, used on a highway construction, that has a coefficient of friction of 0.84?
What is the primary function of GPS satellites?
An electron gun fires a beam of electrons at 2.0 × 10\(^6\) m s\(^{-1}\) through a pair of parallel charged plates towards a screen that is 30 mm from the end of the plates as shown. There is a uniform electric field between the plates of 1.5 × 10\(^4\) N C\(^{-1}\). The plates are 5.0 mm wide and 20 mm apart. The electron beam enters mid-way between the plates. \(X\) marks the spot on the screen where an undeflected beam would strike. Ignore gravitational effects on the electron beam. --- 4 WORK AREA LINES (style=lined) --- --- 4 WORK AREA LINES (style=lined) --- --- 6 WORK AREA LINES (style=lined) ---

The points shown on the chart below represent monthly online sales in Australia. The variable \(y\) represents sales in millions of dollars. The variable \(t\) represents the month when the sales were made, where \(t=1\) corresponds to January 2021, \(t=2\) corresponds to February 2021 and so on. The graph of \(y=p(f)\) is shown as a dashed curve on the set of axes above. It has a local minimum at (2,2500) and a local maximum at (11,4400). --- 5 WORK AREA LINES (style=lined) --- ii. Let \(q:(12,24] \rightarrow R, q(t)=p(t-h)+k\) be a cubic function obtained by translating \(p\), which can be used to model monthly online sales in 2022. Find the values of \(h\) and \(k\) such that the graph of \(y=q(t)\) has a local maximum at \((23,4750)\). (2 marks) --- 5 WORK AREA LINES (style=lined) --- Part of the graph of \(f\) is shown on the axes below. --- 0 WORK AREA LINES (style=lined) --- Find the value of \(n\). (1 mark) --- 3 WORK AREA LINES (style=lined) --- --- 3 WORK AREA LINES (style=lined) --- --- 4 WORK AREA LINES (style=lined) --- ai. \(a\approx -5.21, b\approx 101.65, c\approx -344.03, d\approx 2823.18\) aii. \(h=12, k=350\) bi. bii. \( n=360\) biii. \(f^{\prime}(t)=30-\dfrac{350\pi}{3}\sin\left(\dfrac{\pi t}{6}\right)-\dfrac{400\pi}{3}\sin\left(\dfrac{\pi t}{3}\right)\) biv. \(\text{Maximum rate occurs at }t=10.2, 22.2, 34.2\) \(\text{Maximum rate}\ \approx 725\ \text{million/month}\) \(a\approx -5.21, b\approx 101.65, c\approx -344.03, d\approx 2823.18\) aii. \(\text{Local maximim }p(t)\ \text{is}\ (11, 4400)\) bi. \(\text{Plotting points from CAS:}\) \((24,4820), (26, 3930), (28, 3290), (30, 3600), (32, 3410), (34, 4170), (36, 5180)\) bii. \(\text{Using CAS: }\) \(\therefore\ n=360\) \(\text{Maximum rate occurs at }t=10.2, 22.2, 34.2\) \(\text{Maximum rate using CAS:}\) \(f^{\prime}(10.2)=f^{\prime}(22.2)=f^{\prime}(34.2)=725.396\approx 725\ \text{million/month}\)

i. Find, correct to two decimal places, the values of \(a, b, c\) and \(d\). (3 mark)
\(f:(0,36] \rightarrow R, f(t)=3000+30 t+700 \cos \left(\dfrac{\pi t}{6}\right)+400 \cos \left(\dfrac{\pi t}{3}\right)\)

Show Answers Only
 Show Worked Solution
ai. \(\text{Given}\ p(2)=2500, p(11)=4400, p^{\prime}(2)=0\ \text{and}\ p^{\prime}(11)=0\)
\(p(t)=at^3+bt^2+ct+d\ \Rightarrow\ p^{\prime}(t)=3at^2+2bt+c\)
Show Worked Solution
ai. \(\text{Given}\ p(2)=2500, p(11)=4400, p^{\prime}(2)=0\ \text{and}\ p^{\prime}(11)=0\)
\(p(t)=at^3+bt^2+ct+d\ \Rightarrow\ p^{\prime}(t)=3at^2+2bt+c\)
\(\text{Using CAS:}\)
\(\text{Solve}
\begin{cases}
8a+4b+2c+d=2500 \\
1331a+121b+11c+d=4400 \\
12a+4b+c=0 \\
363a+22b+c=0
\end{cases}\)
\(\therefore\ h\)
\(=23-11=12\)
\(k\)
\(=4750-4400=350\)
\(f(12)-f(0)\)
\(=4460-4100=360\)
\(f(24)-f(12)\)
\(=4820-4460=360\)
\(f(36)-f(24)\)
\(=5180-4820=360\)
biii.
\(f(t)\)
\(=3000+30t+700\cos\left(\dfrac{\pi t}{6}\right)+400\cos\left(\dfrac{\pi t}{3}\right)\)
\(f^{\prime}(t)\)
\(=30-\dfrac{700\pi}{6}\sin\left(\dfrac{\pi t}{6}\right)-\dfrac{400\pi}{3}\sin\left(\dfrac{\pi t}{3}\right)\)
\(=30-\dfrac{350\pi}{3}\sin\left(\dfrac{\pi t}{6}\right)-\dfrac{400\pi}{3}\sin\left(\dfrac{\pi t}{3}\right)\)
biv. \(\text{Max instantaneous rate of change occurs when }f^{\prime\prime}(t)=0\)
A model for the temperature in a room, in degrees Celsius, is given by \(f(t)=\left\{ where \(t\) represents time in hours after a heater is switched on. --- 3 WORK AREA LINES (style=lined) --- --- 2 WORK AREA LINES (style=lined) --- --- 2 WORK AREA LINES (style=lined) --- --- 2 WORK AREA LINES (style=lined) --- --- 2 WORK AREA LINES (style=lined) --- --- 4 WORK AREA LINES (style=lined) --- \(p(t)=\left\{ The amount of energy used by the heater, in kilowatt hours, can be estimated by evaluating the area between the graph of \(y=p(t)\) and the \(t\)-axis. --- 4 WORK AREA LINES (style=lined) --- --- 3 WORK AREA LINES (style=lined) --- --- 3 WORK AREA LINES (style=lined) ---
a. \(f^{\prime}(t)=\left\{ b. \(\text{When }\ t=0, f(t)=12\ \ \text{and when }\ t=\dfrac{1}{2}, f(t)=22\) \(\text{Using CAS:}\) \(\text{Temps equal when}\ t\approx 0.27\ \text{(2 d.p.)}\) \(\text{Max time diff when}\ \dfrac{dD}{dt}=0\) fi. \(\text{Because function is continuous}\) \(\text{Or, considering the graph, the area from 0 to 0.4 }=0.6\ \rightarrow t<0.4\) \(\therefore\ \text{Solving}\ 1.5t=0.5\ \rightarrow\ t=\dfrac{1}{3}\) \(\therefore\ \text{It takes }\dfrac{1}{3}\ \text{hours for heater to use 0.5 kilowatts.}\) fiii. \(\text{Using CAS:}\)
\begin{array}{cc}12+30 t & \quad \quad 0 \leq t \leq \dfrac{1}{3} \\
22 & t>\dfrac{1}{3}
\end{array}\right.\)
\begin{array}{cl}1.5 & 0 \leq t \leq 0.4 \\
0.3+A e^{-10 t} & t>0.4
\end{array}\right.\)

Show Worked Solution
\begin{array}{cc}30 & \quad \quad 0 \leq t < \dfrac{1}{3} \\
0 & t>\dfrac{1}{3}
\end{array}\right.\)
\(\therefore\ \text{Average rate of change}\)
\(=\dfrac{22-12}{\frac{1}{2}}\)
\(=20^{\circ}\text{C/h}\)
ci.
\(g(t)\)
\(=22-10 e^{-6 t}\)
\(g^{\prime}(t)\)
\(=60e^{-6t},\ \ t\geq 0\)
cii.
\(60e^{-6t}\)
\(=10\)
\(-6t\,\ln{e}\)
\(=\ln{\dfrac{1}{6}}\)
\(t\)
\(=\dfrac{\ln{\frac{1}{6}}}{-6}\)
\(=0.2986…\approx 0.299\ \text{(3 d.p.)}\)
d.
\(\left\{
\begin{array}{cc}12+30 t & \ \ 0 \leq t \leq \dfrac{1}{3} \\
22 & t>\dfrac{1}{3}
\end{array}\right.\)\(=22-10e^{-6t}\)

e.
\(\text{Difference }(D)\)
\(=|g(t)-f(t)|\)
\(=\left(22-10e^{-6t}\right)-(12+30t)\)
\(\dfrac{dD}{dt}\)
\(=60e^{-6t}-30\)
\(\therefore\ 60e^{-6t}-30\)
\(=0\)
\(e^{-6t}\)
\(=0.5\)
\(-6t\)
\(=\ln{0.5}\)
\(t\)
\(=0.1155\dots\)
\(\approx 0.12\ \text{(2 d.p.)}\)
\(0.3+Ae^{-10t}\)
\(=1.5\)
\(Ae^{-10\times 0.4}\)
\(=1.2\)
\(A\)
\(=\dfrac{1.2}{e^{-10\times 0.4}}\)
\(=1.2e^4\)
fii. \(\text{Using CAS:}\)
\(1.5\times 4+\displaystyle\int_{0.4}^{t}0.3+1.2e^4.e^{-10t}dt\)
\(=1\)
\(\Bigg[0.3t+0.12e^4.e^{-10t}\Bigg]_{0.4}^{t}\)
\(=0.4\)
\(t\)
\(=1.3333\dots\)
\(\approx 1.33\ \text{(2 d.p.)}\)
Consider the function \( f: R \rightarrow R, f(x)=(x+1)(x+a)(x-2)(x-2 a) \text { where } a \in R \text {. } \) --- 2 WORK AREA LINES (style=lined) --- --- 4 WORK AREA LINES (style=lined) --- ii. exactly four \(x\)-intercepts. (1 mark) --- 3 WORK AREA LINES (style=lined) --- --- 2 WORK AREA LINES (style=lined) --- ii. Find the coordinates of the local maximum of \(g\). (1 mark) --- 3 WORK AREA LINES (style=lined) --- iii. Find the values of \(x\) for which \(g^{\prime}(x)>0\). (1 mark) --- 3 WORK AREA LINES (style=lined) --- iv. Consider the two tangent lines to the graph of \(y=g(x)\) at the points where --- 5 WORK AREA LINES (style=lined) --- Let \(h\) be the function \(h: R \rightarrow R, h(x)=(x+1)(x-1)(x+2)(x-2)\), which is the function \(f\) where \(a=-1\). --- 4 WORK AREA LINES (style=lined) --- ii. Using a dilation and translations, describe a different sequence of transformations of \(h\), for which its image would have both local minimums at the same coordinates as that of \(g\). (2 marks) --- 6 WORK AREA LINES (style=lined) ---
a. \(x=-1, x=a, x=2, x=2a\) bi. \(a=0, -2, -\dfrac{1}{2}\) bii. \(\text{The solution must be all }R\ \text{except those that give 3 or less solutions.}\) \(\therefore\ R\ \backslash\left\{ -2, -\dfrac{1}{2}, 0, 1\right\}\) \(\text{From graph local maximum occurs when }x=\dfrac{1}{2}\) ciii. \(\text{From graph}\ g^{\prime}(x)>0\ \text{when }x\in\left(-1, \dfrac{1}{2}\right)\cup (2, \infty)\) civ. \(\text{Use CAS to find tangent lines and solve to find intersection.}\) \(\text{Point of intersection of tangent lines}\ \left(\dfrac{1}{2}, \dfrac{27}{4}\right)\) di. \(\text{Local maximum of }g(x)\ \rightarrow\left(\dfrac{1}{2}, \dfrac{81}{16}\right)\) \(\text{From CAS local maximum of }h(x)\ \rightarrow \left(0, 4\right)\) \(\therefore\ \text{Translate }\dfrac{1}{2}\ \text{unit to the right and }\dfrac{81}{16}-4=\dfrac{17}{16}\ \text{units upwards.}\) dii. \(\text{Using CAS to solve }g^{\prime}(x)=0\ \text{and }h^{\prime}(x)=0\) \(\text{Local Minimums for }g(x)\ \text{at }(-1, 0)\ \text{and }(2, 0)\ \text{which are 3 apart.}\) \(\text{Local minimums for at }h(x)\ \text{at }\left(-\sqrt{\dfrac{5}{2}}, -\dfrac{9}{4}\right)\ \text{and }\left(\sqrt{\dfrac{5}{2}}, -\dfrac{9}{4}\right)\) \(\therefore\ \text{Combination is a dilation of }h(x)\ \text{by a factor of}\ \dfrac{3}{\sqrt{10}}\ \text{followed by a }\) \(\text{translation of }\dfrac{1}{2} \ \text{a unit to the right and an upwards translation of}\ \dfrac{9}{4} \ \text{units.}\)
i. exactly three \(x\)-intercepts. (2 marks)
i. Find \(g^{\prime}(x)\) (1 mark)
\(x=\dfrac{-\sqrt{3}+1}{2}\) and \(x=\dfrac{\sqrt{3}+1}{2}\). Determine the coordinates of the point of intersection of these two tangent lines. (2 marks)
i. Using translations only, describe a sequence of transformations of \(h\), for which its image would have a local maximum at the same coordinates as that of \(g\). (1 mark)
Show Worked Solution
ci.
\(g^{\prime}(x)\)
\(=2(2-x)(x+1)^2+(x-2)^22(x+1)\)
\(=2(x-2)(x+1)(x+1+x+2)\)
\(=2(x-2)(x+1)(2x-1)\)
cii. \(\text{When }g^{\prime}(x)=0, x=2, -1, \dfrac{1}{2}\)
\(g\left(\dfrac{1}{2}\right)\)
\(=\left(\dfrac{1}{2}+1\right)^2\left(\dfrac{1}{2}-2\right)^2\)
\(=\dfrac{9}{4}\times \dfrac{9}{4}=\dfrac{81}{16}\)
\(\therefore\ \text{Local maximum at}\ \left(\dfrac{1}{2} , \dfrac{81}{16}\right)\)
A function \(g: R \rightarrow R\) has the derivative \( { \displaystyle g^{\prime}(x)=x^3-x } \).
Given that \(g(0)=5\), the value of \(g(2)\) is
To tighten a nut, a force of 75 N is applied to a spanner at an angle, as shown. --- 4 WORK AREA LINES (style=lined) --- --- 10 WORK AREA LINES (style=lined) ---

The photoelectric effect is mathematically modelled by the following relationship:
\(K_{\max }=h f-\phi\)
In this model, the symbol \(\phi\) represents the amount of energy
A star cluster is a group of stars that form at the same time. Hertzsprung-Russell diagrams for three star clusters, \(X, Y\) and \(Z\) are shown.

Which row of the table correctly shows the three star clusters from youngest to oldest?

Which of the following provides evidence for the model of light proposed by Huygens?
Balance the following chemical equations:
\(\ce{CuSO4(aq) + AgNO3(aq) -> Ag2SO4(s) + Cu(NO3)2(aq)}\) (1 mark)
Cystic fibrosis is an inherited disorder that causes damage to the lungs, digestive system and other organs in the body. A person with cystic fibrosis will have two faulty recessive alleles for the cystic fibrosis gene (CFTR) on chromosome 7. Two healthy parents, heterozygous for cystic fibrosis, have a child that does not have cystic fibrosis. They are planning to have a second child. Using a Punnett square, determine the probability of their second child being born with the condition. Use \(R\) for the normal CFTR allele, and \(r\) for the faulty CFTR allele. (3 marks) --- 3 WORK AREA LINES (style=lined) --- --- 8 WORK AREA LINES (style=lined) ---
 The defect that creates the faulty CFTR allele is often caused by the deletion of three nucleotides. The following diagram illustrates a small section of the CFTR gene and the corresponding amino acid sequence of the CFTR protein.
 The following codon chart displays all the codons and the corresponding amino acids. The chart translates mRNA sequences into amino acids.

One-Eyed Jack was a rescue dog that had been injured and lost an eye before his owner adopted him. One-Eyed Jack was cloned and the clone was born with two eyes. --- 4 WORK AREA LINES (style=lined) --- Describe how animals like dogs can be cloned. (4 marks) --- 8 WORK AREA LINES (style=lined) ---
--- 3 WORK AREA LINES (style=lined) ---
--- 7 WORK AREA LINES (style=lined) ---
A student designed and conducted a practical investigation to test for the presence of microbes in water and food samples. --- 4 WORK AREA LINES (style=lined) --- --- 4 WORK AREA LINES (style=lined) ---
A diagram of the different parts of a flower is shown.

--- 2 WORK AREA LINES (style=lined) ---
\begin{array} {|l|c|}
\hline
\rule{0pt}{2.5ex} \text{Feature} \rule[-1ex]{0pt}{0pt} & \quad \quad \text{Sexual}\quad \quad \rule[-1ex]{0pt}{0pt} & \quad \quad \text{Asexual}\quad \quad\\
\hline
\rule{0pt}{2.5ex} \text{Genetic variability} \\
\text{(yes/no)} \rule[-1ex]{0pt}{0pt} \\
\hline
\rule{0pt}{2.5ex} \text{Number of parents } \\
\text{required} \rule[-1.5 ex]{0pt}{0pt}\\
\hline
\rule{0pt}{2.5ex} \text{Example of an organism }\\
\text{which uses this type of }& \text{}\\
\text{reproduction} \rule[-1ex]{0pt}{0pt}\\
\hline
\end{array}
--- 0 WORK AREA LINES (style=lined) ---
The boiling points for two series of compounds are listed. --- 0 WORK AREA LINES (style=lined) --- --- 12 WORK AREA LINES (style=lined) --- a. b. The alcohols have higher boiling points than amines of the same chain length. As the chain length of the alcohols and amines increase, the boiling points also increase. a. b. The alcohols have higher boiling points than amines of the same chain length. As the chain length of the alcohols and amines increase, the boiling points also increase.


Show Answers Only

Show Worked Solution

A manufacturer \((M)\) makes deliveries to the supermarket \((S)\) via a number of storage warehouses, \(L, N, O, P, Q\) and \(R\). These eight locations are represented as vertices in the network below. The numbers on the edges represent the maximum number of deliveries that can be made between these locations each day. --- 1 WORK AREA LINES (style=lined) --- --- 1 WORK AREA LINES (style=lined) --- --- 0 WORK AREA LINES (style=lined) ---
a. \(13+18+6+9=46\) \(\text{(Reverse flow}\ Q → O\ \text{is not counted.)}\) b. \(\text{Max deliveries (min cut)}\ =13+5+11+8=37\) \(\text{locations R and S.}\)

locations ____ and ____. (1 mark)
Show Worked Solution
 ♦ Mean mark (b) 29%.
c. \(\text{The number of deliveries should be increased between}\)
♦ Mean mark (c) 22%.
A solution of acetic acid reacts with magnesium metal. Write the names of the products of this reaction in the boxes provided. (2 marks) --- 0 WORK AREA LINES (style=lined) ---

The following system is at equilibrium.
\(\underset{\text { propan-2-ol }}{\ce{CH_3CHOHCH_3(g)}} \rightleftharpoons \underset{\text {propan-2-one}}{\ce{CH_3COCH_3(g)}}\)\(\ce{+ H_2(g)}\)
A catalyst is added to the system.
Which row of the table correctly identifies the change in the yield of propan-2-one and the reaction rates?
\begin{align*}
\begin{array}{l}
\ & \\
\\
\textbf{A.}\\
\\
\textbf{B.}\\
\\
\textbf{C.}\\
\\
\textbf{D.}\\
\\
\end{array}
\begin{array}{|l|l|}
\hline
\quad\quad \textit{Yield of } & \quad \quad \quad \quad \textit{Reaction Rates} \\
\quad\textit{propan-2-one} & \textit{} \\
\hline
\text{Remains the same} & \text{Both forward and reverse rates} \\
\text{} & \text{are unchanged.} \\
\hline
\text{Remains the same} & \text{Both forward and reverse rates} \\
\text{} & \text{increase equally} \\
\hline
\text{Decreases} & \text{Reverse rate increases more than} \\
\text{} & \text{the forward rate increases.} \\
\hline
\text{Increases} & \text{Forward rate increases more than}\\
\text{} & \text{the reverse rate increases.}\\
\hline
\end{array}
\end{align*}
Which of the following is the mass spectrum of ethanamine?


Which pair of ions produce different colours in a flame test?
An infrared spectrum of an organic compound is shown.

Which of the following compounds would produce the spectrum shown?


A supermarket has five departments, with areas allocated as shown on the floorplan below. The floorplan is represented by the graph below. On this graph, vertices represent departments and edges represent boundaries between two departments. This graph is incomplete. --- 0 WORK AREA LINES (style=lined) --- Karla is standing in the Promotional department. She wants to visit each department in the supermarket once only. --- 1 WORK AREA LINES (style=lined) --- --- 1 WORK AREA LINES (style=lined) --- \begin{aligned} --- 0 WORK AREA LINES (style=lined) --- a. b.ii. \(\text{Hamiltonian Path}\) c. a. b.i. \(\text{Bakery}\) b.ii. \(\text{The path has no repeated edges or vertices, and }\) \(\text{incudes all the edges of the graph.}\) \(\therefore\ \text{It is a Hamiltonian Path.}\) c.


& \ \ B \ \ \ D \ \ \ E \ \ \ F \ \ \ G \ \ \ P \\
\begin{array}{c}
B\\
D \\
E \\
F \\
G \\
P
\end{array}& \begin{bmatrix}
0 & 1 & 1 & 1 & 0 & 1 \\
1 & 0 & 0 & 1 & 1 & 0 \\
1 & 0 & 0 & 0 & 0 & 1 \\
1 & 1 & 0 & 0 & 1 & 1 \\
0 & 1 & 0 & 1 & 0 & 1 \\
1 & 0 & 1 & 1 & 1 & 0
\end{bmatrix}
\end{aligned}
 Show Answers Only

b.i. \(\text{The bakery}\)
 Show Worked Solution
Vince works on a construction site. The amount Vince gets paid depends on the type of shift he works, as shown in the table below. \begin{array}{|l|c|c|c|} This information is shown in matrix \(R\) below. \begin{align*} --- 3 WORK AREA LINES (style=lined) --- During one week, Vince works 28 hours at the normal rate of pay, 6 hours at the overtime rate of pay, and 8 hours at the weekend rate of pay. --- 0 WORK AREA LINES (style=lined) --- Vince will receive $90 per hour if he works a public holiday shift. Matrix \(Q\), as calculated below, can be used to show Vince's hourly rate for each type of shift. \begin{align*} --- 3 WORK AREA LINES (style=lined) ---
\hline
\rule{0pt}{2.5ex} \textbf{Shift type} \rule[-1ex]{0pt}{0pt}& \textbf{Normal} & \textbf{Overtime} & \textbf {Weekend} \\
\hline
\rule{0pt}{2.5ex} \textbf{Hourly rate of pay} \rule[-1ex]{0pt}{0pt} \ \text{(\$ per hour)} & 36 & 54 & 72 \\
\hline
\end{array}
R=\left[\begin{array}{lll}
36 & 54 & 72
\end{array}\right]
\end{align*}
![]()
\begin{aligned}
Q & =n \times\left[\begin{array}{llll}
1 & 1.5 & 2 & p
\end{array}\right] \\
& =\left[\begin{array}{llll}
36 & 54 & 72 & 90
\end{array}\right]
\end{aligned}
\end{align*}
Emi operates a mobile dog-grooming business. The value of her grooming equipment will depreciate. Based on average usage, a rule for the value, in dollars, of the equipment, \(V_n\), after \(n\) weeks is \(V_n=15000-60 n\) Assume that there are exactly 52 weeks in a year. --- 1 WORK AREA LINES (style=lined) --- --- 2 WORK AREA LINES (style=lined) --- --- 2 WORK AREA LINES (style=lined) --- --- 2 WORK AREA LINES (style=lined) ---
The Olympic gold medal-winning height for the women's high jump, \(\textit{Wgold}\), is often lower than the best height achieved in other international women's high jump competitions in that same year. The table below lists the Olympic year, \(\textit{year}\), the gold medal-winning height, \(\textit{Wgold}\), in metres, and the best height achieved in all international women's high jump competitions in that same year, \(\textit{Wbest}\), in metres, for each Olympic year from 1972 to 2020. A scatterplot of \(\textit{Wbest}\) versus \(\textit{Wgold}\) for this data is also provided. When a least squares line is fitted to the scatterplot, the equation is found to be: \(Wbest =0.300+0.860 \times Wgold\) The correlation coefficient is 0.9318 --- 1 WORK AREA LINES (style=lined) --- --- 0 WORK AREA LINES (style=lined) --- --- 1 WORK AREA LINES (style=lined) --- --- 0 WORK AREA LINES (style=lined) --- \begin{array}{|l|l|} --- 3 WORK AREA LINES (style=lined) --- --- 4 WORK AREA LINES (style=lined) --- --- 0 WORK AREA LINES (style=lined) --- --- 3 WORK AREA LINES (style=lined) --- --- 2 WORK AREA LINES (style=lined) --- a. \(Wbest\) b. c. \(86.8\%\) d. \(\text{Strong, positive}\) e. \(Wbest\ \text{will increase, on average, by 0.86 metres for every metre of increase in}\ Wgold.\) \(\therefore\ \text{Residual}\ =2.07-2.0372=0.0328\) g.i. g.ii. \(\text{Yes, it is justified as there is no clear pattern, linear or otherwise.}\) h. \(\text{This prediction is outside the data range (1972 – 2020 → extrapolation)}\) \(\text{and therefore cannot be relied upon.}\) a. \(Wbest\) b. \(\text{Using points:}\ (1.90, 1.934)\ \text{and}\ (2.00, 2.02)\) c. \(r=0.9318\ \ \Rightarrow\ \ r^2=0.9318^2=0.8682\dots\) \(\therefore\ \text{Coefficient of determination} \approx 86.8\%\) d. \(\text{Strong, positive}\) e. \(Wbest\ \text{will increase, on average, by 0.86 metres for every metre of increase in}\ Wgold.\) g.i. g.ii. \(\text{Yes, it is justified as there is no clear pattern, linear or otherwise.}\)
h. \(\text{This prediction is outside the data range (1972–2020 → extrapolation)}\) \(\text{and therefore cannot be relied upon.}\)


\hline
\rule{0pt}{2.5ex}\text { strength } \rule[-1ex]{0pt}{0pt} & \quad \quad\quad\quad\quad\quad\quad\quad\quad\quad\quad\\
\hline
\rule{0pt}{2.5ex}\text { direction } \rule[-1ex]{0pt}{0pt} & \\
\hline
\end{array}

Show Answers Only

f.
\(Wbest\)
\(=0.300 +0.86\times 2.02\)
\(=2.0372\)
 Show Worked Solution
Mean mark (b) 51%.
f.
\(Wbest\)
\(=0.300 +0.86\times 2.02\)
\(=2.0372\)
\(\therefore\ \text{Residual}\ =2.07-2.0372=0.0328\)
♦ Mean mark (f) 48%.
♦ Mean mark (g)(i) 47%.
♦ Mean mark (g)(ii) 40%.
♦ Mean mark (h) 50%.
The boxplot below displays the distribution of all gold medal-winning heights for the women's high jump, \(\textit{Wgold}\), in metres, for the 19 Olympic Games held from 1948 to 2020. --- 2 WORK AREA LINES (style=lined) --- --- 1 WORK AREA LINES (style=lined) --- --- 3 WORK AREA LINES (style=lined) --- --- 2 WORK AREA LINES (style=lined) ---

