The probability of winning a game is 0.25
The probability of winning a game is independent of winning any other game.
If Ben plays 10 games, the probability that he will win exactly four rimes is closest to
- 0.1460
- 0.2241
- 0.9219
- 0.0781
- 0.7759
Aussie Maths & Science Teachers: Save your time with SmarterEd
The probability of winning a game is 0.25
The probability of winning a game is independent of winning any other game.
If Ben plays 10 games, the probability that he will win exactly four rimes is closest to
The graph of `y = log_e(x) + log_e(2x)`, where `x > 0`, is identical, over the same domain, to the graph of
--- 5 WORK AREA LINES (style=lined) ---
--- 8 WORK AREA LINES (style=lined) ---
A company produces a particular type of light globe called Shiny. The company claims that the lifetime of these globes is normally distributed with a mean of 200 weeks and it is known that the standard deviation of the lifetime of Shiny globes is 10 weeks. Customers have complained, saying Shiny globes were lasting less than the claimed 200 weeks. It was decided to investigate the complaints. A random sample of 36 Shiny globes was tested and it was found that the mean lifetime of the sample was 195 weeks.
Use `text(Pr)(-1.96 < Z < 1.96) = 0.95` and `text(Pr)(-3 < Z < 3) = 0.9973` to answer the following questions.
--- 1 WORK AREA LINES (style=lined) ---
--- 4 WORK AREA LINES (style=lined) ---
--- 3 WORK AREA LINES (style=lined) ---
--- 3 WORK AREA LINES (style=lined) ---
Evaluate `int_0^1 (2x + 1)/(x^2 + 1)\ dx`. (3 marks)
The net force acting on a body of mass 10 kg is `underset~F = 5underset~i + 12underset~j` newtons.
--- 3 WORK AREA LINES (style=lined) ---
--- 5 WORK AREA LINES (style=lined) ---
--- 3 WORK AREA LINES (style=lined) ---
A clock displayed the time one o'clock, as shown on the diagram below.

The angle, `theta`, between the small hand and the large hand is
If matrix `M = [(3,2), (8,9), (13,7)]` , then its transpose, `M^T` , is
| A. `[(2,3), (9,8), (7,13)]` | B. `[(2,9,7), (3,8,13)]` | |
| C. `[(7,9,2), (13,8,3)]` | D. `[(3,8,13), (2,9,7)]` | |
| E. `[(13,8,3), (7,9,2)]` |
The following recurrence relation can generate a sequence of numbers.
`L_0 = 37 , \ L_{n+1} = L_n + C`
The value of `L_2` is 25.
The value of `C` is
The percentaged segmented bar chart below shows the age (under 55 years, 55 years and over) of visitors at a travel convention, segmented by preferred travel destination (domestic, international).

Part 1
The variables age (under 55 years, 55 years and over) and preferred travel destination (domestic, international) are
Part 2
The data displayed in the percentaged segmented bar chart supports the contention that there is an association between preferred travel destination and age because
Part 3
The results could also be summarised in a two-way frequency table.
Which one of the following frequency tables could match the pecentaged segmented bar chart?


`text(Part 1)`
`text{Preferred travel destination → categorical (nominal) variable}`
`text{Age → categorical (ordinal) variable}`
`=> A`
`text(Part 2)`
`text(Only option)\ D\ text(highlights a change in preference for domestic travel)`
`text(between the two age categories.)`
`=>D`
`text(Part 3)`
`text(Converting the frequency table data into percentages,)`
`text(consider option)\ A:`

`91/140 xx 100 = 65text(%),\ \ 49/140 xx 100 = 35text(%)`
`90/200 xx 100 = 45text(%), \ \ 110/200 xx 100 = 55text(%)`
`=> A`
Consider the function `g: R -> R, \ g(x) = 2sin(2x).`
--- 2 WORK AREA LINES (style=lined) ---
--- 1 WORK AREA LINES (style=lined) ---
--- 6 WORK AREA LINES (style=lined) ---
Let `f^{′}(x) = x^3 + x`.
Find `f(x)` given that `f(1) = 2`. (2 marks)
Differentiate `y = 2e^(-3x)` with respect to `x`. (1 mark)
--- 3 WORK AREA LINES (style=lined) ---
An object of mass 5 kg is on a slope that is inclined at an angle of 60° to the horizontal. The acceleration due to gravity is `g\ text(m s)^(-2)` and the velocity of the object down the slope is `v\ text(m s)^(-1)`.
As well as the force due to gravity, the object is acted on by two forces, one of magnitude `2v` newtons and one of magnitude `2v^2` newtons, both acting up the slope.
--- 8 WORK AREA LINES (style=lined) ---
--- 6 WORK AREA LINES (style=lined) ---
i.

| `F_s` | `=\ text(force down slope)` |
| `= 5g cos30 – 2v^2 – 2v` | |
| `= 5g · sqrt3/2 – 2v^2 – 2v` | |
| `= (5sqrt3)/2 g – 2v^2 – 2v` |
ii. `text(Constant speed occurs if)\ \ a = 0`
`F_s = ma = 0`
| `2v^2 + 2v – (5sqrt3)/2 xx 10` | `= 0` |
| `2v^2 + 2v – 25sqrt3` | `= 0` |
| `v` | `= (-2 + sqrt(2^2 + 4 · 2 · 25sqrt3))/(2 xx 2)` |
| `= (-2 + sqrt(4 + 200sqrt3))/4` | |
| `= (-1 + sqrt(1 + 50 sqrt3))/2` | |
| `= 4.179…` | |
| `= 4.2\ \ text(ms)^-1\ text{(1 d.p.)}` |
--- 8 WORK AREA LINES (style=lined) ---
--- 8 WORK AREA LINES (style=lined) ---
--- 6 WORK AREA LINES (style=lined) ---
Region `A` is bounded by `y = 1` and `x^2 + y^2 = 1` between `x = 0` and `x = 1`.
Region `B` is bounded by `y = 1` and `y = ln x` between `x = 1` and `x = e`.

The volume of the solid created when the region between the curve `y = f(x)` and the `x`-axis, between `x = a` and `x = b`, is rotated about the `x`-axis is given by `V = pi int_a^b [f(x)]^2\ dx`.
The volume of the solid of revolution formed when region `A` is rotated about the `x`-axis is `V_A`.
The volume of the solid of revolution formed when region `B` is rotated about the `x`-axis is `V_B`.
Using part (i), or otherwise, show that the ratio `V_A : V_B` is `1:3`. (4 marks)
--- 8 WORK AREA LINES (style=lined) ---
The diagram shows the pyramid `ABCDS` where `ABCD` is a square. The diagonals of the square bisect each other at `H`.

--- 5 WORK AREA LINES (style=lined) ---
Let `G` be the point such that `overset->{GA} + overset->{GB} + overset->{GC} + overset->{GD} + overset->{GS} = underset~0`.
--- 8 WORK AREA LINES (style=lined) ---
--- 5 WORK AREA LINES (style=lined) ---
Two lines are given by `text(r)_1 = ((-2),(1),(3)) + lambda((1),(0),(2))` and `text(r)_2 = ((4),(-2),(q)) + mu ((p),(3),(-1))` , where `p` and `q` are real numbers. These lines intersect and are perpendicular.
Find the values of `p` and `q`. (3 marks)
--- 8 WORK AREA LINES (style=lined) ---
Consider Statement A.
Statement A: ‘If `n^2` is even, then `n` is even.’
--- 2 WORK AREA LINES (style=lined) ---
--- 4 WORK AREA LINES (style=lined) ---
Find `int {2x + 3}/{x^2 + 2x + 2} dx`. (3 marks)
Express `{3x^2-5}/{(x-2)(x^2 + x + 1)}` as a sum of partial fractions over `RR`. (3 marks)
The complex numbers `z = 5 + i` and `w = 2 − 4 i` are given.
Find `bar z/{w}`, giving your answer in Cartesian form. (2 marks)
--- 4 WORK AREA LINES (style=lined) ---
--- 5 WORK AREA LINES (style=lined) ---
--- 3 WORK AREA LINES (style=lined) ---
Consider the statement:
‘For all integers `n`, if `n` is a multiple of 6, then `n` is a multiple of 2’.
Which of the following is the contrapositive of the statement?
Evaluate `int_0^sqrt3 1/(sqrt(4 - x^2))\ dx`. (2 marks)
Use the substitution `u = x + 1` to find `int xsqrt(x + 1)\ dx`. (3 marks)
Expand and simplify `(2a - b)^4`. (2 marks)
Consider the differential equation `(dy)/(dx) = x/y`.
Which of the following equations best represents this relationship between `x` and `y`?
What is the remainder when `P(x) = -x^3-2x^2-3x + 8` is divided by `x + 2`?
Given that `overset->(OP) = ((-3),(1))` and `overset->(OQ) = ((2),(5))`, what is `overset->(PQ)`?
People are placed into groups to complete a puzzle. There are 9 different groups.
The table shows the number of people in each group and the amount of time, in minutes, for each group to complete the puzzle.
\begin{array} {|l|c|c|c|c|c|c|c|c|c|}
\hline
\rule{0pt}{2.5ex} \textit{Number of people} \rule[-1ex]{0pt}{0pt} & 2 & 2 & 3 & 5 & 5 & 7 & 7 & 7 & 8 \\
\hline
\rule{0pt}{2.5ex} \textit{Time taken (min)} \rule[-1ex]{0pt}{0pt} & 28 & 30 & 26 & 19 & 21 & 12 & 13 & 11 & 8 \\
\hline
\end{array}

--- 3 WORK AREA LINES (style=lined) ---
--- 1 WORK AREA LINES (style=lined) ---


a.
b.
c. `text(Form: linear)`
`text{Direction: negative}`
`text{Strength: strong}`
| d. | `text{Mean time (7 people)}` | `= (12 + 13 + 11)/3` |
| `= 12\ text(minutes)` |
For a sample of 17 inland towns in Australia, the height above sea level, `x` (metres), and the average maximum daily temperature, `y` (°C), were recorded.
The graph shows the data as well as a regression line.

The equation of the regression line is `y = 29.2 − 0.011x`.
The correlation coefficient is `r = –0.494`.
--- 1 WORK AREA LINES (style=lined) ---
--- 5 WORK AREA LINES (style=lined) ---

--- 3 WORK AREA LINES (style=lined) ---
A right-angled triangle `XYZ` is cut out from a semicircle with centre `O`. The length of the diameter `XZ` is 16 cm and `angle YXZ` = 30°, as shown on the diagram.

--- 4 WORK AREA LINES (style=lined) ---
--- 6 WORK AREA LINES (style=lined) ---
A population, `P`, is to be modelled using the function `P = 2000 (1.2)^t`, where `t` is the time in years.
--- 2 WORK AREA LINES (style=lined) ---
--- 2 WORK AREA LINES (style=lined) ---

--- 0 WORK AREA LINES (style=lined) ---
a. `text{Initial population occurs when}\ \ t = 0:`
`P= 2000 (1.2)^0= 2000`
b. `text{Find} \ P \ text{when} \ \ t = 5: `
| `P` | `= 2000 (1.2)^5` | |
| `= 4976.64` | ||
| `= 4977 \ text{(nearest whole)}` |
c.

The first term of an arithmetic sequence is 5. The sum of the first 43 terms is 2021.
What is the common difference of the sequence? (2 marks)
--- 4 WORK AREA LINES (style=lined) ---
Solve `x+(x-1)/2 = 9`. (2 marks)
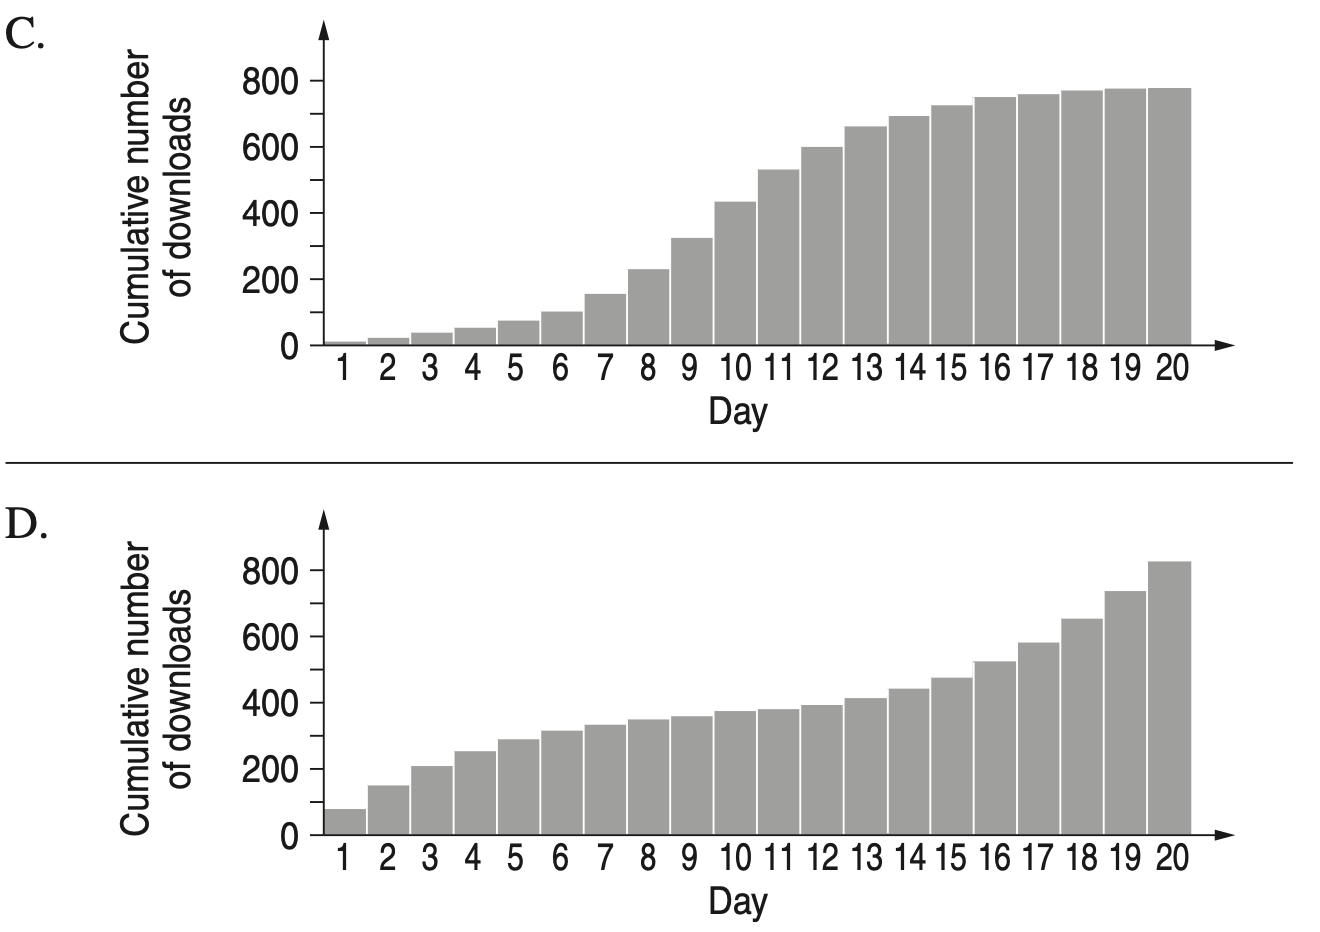
The number of downloads of a song on each of twenty consecutive days is shown in the following graph.

Which of the following graphs best shows the cumulative number of downloads up to and including each day?

The stem-and-leaf plot shows the number of goals scored by a team in each of ten netball games.

What is the mode of this dataset?
Which of the following is equivalent to `sin^2 5x` ?
Adam purchased some office furniture five years ago. It depreciated by $2300 each year based on the straight-line method of depreciation. The salvage value of the furniture is now $7500.
Find the initial value of the office furniture. (2 marks)
--- 4 WORK AREA LINES (style=lined) ---
The fuel consumption for a car is 6.7 litres/100 km. On a road trip, the car travels a distance of 1560 km and the fuel cost is $1.45 per litre.
What is the total fuel cost for the trip? (2 marks)
Three years ago an appliance was valued at $2467. Its value has depreciated by 15% each year, based on the declining-balance method.
What is the salvage value today, to the nearest dollar?
Amos turns the arrow on his spinner.

Which shape is the arrow most likely to stop on?
 |
||
|
|
|
|
Charles was given these notes on his birthday.

In total, how much did Charles receive?
| $ |
An offer to buy the Westmall shopping centre was made by a competitor.
One market research project suggested that if the Westmall shopping centre were sold, each of the three centres (Westmall, Grandmall and Eastmall) would continue to have regular shoppers but would attract and lose shoppers on a weekly basis.
Let `S_n` be the state matrix that shows the expected number of shoppers at each of the three centres `n` weeks after Westmall is sold.
A matrix recurrence relation that generates values of `S_n` is
`S_(n+1) = T xx S_n`
`{:(quad qquad qquad qquad qquad qquad qquad qquad text(this week)),(qquad qquad qquad qquad qquad qquad quad \ W qquad quad G qquad quad \ E),(text(where)\ T = [(quad 0.80, 0.09, 0.10),(quad 0.12, 0.79, 0.10),(quad 0.08, 0.12, 0.80)]{:(W),(G),(E):}\ text(next week,) qquad qquad S_0 = [(250\ 000), (230\ 000), (200\ 000)]{:(W),(G),(E):}):}`
--- 3 WORK AREA LINES (style=lined) ---
Using values from the recurrence relation above, the graph below shows the expected number of shoppers at Westmall, Grandmall and Eastmall for each of the 10 weeks after Westmall is sold.

--- 2 WORK AREA LINES (style=lined) ---
--- 4 WORK AREA LINES (style=lined) ---
--- 3 WORK AREA LINES (style=lined) ---
The three major shopping centres in a large city, Eastmall `(E)`, Grandmall `(G)` and Westmall `(W)`, are owned by the same company.
The total number of shoppers at each of the centres at 1.00 pm on a typical day is shown in matrix `V`.
`qquad qquad qquad {:(qquad qquad qquad \ E qquad qquad G qquad qquad \ W),(V = [(2300,2700,2200)]):}`
Each of these centres has three major shopping areas: food `(F)`, clothing `(C)` and merchandise `(M)`.
The proportion of shoppers in each of these three areas at 1.00 pm on a typical day is the same at all three centres and is given in matrix `P` below
`qquad qquad qquad P = [(0.48), (0.27), (0.25)] {:(F),(C),(M):}
If this were to happen, how many shoppers, in total, would be at Grandmall at this time? (1 mark)
--- 0 WORK AREA LINES (style=lined) ---
--- 2 WORK AREA LINES (style=lined) ---
The average daily amount spent, in dollars, by each shopper in each of the three areas at Grandmall in 2019 is shown in matrix `A_2019` below.
`qquad qquad A_2019 = [(21.30), (34.00), (14.70)] {:(F),(C),(M):}`
On one particular day, 135 shoppers spent the average daily amount on food, 143 shoppers spent the average daily amount on clothing and 131 shoppers spent the average daily amount on merchandise.
--- 3 WORK AREA LINES (style=lined) ---
| Area | food | clothing | merchandise |
| Expected change | increase by 5% | decrease by 15% | decrease by 1% |
The average daily amount, in dollars, expected to be spent in each area in 2020 can be determined by forming the matrix product
--- 3 WORK AREA LINES (style=lined) ---
Samuel has a reducing balance loan. The first five lines of the amortisation table for Samuel’s loan are shown below. Interest is calculated monthly and Samuel makes monthly payments of $1600. Interest is charged on this loan at the rate of 3.6% per annum. --- 3 WORK AREA LINES (style=lined) --- --- 4 WORK AREA LINES (style=lined) --- --- 3 WORK AREA LINES (style=lined) ---

Calculate the balance of the loan after payment number 4 is made.
The table below shows the mean age, in years, and the mean height, in centimetres, of 648 women from seven different age groups.

--- 1 WORK AREA LINES (style=lined) ---
A scatterplot displaying this data shows an association between the mean height and the mean age of these women. In an initial analysis of the data, a line is fitted to the data by eye, as shown.
--- 1 WORK AREA LINES (style=lined) ---
Using these two points, determine the equation of this line. Write the values of the intercept and the slope in the appropriate boxes below.
Round your answers to three significant figures. (1 mark)
--- 0 WORK AREA LINES (style=lined) ---
| mean height = |
|
+ |
|
× mean age |
The associated residual plot that was generated is shown below.

The residual plot indicates that the association between the mean height and the mean age of women is non-linear.
The data presented in the table in part a is repeated below. It can be linearised by applying an appropriate transformation to the variable mean age.

Apply an appropriate transformation to the variable mean age to linearise the data. Fit a least squares line to the transformed data and write its equation below.
Round the values of the intercept and the slope to four significant figures. (2 marks)
--- 5 WORK AREA LINES (style=lined) ---
The age, in years, body density, in kilograms per litre, and weight, in kilograms, of a sample of 12 men aged 23 to 25 years are shown in the table below.
| Age (years) |
Body density |
Weight |
|
| 23 | 1.07 | 70.1 | |
| 23 | 1.07 | 90.4 | |
| 23 | 1.08 | 73.2 | |
| 23 | 1.08 | 85.0 | |
| 24 | 1.03 | 84.3 | |
| 24 | 1.05 | 95.6 | |
| 24 | 1.07 | 71.7 | |
| 24 | 1.06 | 95.0 | |
| 25 | 1.07 | 80.2 | |
| 25 | 1.09 | 87.4 | |
| 25 | 1.02 | 94.9 | |
| 25 | 1.09 | 65.3 |
--- 2 WORK AREA LINES (style=lined) ---
--- 2 WORK AREA LINES (style=lined) ---
--- 1 WORK AREA LINES (style=lined) ---
--- 1 WORK AREA LINES (style=lined) ---
--- 2 WORK AREA LINES (style=lined) ---
In a study of the association between BMI and neck size, 250 men were grouped by neck size (below average, average and above average) and their BMI recorded.
Five-number summaries describing the distribution of BMI for each group are displayed in the table below along with the group size.
The associated boxplots are shown below the table.


--- 2 WORK AREA LINES (style=lined) ---
--- 2 WORK AREA LINES (style=lined) ---
--- 3 WORK AREA LINES (style=lined) ---
--- 4 WORK AREA LINES (style=lined) ---
Body mass index (BMI), in kilograms per square metre, was recorded for a sample of 32 men and displayed in the ordered stem plot below.

--- 1 WORK AREA LINES (style=lined) ---
--- 3 WORK AREA LINES (style=lined) ---
--- 2 WORK AREA LINES (style=lined) ---
Nancy is making a rectangular prism using plastic balls and sticks.

How many more sticks does Nancy need to finish the rectangular prism?
| 1 | 2 | 4 | 5 | 6 |
|
|
|
|
|
|
`text{5 more sticks are needed.}`

Heath is making a square pyramid using plastic balls and sticks.

How many more sticks does Heath need to finish the square pyramid?
| 1 | 2 | 3 | 4 | 5 |
|
|
|
|
|
|
`text{3 more sticks are needed.}`

Jordan lives in Perth and receives 10 cents for every glass bottle she recycles at the depot.
Jordan takes 33 glass bottles to the depot.
How much money will she receive?
| 33 cents | $3.30 | $33.00 | $333 |
|
|
|
|
|
Jardine lives in Adelaide and receives 5 cents for every plastic bottle he delivers to the recycling depot.
Jardine delivers 18 plastic bottles.
How much money will he receive?
| $900 | $90 | $9.00 | $0.90 |
|
|
|
|
|
Solve the equation `3^(– 4x) = 9^(6 - x)` for `x`. (2 marks)
Solve the equation `log_2(x-1) = 8` for `x`. (2 marks)
Let `f(x) = x^2e^(−x)`.

Let `g(x) = x^n e^(−x)`, where `n ∈ Z`.


a. `f′(x) = 2xe^(−x) – x^2e^(−x)`
`text(SP’s when)\ \ f′(x) = 0:`
| `x^2e^(−x)` | `= 2xe^(−x)` |
| `x` | `= 2\ \ text(or)\ \ 0` |
`f(0) = 0; \ f(2) = 4e^(−2)`
`:. text(SP’s at)\ \ (0, 0) and (2, 4e^(−2))`
b. `text(As)\ \ x -> ∞, \ f(x) -> 0^+`
`:. text(Horizontal asymptote at)\ \ y = 0`
| c. | |
`text(POI when)\ \ f″(x) = 0`
`:. text(POI’s:)\ (0.59, 0.19), \ (3.41, 0.38)`
d. `g′(x) = x^(n – 1) e^(−x)(n – x)`
`g″(x) = x^(n – 2) e^(−x)(x^2 – 2xn + n^2 – n)`
e.i. `text(Solve:)\ \ x^2 – 2xn + n^2 – n = 0`
`x = n ± sqrtn`
| e.ii. | |
Justin owns a collection of action figures which is more than 674 action figures and less than 764.
Which of these numbers could represent the number of action figures that Justin owns?
| 792 | 724 | 648 | 772 |
|
|
|
|
|


