SmarterEd

Aussie Maths & Science Teachers: Save your time with SmarterEd

  • Login
  • Get Help
  • About

CHEMISTRY, M7 2016 VCE 12 MC

A condensation reaction involving 200 glucose molecules, \(\ce{C6H12O6}\), results in a polysaccharide. The molar mass, in g mol\(^{-1}\), of the polysaccharide is

  1. 36 000
  2. 35 982
  3. 32 418
  4. 32 400
Show Answers Only

\(C\)

Show Worked Solution
  • 200 \(\ce{C6H12O6}\) molecules react to form a polysaccharide
  • 199 \(\ce{H2O}\) molecules are released in this condensation polymerisation
  •    \(\ce{MM(C6H12O6) = 180.0\ \text{g mol}^{-1} }\)
  •    \(\ce{MM(H2O) = 18.0\ \text{g mol}^{-1} }\)
  •    \(\ce{MM(\text{polysaccharide})}= 200 \times 180.0-199 \times 18.0= 32\ 418\ \text{g mol}^{-1}\)

\(\Rightarrow C\)

Filed Under: Polymers Tagged With: Band 4, smc-3681-20-Condensation Polymers

PHYSICS, M1 2013 HSC 22

This set of data was obtained from a motion investigation to determine the acceleration due to gravity on a planet other than Earth.
 

Time (s) Vertical velocity (m s\(^{-1}\))
0.60 0.02
1.00 0.09
1.20 0.12
1.40 0.17
1.80 0.23

 
Plot the data from the table, and then calculate the acceleration.  (3 marks)
 

--- 5 WORK AREA LINES (style=lined) ---

Show Only

\(0.182\ \text{ms}^{-2}\)

Show Worked Solution

\(\text{Acceleration}\) \(=\dfrac{0.2-0.04}{1.6-0.72}\)  
  \(=\dfrac{0.16}{0.88}\)  
  \(=0.182\ \text{ms}^{-2}\)  

Filed Under: Motion in a Straight Line Tagged With: Band 4, smc-4273-30-Acceleration

CHEMISTRY, M2 2018 VCE 1

Industrially, ethanol, \(\ce{C2H5OH} \), is made by either of two methods.

One method uses ethene, \(\ce{C2H4} \), which is derived from crude oil.

The other method uses a sugar, such as sucrose, \(\ce{C12H22O11}\), and yeast, in aqueous solution.

The production of  \(\ce{C2H5OH}\)  from  \(\ce{C12H22O11}\)  and yeast proceeds according to the equation

\( \ce{C12H22O11(aq) + H2O(l) \rightarrow 4C2H5OH(aq) + 4CO2(g)} \)

  1. Determine the mass, in grams, of pure \(\ce{C2H5OH}\) that would be produced from 1.250 kg of \(\ce{C12H22O11}\) dissolved in water.

        \(\ce{MM(C12H22O11) = 342\ \text{g mol}^{-1} }\)   (2 marks)

--- 4 WORK AREA LINES (style=lined) ---

  1. i. Complete the reaction by writing the formula for the reactant in the box provided below.

\(\ce{C2H4(g) + \text{insert box}  ->[\text{catalyst}] C2H5OH(g) }\)   (1 mark)

--- 5 WORK AREA LINES (style=lined) ---

  1. ii. Classify this type of reaction.   (1 mark)

--- 5 WORK AREA LINES (style=lined) ---

Show Answers Only
  1. 673 grams
  2. i.  \(\ce{H2O(g)}\)
  3. ii. Addition reaction.
Show Worked Solution

a.   \(\ce{n(C12H22O11) = \dfrac{1250}{342} = 3.65\ \text{mol}} \)

\(\ce{n(C2H5OH) = 4 \times 3.65 = 14.6\ \text{mol}} \)

\(\ce{MM(C2H5OH) = 2 \times 12.01 + 6 \times 1.008 + 16 = 46.07}\)

\(\ce{m(C2H5OH) = 14.6 \times 46.07 = 673\ \text{g  (3 sig fig)}} \)
 

b.i.  \(\ce{C2H4(g) + H2O(g)  ->[\text{catalyst}] C2H5OH(g) }\)
 

b.ii.  Addition reaction.

Filed Under: Mole Concept Tagged With: Band 4

PHYSICS, M3 2013 HSC 33b

Outline a first-hand investigation to demonstrate the transfer of light by optical fibres.   (2 marks)

--- 6 WORK AREA LINES (style=lined) ---

Show Answers Only
  • Using a laser beam or other light source, shine the light into a glass rod at an angle at an angle greater than the critical angle.
  • The light beam can then be seen to reflect off either side of the glass rod as it travels down the line of the rod.
  • This is called total internal reflection (TIR) and demonstrates effectively how light travels through a optical fibre, As seen in the diagram below.


Show Worked Solution

  • Using a laser beam or other light source, shine the light into a glass rod at an angle at an angle greater than the critical angle.
  • The light beam can then be seen to reflect off either side of the glass rod as it travels down the line of the rod.
  • This is called total internal reflection (TIR) and demonstrates effectively how light travels through a optical fibre, As seen in the diagram below.


Filed Under: Ray Model of Light Tagged With: Band 4, smc-4281-20-Snell's Law and TIR

PHYSICS, M4 2013 HSC 26a

An electric field is produced between two charged parallel plates, \(M\) and \(N\).
 

The plates, \(M\) and \(N\), are 1.0 cm apart and have an electric field of 15 V m\(^{-1}\).

Calculate the potential difference between the plates.  (2 marks)

--- 4 WORK AREA LINES (style=lined) ---

Show Only

\(0.15 \text{ V}\) 

Show Worked Solution

\(\text{Convert units:  1 cm = 0.01 m}\).

\(E\) \(=\dfrac{V}{d}\)  
\(V\) \(=Ed\)  
  \(=15 \times 0.01\)  
  \(=0.15 \text{ V}\)  

Filed Under: Electrostatics Tagged With: Band 4, smc-4283-10-Electric fields

CHEMISTRY, M7 2023 HSC 15 MC

The table gives the heat of combustion of three different alcohols at 25°C.
 

\( Alcohol \) \( Heat \ of \ combustion \)
\( \text{(Kj  g} ^{-1}) \)
\( \text{Methanol} \) \(22.68\)
\( \text{Ethanol} \) \(29.67\)
\( \text{Butan-1-ol} \) \(36.11\)
 
Which of the following gives the best approximation for the molar heat of combustion of propan-1-ol, expressed in kJ g\(^{-1} \)?
 
  1. \(\left(\dfrac{22.68+29.67+36.11}{3}\right)\)
  2. \(\left(\dfrac{29.67+36.11}{2}\right)\)
  3. \(\left(\dfrac{22.68+29.67}{2}\right)\)
  4. \(\left(\dfrac{3 \times 36.11}{4}\right)\)
Show Answers Only

\(B\)

Show Worked Solution
  • The boiling point of straight-chained alcohols increases with their chain length.
  • Therefore the boiling point of Propan-1-ol will exist between Ethanol and Butan-1-ol

\(\Rightarrow B\)

Filed Under: Alcohols Tagged With: Band 4, smc-3679-10-Combustion

CHEMISTRY, M8 2023 HSC 13 MC

The table shows four separate tests used to identify a dilute, aqueous sample of a compound.

 \begin{array} {|c|l|l|}
\hline
\rule{0pt}{2.5ex} \textbf{Test Number} \rule[-1ex]{0pt}{0pt} & \quad \quad \quad \quad  \quad \textbf{Test}  & \quad \quad \quad \textbf{Observation}\\
\hline
\rule{0pt}{2.5ex} 1\rule[-1ex]{0pt}{0pt} & \text{Test with Red litmus} & \text{Stays red}\\
\hline
\rule{0pt}{2.5ex} 2 \rule[-1ex]{0pt}{0pt} & \text{Add \( \ce{Ba}^{2+} \) ions to a sample} & \text{White precipitate formed}\\
\hline
\rule{0pt}{2.5ex} 3 \rule[-1ex]{0pt}{0pt} & \text{Add \( \ce{OH}^{-} \) ions to a sample}& \text{Brown precipitate formed} \\
\hline
\rule{0pt}{2.5ex} 4 \rule[-1ex]{0pt}{0pt} & \text{Add \( \ce{Cl}^{-}\) ions to a sample}& \text{White precipitate formed}\\
\hline
\end{array}

Which compound would produce the observations shown?

  1. Silver sulfate
  2. Lead(\(\text{II}\)) acetate
  3. Iron(\(\text{II}\)) bromide
  4. Magnesium carbonate
Show Answers Only

\(A\)

Show Worked Solution

\(\Rightarrow A\)

Filed Under: Inorganic Substances Tagged With: Band 4, smc-3682-10-Tests for Ions in Solution

CHEMISTRY, M6 2023 HSC 11 MC

An indicator solution was obtained by boiling a flower in water.
 

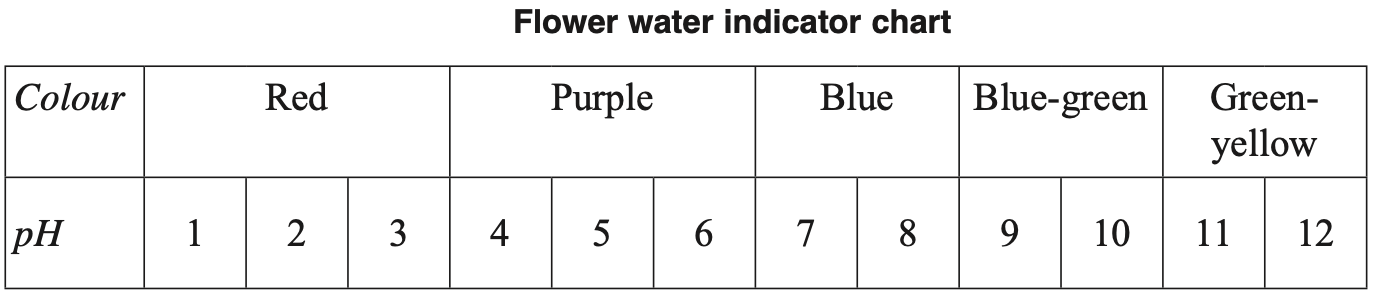
Two solutions were tested with this indicator.

Which row of the table correctly identifies the colour of each solution?
 

  \( \ce{H2SO4} \ (1  \ × \  10^{-5} \ \text{mol  L}^{-1}) \) \( \ce{NaOH}  \ (5 \ × \  10^{-5} \ \text{mol  L}^{-1}) \)
\(\text{A.}\) \( \text{Red} \) \( \text{Green-yellow} \)
\(\text{B.}\) \( \text{Red} \) \( \text{Blue-green} \)
\(\text{C.}\) \( \text{Purple} \) \( \text{Blue-green} \)
\(\text{D.}\) \( \text{Purple} \) \( \text{Green-yellow} \)
Show Answers Only

\(C\)

Show Worked Solution
  • pH can be calculated from the \(\ce{H2SO4}\) and \(\ce{NaOH}\) concentrations, allowing the colour of the solutions to be determined

\(\Rightarrow C\)

Filed Under: Properties of Acids and Bases Tagged With: Band 4, smc-3673-15-Indicators

CHEMISTRY, M7 2023 HSC 10 MC

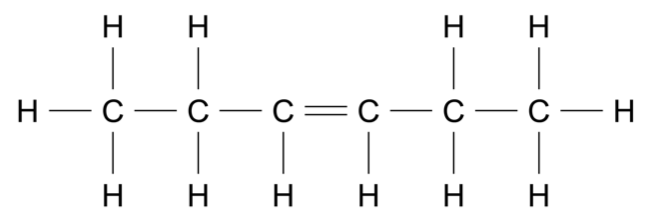
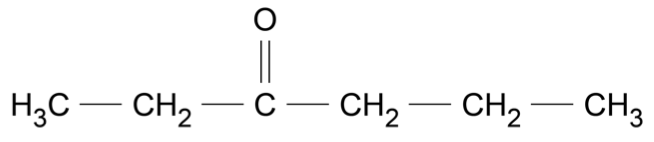
Which of the following correctly lists the compounds in order of increasing boiling point?

  1. Heptane < heptan-2-one < heptan-1-o1 < heptanoic acid
  2. Heptane < heptan-1-o1 < heptan-2-one < heptanoic acid
  3. Heptanoic acid < heptan-2-one < heptan-1-o1 < heptane
  4. Heptanoic acid < heptan-1-o1 < heptan-2-one < heptane
Show Answers Only

\(A\)

Show Worked Solution
  • Compounds with functional groups capable of hydrogen bonding have higher boiling points (due to stronger bonds, more energy is required to break)

\(\Rightarrow A\)

Filed Under: Alcohols, Hydrocarbons and Associated Reactions, Reactions of Organic Acids and Bases Tagged With: Band 4, smc-3677-30-Solubility and Boiling Point, smc-3679-50-Solubility and Boiling Point, smc-3680-30-Boiling Point and Solubility

CHEMISTRY, M6 2023 HSC 9 MC

A titration was performed using two solutions of equal concentration, producing the following titration curve.
 

Which combination of solutions does the titration curve represent?

  1. Addition of a weak base to a weak acid
  2. Addition of a weak base to a strong acid
  3. Addition of a strong acid to a weak base
  4. Addition of a strong acid to a strong base
Show Answers Only

\(C\)

Show Worked Solution
  • Weak base acts as a buffer, resisting an immediate decrease in pH upon addition of strong acid

\(\Rightarrow C\)

Filed Under: Quantitative Analysis Tagged With: Band 4, smc-3675-20-Titration Curves and Conductivity Graphs

CHEMISTRY, M5 2023 HSC 7 MC

A mixture of 0.8 mol of \( \ce{CO} \text{(g)} \) and 0.8 mol of \( \ce{H2} \text{(g)} \) was placed in a sealed 1.0 L container. The following reaction occurred.

\( \ce{CO} \text{(g)} + 2 \ce{H2} \text{(g)} \rightleftharpoons \ce{CH3} \ce{OH}\text{(g)} \)

When equilibrium was established, the mixture contained 0.5 mol of \( \ce{CO} \text{(g)} \).

What amount of \( \ce{H2} \text{(g)} \) was present at equilibrium?

  1. 0.2 mol
  2. 0.4 mol
  3. 0.6 mol
  4. 1.0 mol
Show Answers Only

\(A\)

Show Worked Solution

\( \ce{CO} \text{(g)} + 2 \ce{H2} \text{(g)} \rightleftharpoons \ce{CH3} \ce{OH}\text{(g)} \)

\begin{array} {|l|c|c|c|}
\hline  & \ce{CO(g)} & \ce{2H2(g)} & \ce{CH3OH} \\
\hline \text{Initial} & 0.8 & 0.8 & 0 \\
\hline \text{Change} & -x & -2x & +x \\
\hline \text{Equilibrium} & 0.5 & 0.2 & 0.03 \\
\hline \end{array}

\(x = 0.3\)

\(\Rightarrow A\)

Filed Under: Equilibrium Constant Tagged With: Band 4, smc-3671-20-Calcs given K(eq)

CHEMISTRY, M6 2023 HSC 5 MC

Which diagram represents the most concentrated weak acid?
  

Show Answers Only

\(D\)

Show Worked Solution
  • Weak acids will only partially dissociate in solution and concentrated acids contain a large number of ions in solution.

\(\Rightarrow D\)

Filed Under: Quantitative Analysis Tagged With: Band 4, smc-3675-40-Strong/Weak Acids

PHYSICS, M4 2013 HSC 14 MC

Two charged plates are initially separated by a distance as shown in the diagram.
 

The potential difference between the plates remains constant.

Which of the graphs best represents the change in electric field strength as the distance between the two plates is increased?


Show Only
\(B\)
Show Worked Solution
  • The electric field strength and distance vary according to the equation:
  •    \(E=\dfrac{V}{d}\)
  • Thus \(E\) and \(d\) are inversely proportionally which is depicted in \(B\).

\(\Rightarrow B\)

Filed Under: Electrostatics Tagged With: Band 4, smc-4283-10-Electric fields

PHYSICS, M3 2018 HSC 6 MC

The diagram shows a saucepan of water on an induction cooktop.
 

Which row of the table correctly identifies a property of the material used to make the saucepan and the frequency of the changing magnetic field produced by the coil?
 

  Property of saucepan      Frequency     
A.   Insulator High (50 kHz)
B. Conductor High (50 kHz)
C. Insulator Low (50 Hz)
D. Conductor Low (50 Hz)
Show Answers Only

\(B\)

Show Worked Solution
  • The saucepan needs to be able to transfer heat from the induction cooktop to the water. The heat is generated from the production of electrical currents in the saucepan, hence it needs to be a conductor.
  • The greater the frequency of the changing magnetic field in the coil correlates to a greater electrical current in the saucepan, hence it will heat up more quickly.

\(\Rightarrow B\)

Filed Under: Thermodynamics Tagged With: Band 4, smc-4282-40-Energy transfer

CHEMISTRY, M8 2023 HSC 36

An organic reaction pathway involving compounds \(\text{A, B,}\) and \(\text{C}\) is shown in the flow chart.
 

The molar mass of \(\text{A}\) is 84.156 g mol\(^{-1}\).

A chemist obtained some spectral data for the compounds as shown.
 

\( \text{Data from} \ ^{1} \text{H NMR spectrum of compound C} \)
 \( Chemical \ Shift \ \text{(ppm)} \) \( Relative \ peak \ area \) \( Splitting \ pattern \)
\(1.01\) \(3\) \(\text{Triplet}\)
\(1.05\) \(3\) \(\text{Triplet}\)
\(1.65\) \(2\) \(\text{Multiplet}\)
\(2.42\) \(2\) \(\text{Triplet}\)
\(2.46\) \(2\) \(\text{Quartet}\)
\( ^{1} \text{H NMR chemical shift data}\)
\( Type \ of \ proton \)  \(  \text{δ/ppm} \)
\( \ce{R - C\textbf{H}3,R - C\textbf{H}2 - R}\) \(0.7-1.7\)
\( \left.\begin{array}{l}\ce{\textbf{H}3C - CO - \\-C\textbf{H}2 - CO -}\end{array}\right\} \begin{aligned} & \text { (aldehydes, ketones,} \\ &\text{carboxylic acids or esters) }\end{aligned}\) \(2.0-2.6\) 
\( \ce{R - C\textbf{H}O} \) \(9.4-10.00\)
\( \ce{R - COO\textbf{H}} \) \(9.0-13.0\)
 

Identify the functional group present in each of compounds \(\text{A}\) to \(\text{C}\) and draw the structure of each compound. Justify your answer with reference to the information provided.  (9 marks) 

--- 28 WORK AREA LINES (style=lined) ---

Show Answers Only

Compound \(\text{A}\): Alkene


Compound \(\text{B}\): Secondary alcohol

Compound \(\text{C}\): Ketone


Reasoning as follows:

  • Compound \(\text{A}\) is able to undergo an addition reaction to add water across a \(\ce{C=C}\) bond  \(\Rightarrow \)  Alkene
  • Compound \(\text{B}\) is the product of the above hydration reaction and is therefore an alcohol.
  • The \(\ce{^{13}C\ NMR}\) spectrum of Compound \(\text{A}\) confirms it is an alkene (132 ppm peak corresponding to the \(\ce{C=C}\) atoms). 3 spectrum peaks indicate 3 carbon environments. The molar mass of compound \(\text{A}\) is 84.156 g mol\(^{-1}\) which suggests symmetry within the molecule.
  • The Infrared Spectrum of Compound \(\text{B}\) has a broad peak at approximately 3400 cm\(^{-1}\). This indicates the presence of an hydroxyl group and confirms \(\text{B}\) is an alcohol.
  • Compound \(\text{C}\) is produced by the oxidation of Compound \(\text{B}\) with acidified potassium permanganate.
  • Compound \(\text{C}\) is a carboxylic acid if \(\text{B}\) is a primary alcohol or a ketone if \(\text{B}\) is a secondary alcohol.
  • Since the \(\ce{^{1}H NMR}\) spectrum of \(\text{C}\) does not show any peaks between 9.0 − 13.0 ppm, it cannot be a carboxylic acid. Compound \(\text{C}\) is therefore a ketone and Compound \(\text{B}\) is a secondary alcohol.
  • The \(\ce{^{1}H NMR}\) spectrum shows 5 peaks \(\Rightarrow \) 5 hydrogen environments.
  • Chemical shift and splitting patterns information indicate:
  • 1.01 ppm – 1.05 ppm: \(\ce{CH3}\) (next to a \(\ce{CH2}\))
  •   1.65 ppm: \(\ce{CH2}\) (with multiple neighbouring hydrogens)
  •   2.42 ppm: \(\ce{CH2}\) (next to the ketone \(\ce{C=O}\) and a \(\ce{CH2}\))
  •   2.46 ppm: \(\ce{CH2}\) (next to the ketone \(\ce{C=O}\) and a \(\ce{CH3}\))
Show Worked Solution

Compound \(\text{A}\): Alkene


Compound \(\text{B}\): Secondary alcohol

Compound \(\text{C}\): Ketone


Reasoning as follows:

  • Compound \(\text{A}\) is able to undergo an addition reaction to add water across a \(\ce{C=C}\) bond  \(\Rightarrow \)  Alkene
  • Compound \(\text{B}\) is the product of the above hydration reaction and is therefore an alcohol.
  • The \(\ce{^{13}C\ NMR}\) spectrum of Compound \(\text{A}\) confirms it is an alkene (132 ppm peak corresponding to the \(\ce{C=C}\) atoms). 3 spectrum peaks indicate 3 carbon environments. The molar mass of compound \(\text{A}\) is 84.156 g mol\(^{-1}\) which suggests symmetry within the molecule.
  • The Infrared Spectrum of Compound \(\text{B}\) has a broad peak at approximately 3400 cm\(^{-1}\). This indicates the presence of an hydroxyl group and confirms \(\text{B}\) is an alcohol.
  • Compound \(\text{C}\) is produced by the oxidation of Compound \(\text{B}\) with acidified potassium permanganate.
  • Compound \(\text{C}\) is a carboxylic acid if \(\text{B}\) is a primary alcohol or a ketone if \(\text{B}\) is a secondary alcohol.
  • Since the \(\ce{^{1}H NMR}\) spectrum of \(\text{C}\) does not show any peaks between 9.0 − 13.0 ppm, it cannot be a carboxylic acid. Compound \(\text{C}\) is therefore a ketone and Compound \(\text{B}\) is a secondary alcohol.
  • The \(\ce{^{1}H NMR}\) spectrum shows 5 peaks \(\Rightarrow \) 5 hydrogen environments.
  • Chemical shift and splitting patterns information indicate:
  • 1.01 ppm – 1.05 ppm: \(\ce{CH3}\) (next to a \(\ce{CH2}\))
  •   1.65 ppm: \(\ce{CH2}\) (with multiple neighbouring hydrogens)
  •   2.42 ppm: \(\ce{CH2}\) (next to the ketone \(\ce{C=O}\) and a \(\ce{CH2}\))
  •   2.46 ppm: \(\ce{CH2}\) (next to the ketone \(\ce{C=O}\) and a \(\ce{CH3}\))

Filed Under: Organic Substances Tagged With: Band 4, Band 5, Band 6, smc-3683-10-C NMR, smc-3683-20-H NMR, smc-3683-50-Combining Techniques, smc-3683-55-C=C Bonds, smc-3683-60-Hydroxyl Group, smc-3683-70-Carboxylic Acid Group

CHEMISTRY, M8 2023 HSC 2 MC

The technique illustrated is used to analyse chemical substances in a sample.
 

What is the technique shown?

  1. Flame test
  2. Mass spectrometry
  3. Atomic absorption spectroscopy
  4. Ultraviolet-visible spectrophotometry
Show Answers Only

\(C\)

Show Worked Solution

By elimination:

  • Although a flame test uses a flame to analyse chemical samples, it does not require a detector, prism, lamp or lens. Hence it is not the analytical method being demonstrated in the above diagram (eliminate A).
  • Mass Spectroscopy is used for organic compounds and requires an electromagnet which is not present in the above diagram (eliminate B).
  • Atomic Absorption Spectroscopy (used for inorganic compounds) is based on the idea that atoms can absorb light at a specific unique wavelength. The above image demonstrates this.
  • Ultraviolet-visible Spectrophotometry: although this uses the same principle as AAS to detect sample concentration, Ultraviolet-visible Spectrophotometry uses a different wavelength of light and requires a different apparatus to the one in the diagram above (eliminate D).

\(\Rightarrow C\)

Filed Under: Inorganic Substances Tagged With: Band 4, smc-3682-60-Colourimetry UV-Vis and AAS

CHEMISTRY, M5 2023 HSC 37

When performing industrial reductions with \(\mathrm{CO}(\mathrm{g})\), the following equilibrium is of great importance.

\( \ce{2CO(g) \rightleftharpoons CO2(g) + C(s) \quad \quad $K$_{e q}  = 10.00  at 1095 K } \)

A 1.00 L sealed vessel at a temperature of 1095 K contains \( \ce{CO(g)} \) at a concentration of 1.10 × 10\(^{-2}\) mol L\(^{-1}\), \(\ce{CO2(g)} \) at a concentration of 1.21 × 10\(^{-3}\) mol L\(^{-1}\), and excess solid carbon.

  1. Is the system at equilibrium? Support your answer with calculations.   (2 marks)

--- 3 WORK AREA LINES (style=lined) ---

  1. Carbon dioxide gas is added to the system above and the mixture comes to equilibrium. The equilibrium concentrations of \( \ce{CO(g)}\) and \(\ce{CO2(g)} \) are equal. Excess solid carbon is present and the temperature remains at 1095 K.

    Calculate the amount (in mol) of carbon dioxide added to the system.   (3 marks)

--- 14 WORK AREA LINES (style=lined) ---

Show Answers Only

a.    \(Q=\dfrac{\ce{[CO2]}}{\ce{[CO]^2}}=\dfrac{1.21 \times 10^{-3}}{(1.10 \times 10^{-2})^2}=10.0\)

\(\text{Since}\ \ Q=K_{eq},\ \text{system is in equilibrium.}\)
 

b.    \(0.143\ \text{mol} \)

Show Worked Solution

a.    \(Q=\dfrac{\ce{[CO2]}}{\ce{[CO]^2}}=\dfrac{1.21 \times 10^{-3}}{(1.10 \times 10^{-2})^2}=10.0\)

\(\text{Since}\ \ Q=K_{eq},\ \text{system is in equilibrium.}\)
 

b.    \(\ce{\text{Given}\ \ [CO]=[CO2]}, \)

\(K_{eq} =\dfrac{\ce{[CO2]}}{\ce{[CO]^2}} =\dfrac{1}{\ce{[CO]}} = 10.00\)

\(\Rightarrow \ce{[CO] = \dfrac{1}{10.00} = 0.1000 \text{mol L}^{-1}} \)

\(\Rightarrow \ce{[CO2] = 0.1000 \text{mol L}^{-1}} \)

From this point, the change in \(\ce{CO}\) and \(\ce{CO2}\) concentrations can be calculated…

♦♦♦ Mean mark (b) 24%.

\begin{array} {|l|c|c|c|}
\hline  & \ce{2CO(g)} & \ce{CO2(g)} & \ce{C(s)} \\
\hline \text{Initial} & 1.10 \times 10^{-2} &  1.21 \times 10^{-3} &  \\
\hline \text{Change} & +0.0890 & +0.0988 &  \\
\hline \text{Equilibrium} & \ \ \ 0.1000 & \ \ \ 0.1000 &  \\
\hline \end{array}

However, the change in moles of \(\ce{CO2}\) in the system consists of:

  • Change in \(\ce{CO2}\) concentration
  • Change in \(\ce{CO}\) concentration (as some of the added \(\ce{CO2}\) was converted into \(\ce{CO}\))

\(\ce{n(CO2)\ \text{required to increase}\ [CO] by 0.0988\ \text{mol}\ \ \ \text{(1 litre vessel)}}\)

\(\ce{\text{Formula ratio shows}\ \ CO2:CO = 1\ \text{mol} : 2\ \text{mol}} \)

\(\ce{n(CO2)\ \text{to add to increase}\ [CO2] = 0.0988\ \text{mol}\ \ \ \text{(1 litre vessel)}}\)

\(\ce{n(CO2)_{\text{total to add}} = 0.0988\ \text{mol} + n(CO2\ \text{to make CO)}} \)

\(\ce{n(CO2)\ \text{to add to increase}\ [CO] = \dfrac{0.0890}{2} = 0.0445\ \text{mol}}\)

\(\ce{n(CO2)_{\text{total to add}} = 0.0988 + 0.0445 = 0.143\ \text{mol}} \)

Filed Under: Equilibrium Constant Tagged With: Band 4, Band 6, smc-3671-20-Calcs given K(eq), smc-3671-35-Chemical equation given

CHEMISTRY, M5 2023 HSC 33

Gases \( \ce{A_2} \) and \( \ce{B_2} \) are placed in a closed container of variable volume, as shown.

The reaction between these substances is as follows.

\( \ce{A2(g) + 2B_2(g) \rightleftharpoons 2AB_2(g) \quad \Delta \textit{H} = -10 \text{kJ mol}^{-1}} \)

The following graph shows changes in the amounts (in mol) of these three substances over time in this container.
 

  1. Explain what is happening in this system between 6 minutes and 8 minutes.  (2 marks)

--- 4 WORK AREA LINES (style=lined) ---

  1. Explain TWO different factors that could result in the disturbance at 8 minutes.  (4 marks)

--- 8 WORK AREA LINES (style=lined) ---

Show Answers Only

a.   Between 6 and 8 minutes:

  • The system is in equilibrium.
  • The horizontal lines of each reactant in the graph indicate that the amount of reactants and products remain constant and hence the forward and reverse reactions are proceeding at the same rate.

b.    After 8 minutes \(\ce{AB2}\) is consumed, and \(\ce{A2}\) and \(\ce{B2}\) are produced. 

Factor 1:

  • An increase in temperature that decreases the equilibrium constant, \(\text{K}\).
  • In this case, the reaction quotient \(\text{Q}\) will be greater than \(\text{K}\). This will result in \(\ce{AB2}\) being consumed and \(\ce{A2}\) and \(\ce{B2}\) being produced until \(\text{Q}\) approaches \(\text{K}\) and the system reaches equilibrium again.

Factor 2:

  • Increase in volume of the container.
  • This will increase the reaction quotient \(\text{Q}\) while \(\text{K}\) stays the same. Again, this will cause \(\ce{AB2}\) to be consumed and \(\ce{A2}\) and \(\ce{B2}\) to be produced until \(\text{Q}\) approaches \(\text{K}\) and the system reaches equilibrium again.
Show Worked Solution

a.   Between 6 and 8 minutes:

  • The system is in equilibrium.
  • The horizontal lines of each reactant in the graph indicate that the amount of reactants and products remain constant and hence the forward and reverse reactions are proceeding at the same rate.

b.    After 8 minutes \(\ce{AB2}\) is consumed, and \(\ce{A2}\) and \(\ce{B2}\) are produced. 

Factor 1:

  • An increase in temperature that decreases the equilibrium constant, \(\text{K}\).
  • In this case, the reaction quotient \(\text{Q}\) will be greater than \(\text{K}\). This will result in \(\ce{AB2}\) being consumed and \(\ce{A2}\) and \(\ce{B2}\) being produced until \(\text{Q}\) approaches \(\text{K}\) and the system reaches equilibrium again.

Factor 2:

  • Increase in volume of the container.
  • This will increase the reaction quotient \(\text{Q}\) while \(\text{K}\) stays the same. Again, this will cause \(\ce{AB2}\) to be consumed and \(\ce{A2}\) and \(\ce{B2}\) to be produced until \(\text{Q}\) approaches \(\text{K}\) and the system reaches equilibrium again.

Filed Under: Factors that Affect Equilibrium, Static and Dynamic Equilibrium Tagged With: Band 4, smc-3669-10-Static/Dynamic Models, smc-3670-10-Temperature, smc-3670-35-Volume, smc-3670-60-Concentration diagrams

CHEMISTRY, M5 2023 HSC 31

Copper(\(\text{II}\)) ions \( \ce{(Cu^{2+})} \) form a complex with lactic acid \( \ce{(C3H6O3)} \), as shown in the equation.

\( \ce{Cu^{2+}(aq)} + \ce{2C3H6O3(aq)} \rightleftharpoons \Bigl[\ce{Cu(C3H6O3)2\Bigr]^{2+}(aq)} \)

This complex can be detected by measuring its absorbance at 730 nm. A series of solutions containing known concentrations of \( \Bigl[\ce{Cu(C3H6O3)_2\Big]^{2+}} \) were prepared, and their absorbances measured.
 

\( Concentration \ of \Bigl[\ce{Cu(C3H6O3)_2\Bigr]^{2+}} \) \( \text{(mol L}^{-1}) \) \( Absorbance \)
0.000 0.00
0.010 0.13
0.020 0.28
0.030 0.43
0.040 0.57
0.050 0.72
 
Two solutions containing \( \ce{Cu^{2+}} \ \text{and} \ \ce{C3H6O3} \) were mixed. The initial concentrations of each in the resulting solution are shown in the table.
 
\( Species \) \( Initial \ Concentration\)
\( (\text{mol L}^{-1}) \)
\( \ce{Cu^{2+}} \) 0.056
\( \ce{C3H6O3} \) 0.111

 
When the solution reached equilibrium, its absorbance at 730 nm was 0.66.

You may assume that under the conditions of this experiment, the only species present in the solution are those present in the equation above, and that \( \Bigl[ \ce{Cu(C3H6O3)_2\Bigr]^{2+}} \) is the only species that absorbs at 730 nm.

With the support of a line graph, calculate the equilibrium constant for the reaction.   (7 marks)
 

--- 14 WORK AREA LINES (style=lined) ---

Show Answers Only

\(K_{eq}=1.3 \times 10^4\)

Show Worked Solution

\(\text{From graph:}\)

\(\text{0.66 absorbance}\  \Rightarrow\ \ \Big[\bigl[\ce{Cu(C3H6O3)2\bigr]^{2+}\Big]} = 0.046\ \text{mol L}^{-1} \)

\begin{array} {|l|c|c|c|}
\hline  & \ce{Cu^{2+}} & \ce{2C3H6O3(aq)} & \ce{\big[Cu(C3H6O3)2\big]^{2+}(aq)} \\
\hline \text{Initial} & \ \ \ \ 0.056 & \ \ \ \ 0.111 & 0 \\
\hline \text{Change} & -0.046 & -0.092 & \ \ \ +0.046 \\
\hline \text{Equilibrium} & \ \ \ \ 0.010 & \ \ \ \ 0.019 & \ \ \ \ \ \ 0.046 \\
\hline \end{array}

\(K_{eq}=\dfrac{\ce{\Big[\big[Cu(C3H6O3)2\big]^{2+}\Big]}}{\ce{\big[Cu^{2+}\big]\big[C3H6O3\big]^2}}=\dfrac{0.046}{0.010 \times 0.019^2}=1.3 \times 10^4\)

Filed Under: Equilibrium Constant Tagged With: Band 4, Band 5, smc-3671-10-Find K(eq), smc-3671-60-Ionic solutions

CHEMISTRY, M7 2023 HSC 29

The following graph shows the solubility of some alkan-1-ols in water at 20°C.
 

Explain the relationship between the trend shown in the graph and the relevant intermolecular forces.   (3 marks)

--- 10 WORK AREA LINES (style=lined) ---

Show Answers Only
  • The graph shows a non-linear relationship with the following clear trend: as the molar mass increases, solubility decreases.
  • When molar mass increases, the chain length of a molecule increases. In alkan-1-ols this increases the length of their carbon backbone, increasing their non-polar nature (increased dispersion forces), thus solubility in polar solvents (eg: water) decreases
  • Shorter chain alcohols dissolve more readily in water. This is due to the formation of hydrogen bonds between the hydroxyl group of the alcohol and water molecules and the comparatively polar nature of the molecule compared top long-chained alkan-1-ols 
  • However, as the chain length of alkan-1-ols increase, the dispersion forces between the alkyl groups become stronger and mitigate the polarity of the hydroxyl group, decreasing their solubility.
Show Worked Solution
  • The graph shows a non-linear relationship with the following clear trend: as the molar mass increases, solubility decreases.
  • When molar mass increases, the chain length of a molecule increases. In alkan-1-ols this increases the length of their carbon backbone, increasing their non-polar nature (increased dispersion forces), thus solubility in polar solvents (eg: water) decreases
  • Shorter chain alcohols dissolve more readily in water. This is due to the formation of hydrogen bonds between the hydroxyl group of the alcohol and water molecules and the comparatively polar nature of the molecule compared top long-chained alkan-1-ols 
  • However, as the chain length of alkan-1-ols increase, the dispersion forces between the alkyl groups become stronger and mitigate the polarity of the hydroxyl group, decreasing their solubility.

Filed Under: Alcohols Tagged With: Band 4, smc-3679-50-Solubility and Boiling Point

CHEMISTRY, M8 2023 HSC 28

Alkene \(\ce{Q}\) undergoes an addition reaction with chlorine gas to form compound \(\ce{R}\).

  1. Describe a chemical test that could be done in a school laboratory to confirm that \(\ce{Q}\) is an alkene. Include expected observations in your answer.  (2 marks)

--- 4 WORK AREA LINES (style=lined) ---

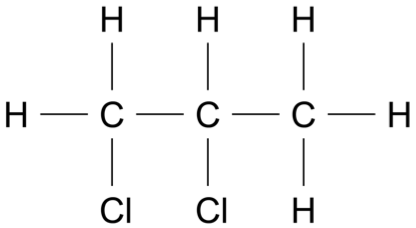
  1. Compound \(\ce{R}\) was analysed and found to contain approximately 32% carbon by mass. The mass spectrum of compound \(\ce{R}\) is shown. 

  1. Provide a structural formula for compound \(\ce{R}\). Support your answer with calculations.  (3 marks)

--- 9 WORK AREA LINES (style=lined) ---

Show Answers Only

a.    Chemical test for an alkene

  • Prepare a sample of alkene \(\ce{Q}\) in a clean test tube.
  • Add a few drops of bromine water to the sample.
  • The bromine water will be decolourised if \(\ce{Q}\) is an alkene.

Other correct answers could include:

  • The addition of potassium permanganate will also be decolourised by \(\ce{Q}\) if it is an alkene. 

b.   Molecular ion is present at m/z = 114

Atomic mass of \(\text{C}\) (in compound \(\ce{R}\)) = 32% × 114 = 36

\(\text{C}\) atoms in 1 molecule of R = 36 ÷ 12 = 3

Mass (non-\(\text{C}\)) = 114 – 36 = 78

\(\Rightarrow\) Two atoms of \(\ce{Cl}\) are in compound \(\ce{R}\)

\(\therefore\) \(\ce{R}\) has the formula \(\ce{C3H6Cl2}\), and structure:
 

Show Worked Solution

a.    Chemical test for an alkene

  • Prepare a sample of alkene \(\ce{Q}\) in a clean test tube.
  • Add a few drops of bromine water to the sample.
  • The bromine water will be decolourised if \(\ce{Q}\) is an alkene.

Other correct answers could include:

  • The addition of potassium permanganate will also be decolourised by \(\ce{Q}\) if it is an alkene.

b.   Molecular ion is present at m/z = 114

Atomic mass of \(\text{C}\) (in compound \(\ce{R}\)) = 32% × 114 = 36

\(\text{C}\) atoms in 1 molecule of R = 36 ÷ 12 = 3

Mass (non-\(\text{C}\)) = 114 – 36 = 78

\(\Rightarrow\) Two atoms of \(\ce{Cl}\) are in compound \(\ce{R}\)

\(\therefore\) \(\ce{R}\) has the formula \(\ce{C3H6Cl2}\), and structure:
 

♦ Mean mark (b) 53%.

Filed Under: Organic Substances Tagged With: Band 4, Band 5, smc-3683-40-Mass Spectrometry

CHEMISTRY, M7 2023 HSC 27

A student has been asked to produce 185 mL of ethanol (MM = 46.068 g mol\(^{-1} \)) by fermenting glucose using yeast, as shown in the equation.

\( \ce{C6H12O6(aq)} \rightarrow \ce{2C2H5OH(aq)} + \ce{2CO2(g)} \)

Given that the density of ethanol is 0.789 g mL\(^{-1} \), calculate the volume of carbon dioxide gas produced at 310 K and 100 kPa.   (4 marks)

--- 10 WORK AREA LINES (style=lined) ---

Show Answers Only

\(81.7\ \text{L}\)

Show Worked Solution

\(\text{Density}(\rho)\ = \dfrac{\text{m}}{\text{V}}\ \ \Rightarrow\ \ \text{m} = \rho \times\ \text{V} \)

\(\text{m(ethanol)}\ = 0.789 \times 185 = 146\ \text{g} \)

\(\text{n(ethanol)}\ = \dfrac{\text{m}}{\text{MM}} = \dfrac{146}{46.068} = 3.17\ \text{mol} \)

\(\text{V}=\dfrac{\text{n} RT}{P} =\dfrac{3.17 \times 8.314 \times 310}{100}=81.7\ \text{L}\)

Filed Under: Alcohols Tagged With: Band 4, smc-3679-70-Production

CHEMISTRY, M7 2023 HSC 25

A student used the apparatus shown to investigate the combustion of octan-1-ol.


The following results were obtained by the student.

Mass of water heated = 205 g
Initial temperature of water = 23.7°C
Final temperature of water = 60.4°C

The following data are given.

Molar enthalpy of combustion of octan-1-ol = – 5294 kJ mol\(^{-1} \)
Molar mass of octan-1-ol = 130.23 g kJ mol\(^{-1}\)
  1. Assuming that no energy released by this combustion is lost to the surroundings, calculate the mass of octan-1-ol burnt.   (3 marks)

    --- 8 WORK AREA LINES (style=lined) ---

  1. Explain ONE advantage of using a biofuel compared to fossil fuels.   (2 marks)

    --- 4 WORK AREA LINES (style=lined) ---

Show Answers Only

a.   0.774 grams

b.    Advantage of biofuel vs fossil fuel

  • Combustion of biofuels derived from plants will have a lower greenhouse impact as the carbon dioxide released during combustion will replace that used in photosynthesis, unlike fossil fuels.

Other answers could include:

  • Biofuels are biodegradable and therefore pose a much reduced environmental threat than fossil fuels which are not.
  • Biofuels are more sustainable than fossil fuels as they are produced from renewable resources.
Show Worked Solution

a.   Find the heat absorbed by the water ((\q\)):

\(q\) \(=mc \Delta T \)  
  \(=205 \times 4.18 \times 36.7 \)  
  \(=31\ 488.23\ \text{J}\)  
  \(=31.448\ \text{kJ}\)  

 
\(\text{octan-1-ol}\ \Rightarrow \ce{C8H18O} \)

\(\ce{MM(C8H18O) = 12.01 \times 8 + 1.008 \times 18 + 16 = 130.224} \)

\(\ce{n\text{(octan-1-ol)}}= \dfrac{-31.448\ \text{kJ}}{-5294\ \text{kJ mol}^{-1}} =5.94 \times 10^{-3}\ \text{mol} \)

\(\ce{m\text{(octan-1-ol)}}= 5.94 \times 10^{-3} \times 130.224 = 0.774\ \text{g} \)
 

b.    Advantage of biofuel vs fossil fuel

  • Combustion of biofuels derived from plants will have a lower greenhouse impact as the carbon dioxide released during combustion will replace that used in photosynthesis, unlike fossil fuels.

Other answers could include:

  • Biofuels are biodegradable and therefore pose a much reduced environmental threat than fossil fuels which are not.
  • Biofuels are more sustainable than fossil fuels as they are produced from renewable resources.

Filed Under: Alcohols Tagged With: Band 4, smc-3679-10-Combustion, smc-3679-60-Biofuels

CHEMISTRY, M6 2023 HSC 24

The hydrogen oxalate ion \( \ce{(HC2O4^{-})} \) is classified as amphiprotic.

Describe, using chemical equations, how this ion is amphiprotic.   (2 marks)

--- 4 WORK AREA LINES (style=lined) ---

Show Answers Only
  • \(\ce{HC2O4−}\) is amphiprotic because it can either accept or donate an \(\ce{H+}\) as shown in the following equations:
  •   \(\ce{HC2O4−(aq) + H+(aq) \rightleftharpoons H2C2O4(aq)}\)
  •   \(\ce{HC2O4−(aq) + OH−(aq) \rightleftharpoons H2O(l) + C2O4^{2−}(aq)}\)
Show Worked Solution
  • \(\ce{HC2O4−}\) is amphiprotic because it can either accept or donate an \(\ce{H+}\) as shown in the following equations:
  •   \(\ce{HC2O4−(aq) + H+(aq) \rightleftharpoons H2C2O4(aq)}\)
  •   \(\ce{HC2O4−(aq) + OH−(aq) \rightleftharpoons H2O(l) + C2O4^{2−}(aq)}\)

Filed Under: Bronsted-Lowry Theory Tagged With: Band 4, smc-3674-40-Amphiprotic Compounds

CHEMISTRY, M6 2023 HSC 23

The pH of two solutions, \(\text{X}\) and \(\text{Y}\), were measured before and after 10 drops of concentrated \( \ce{NaOH} \) was added to each.


Explain the pH changes that occurred in solutions \(\text{X}\) and \(\text{Y}\).  (3 marks)

--- 8 WORK AREA LINES (style=lined) ---

Show Answers Only
  • The diagram shows that the pH of solution \(\text{X}\) changes significantly with the introduction of the base \(\ce{NaOH}\), whereas the pH of solution \(\text{Y}\) only shows a small change in pH. This indicates that solution \(\text{Y}\) contains a buffer while solution \(\text{X}\) does not.
  • When \(\ce{NaOH}\) was added to solution \(\text{X}\), the addition of \(\ce{OH-}\) ions caused the increase in pH \(\ce{(pH = −log10 [H3O+]).} \)
  • In contrast, the \(\ce{OH-}\) ions react with the buffer solution in solution \(\text{Y}\). This has the effect of minimising the change in \(\ce{[H3O+]}\) and therefore pH.
Show Worked Solution
  • The diagram shows that the pH of solution \(\text{X}\) changes significantly with the introduction of the base \(\ce{NaOH}\), whereas the pH of solution \(\text{Y}\) only shows a small change in pH. This indicates that solution \(\text{Y}\) contains a buffer while solution \(\text{X}\) does not.
  • When \(\ce{NaOH}\) was added to solution \(\text{X}\), the addition of \(\ce{OH-}\) ions caused the increase in pH \(\ce{(pH = −log10 [H3O+]).} \)
  • In contrast, the \(\ce{OH-}\) ions react with the buffer solution in solution \(\text{Y}\). This has the effect of minimising the change in \(\ce{[H3O+]}\) and therefore pH.

Filed Under: Bronsted-Lowry Theory Tagged With: Band 4, smc-3674-15-pH of Mixed Solution

CHEMISTRY, M6 2023 HSC 22

Explain how the following substances would be classified under the Arrhenius and Brønsted-Lowry definitions of acids. Support your answer with relevant equations.  (4 marks)

    •  \( \ce{HCl(aq)} \)
    • \( \ce{NH4Cl(aq)} \)

--- 12 WORK AREA LINES (style=lined) ---

Show Answers Only
  • Acids are defined by Arrhenius as hydrogen-containing compounds that dissociate in water to give \(\ce{H+}\) ions.
  • \(\ce{HCl(aq)}\) produces \(\ce{H+}\) ions in water and therefore qualifies within Arrhenius’ definition of an acid.
  •    \(\ce{HCl(aq) \rightarrow H+(aq) + Cl−(aq)}\)
  • The salt \(\ce{NH4Cl}\) would not be recognised as an acid with Arrhenius’ definition, since the predominant ions present in aqueous solution are ammonium and chloride.
  • The Brønsted−Lowry theory states that acids are proton donors. \(\ce{HCl(aq)}\) is a proton donor and therefore also qualifies as a Brønsted−Lowry acid.
  • In contradiction to Arrhenius, ammonium chloride \(\ce{(NH4Cl)}\) is also classified as a Brønsted−Lowry acid. This is due to the ammonium ion donating a proton to water to form a hydronium ion.
  •    \(\ce{NH4+(aq) + H2O(l) \rightleftharpoons NH3(aq) + H3O+(aq)}\)
Show Worked Solution
  • Acids are defined by Arrhenius as hydrogen-containing compounds that dissociate in water to give \(\ce{H+}\) ions.
  • \(\ce{HCl(aq)}\) produces \(\ce{H+}\) ions in water and therefore qualifies within Arrhenius’ definition of an acid.
  •    \(\ce{HCl(aq) \rightarrow H+(aq) + Cl−(aq)}\)
  • The salt \(\ce{NH4Cl}\) would not be recognised as an acid with Arrhenius’ definition, since the predominant ions present in aqueous solution are ammonium and chloride.
  • The Brønsted−Lowry theory states that acids are proton donors. \(\ce{HCl(aq)}\) is a proton donor and therefore also qualifies as a Brønsted−Lowry acid.
  • In contradiction to Arrhenius, ammonium chloride \(\ce{(NH4Cl)}\) is also classified as a Brønsted−Lowry acid. This is due to the ammonium ion donating a proton to water to form a hydronium ion.
  •    \(\ce{NH4+(aq) + H2O(l) \rightleftharpoons NH3(aq) + H3O+(aq)}\)

Filed Under: Properties of Acids and Bases Tagged With: Band 4, smc-3673-10-Arrhenius and Bronsted-Lowry

CHEMISTRY, M6 2023 HSC 6 MC

The pH of a solution changes from 8 to 5.

What happens to the concentration of hydrogen ions during this change of pH?

  1. It increases by a factor of 3.
  2. It decreases by a factor of 3.
  3. It increases by a factor of 1000.
  4. It decreases by a factor of 1000.
Show Answers Only

\(C\)

Show Worked Solution
  • Each increase/decrease of pH by a magnitude of 1 represents a change in \(\ce{[H+]}\) of a factor of 10.
  • Therefore, concentration change when pH moves from 8 to 5 = 10 × 3 = 1000 (increase).

\(\Rightarrow C\)

Filed Under: Bronsted-Lowry Theory Tagged With: Band 4, smc-3674-10-Calculations Involving pH

BIOLOGY, M6 2023 HSC 35

5-Bromouracil (bU) is a synthetic chemical mutagen. It bonds with adenine in place of thymine in DNA. During replication, it then binds with guanine.

This will then make a guanine-cytosine pair on one strand of DNA instead of an adenine-thymine pair.
 

  1. Identify the type of mutation that is caused by bU.   (1 mark)

    --- 2 WORK AREA LINES (style=lined) ---

  2. Describe the possible effects on a protein if this mutation occurred within a gene.   (4 marks)

    --- 8 WORK AREA LINES (style=lined) ---

Show Answers Only

a.   Point mutation or substitution mutation

b.   Protein effects if mutation within gene:

  • If this mutation occurred within coding DNA, then the RNA produced would be G–C instead of A–T (depending on the strand).
  • As a result, when it is read by a ribosome a different codon will be read, which may or may not code for the same amino-acid.
  • If the mutation codes for a different amino-acid, a different polypeptide chain will form. 
  • This mutation process could cause the protein to fold differently which can alter it’s function or render it completely dysfunctional.
  • Alternatively, the new codon could also be interpreted as a stop codon, pre-emptively stopping production of the rest of the polypeptide chain. 

Show Worked Solution

a.   Point mutation or substitution mutation

b.   Protein effects if mutation within gene:

  • If this mutation occurred within coding DNA, then the RNA produced would be G–C instead of A–T (depending on the strand).
  • As a result, when it is read by a ribosome a different codon will be read, which may or may not code for the same amino-acid.
  • If the mutation codes for a different amino-acid, a different polypeptide chain will form. 
  • This mutation process could cause the protein to fold differently which can alter it’s function or render it completely dysfunctional.
  • Alternatively, the new codon could also be interpreted as a stop codon, pre-emptively stopping production of the rest of the polypeptide chain. 
♦ Mean mark (b) 46%.

Filed Under: DNA and Polypeptide Synthesis, Mutation Tagged With: Band 4, Band 5, smc-3650-20-Translation, smc-3650-30-Transcription, smc-3650-60-Proteins, smc-3652-30-Point Mutations, smc-3652-60-Mutagens

BIOLOGY, M6 2023 HSC 34

Cattle have been domesticated by humans for approximately 10 000 years. Many biotechnologies have been employed in the farming of cattle.

The table shows examples of the application of these biotechnologies.

\begin{array} {|l|l|}
\hline
\rule{0pt}{2.5ex} \textbf{Biotechnology} \rule[-1ex]{0pt}{0pt} & \textbf{Example} \\
\hline
\rule{0pt}{2.5ex} \text{Selective breeding} & \text{The offspring of highest milk producing female cows were} \\
\text{} & \text{retained and over time cows that produced more milk were bred,} \\
\text{} \rule[-1ex]{0pt}{0pt} & \text{leading to dairy breeds.} \\
\hline
\rule{0pt}{2.5ex} \text{Artificial} & \text{An American bull holds the current record for artificial} \\
\text{insemination} & \text{insemination. He produced 2.4 million units of semen and has} \\
\text{} \rule[-1ex]{0pt}{0pt} & \text{sired cattle in 50 countries.} \\
\hline
\rule{0pt}{2.5ex} \text{Whole organism} & \text{The success rate of cloning cattle is low. There are currently 30-40} \\
\text{cloning} \rule[-1ex]{0pt}{0pt} & \text{cloned cattle in Australia. They are not used commercially.} \\
\hline
\rule{0pt}{2.5ex} \text{Hybridisation } & \text{There are two species of domestic cattle, Bos taurus and Bos} \\
\text{} & \text{indicus. They can be hybridised to breed cattle with} \\
\text{} \rule[-1ex]{0pt}{0pt} & \text{characteristics of both species.} \\
\hline
\rule{0pt}{2.5ex} \text{Transgenic} & \text{The first transgenic cow produced human serum albumin in its} \\
\text{organisms} \rule[-1ex]{0pt}{0pt}& \text{milk. The use of transgenic cattle is not widespread.} \\
\hline
\end{array}

With reference to the table, evaluate the effect of biotechnologies on the biodiversity of cattle.  (5 marks)

Show Answers Only

  • Biotechnologies can increase, decrease or maintain the size of the gene pool in populations and species, particularly in the case of cattle which have been subject to a range of biotechnologies.
  • Selective breeding, which decreases biodiversity, has been used for hundreds of years by farmers who oversee the reproduction of cattle with favourable characteristics, such as females who produce the most milk.
  • Artificial insemination, which typically reduces biodiversity, allows a single bull to sire many offspring. This process breeds out certain characteristics of cattle, reducing the diversity of the species. However, in certain circumstances, the gene pool of specific communities can be diversified through the introduction of new alleles.
  • Whole cattle cloning reduces biodiversity by making cloned organisms that are identical genotypes to the parent. As the success rate is low and cloned animals are infertile, this does not have the potential to have a large impact on biodiversity.
  • Hybridisation generally increases biodiversity by naturally mating two different cattle species and in the process, introducing genes not originally present. 
  • Hybridisation can however also reduce biodiversity if cattle hybrids are then selectively bred in preference to the original breeds.
  • Transgenic organisms are produced where new alleles are artificially introduced into the species, increasing biodiversity. As this process is expensive and not widespread, it will not have a large effect on biodiversity.
  • In summary, the most wide spread and influential biotechnologies have the overall effect of decreasing the biodiversity of cattle.

Show Worked Solution

  • Biotechnologies can increase, decrease or maintain the size of the gene pool in populations and species, particularly in the case of cattle which have been subject to a range of biotechnologies.
  • Selective breeding, which decreases biodiversity, has been used for hundreds of years by farmers who oversee the reproduction of cattle with favourable characteristics, such as females who produce the most milk.
  • Artificial insemination, which typically reduces biodiversity, allows a single bull to sire many offspring. This process breeds out certain characteristics of cattle, reducing the diversity of the species. However, in certain circumstances, the gene pool of specific communities can be diversified through the introduction of new alleles.
  • Whole cattle cloning reduces biodiversity by making cloned organisms that are identical genotypes to the parent. As the success rate is low and cloned animals are infertile, this does not have the potential to have a large impact on biodiversity.
  • Hybridisation generally increases biodiversity by naturally mating two different cattle species and in the process, introducing genes not originally present. 
  • Hybridisation can however also reduce biodiversity if cattle hybrids are then selectively bred in preference to the original breeds.
  • Transgenic organisms are produced where new alleles are artificially introduced into the species, increasing biodiversity. As this process is expensive and not widespread, it will not have a large effect on biodiversity.
  • In summary, the most wide spread and influential biotechnologies have the overall effect of decreasing the biodiversity of cattle.

Filed Under: Biotechnology, Genetic Technologies Tagged With: Band 4, Band 5, smc-3653-10-Biodiversity, smc-3653-20-Evaluating Genetic Technology, smc-3654-05-Transgenic Organisms, smc-3654-20-Agriculture, smc-3654-51-Reproductive Technologies, smc-3654-70-Whole Organism Cloning

BIOLOGY, M6 2023 HSC 32

The mountain pygmy possum (Burramys parvus) is restricted to four regions in Australia's alpine zone. The species is listed as critically endangered with less than 2000 adults remaining. The range of the mountain pygmy possum has contracted due to a gradually warming climate.
 

Loss and degradation of these habitats have affected local populations. The graph shows changes in the Mt Buller population following recent bushfires and the introduction of male pygmy possums from Mt Bogong.
 

Evaluate how bushfires and the introduction of males from other locations have affected the population size and gene pool of the Mt Buller pygmy possum population.  (7 marks)

--- 18 WORK AREA LINES (style=lined) ---

Show Answers Only

  • Environmental factors can play extremely large roles in the population and hence gene pool of the pygmy possums in Mt Buller.
  • This can be seen especially between 1996-2007, where three bushfires throughout those years caused the population to drop from 90 to less than 10. This is because bushfires not only kill individual possums, but also destroy their habitat, reducing shelter, food and water sources for the survivors.
  • This catastrophic drop in population significantly reduced the alleles present in the Mt Buller gene pool. The “new” survivor gene pool would see some alleles potentially disappear while others appear more frequently in individuals.
  • This may have led to genetic drift (bottleneck effect) in this population where the low diversity of alleles in the population led to a further reduction in the population between 2002–2007.
  • To counteract this reduction in population and gene pool size, 6 male possums were introduced from a nearby population in 2007. This was done again in 2012, and despite there being another bushfire in 2011, the population increased to 150 by 2015.
  • The introduction of these males in 2007 almost doubled the known population at the time, but just as importantly diversified the gene pool, an effect helped by the isolation of the two populations.
  • This increase in genetic diversity also improves a species’ ability to adapt to the drier and hotter climates being experienced.
  • It is evident that both the bushfires and the introduction of males played different but very important roles in the population size and gene pool of the Mt Buller pygmy possum population.

Show Worked Solution

  • Environmental factors can play extremely large roles in the population and hence gene pool of the pygmy possums in Mt Buller.
  • This can be seen especially between 1996-2007, where three bushfires throughout those years caused the population to drop from 90 to less than 10. This is because bushfires not only kill individual possums, but also destroy their habitat, reducing shelter, food and water sources for the survivors.
  • This catastrophic drop in population significantly reduced the alleles present in the Mt Buller gene pool. The “new” survivor gene pool would see some alleles potentially disappear while others appear more frequently in individuals.
  • This may have led to genetic drift (bottleneck effect) in this population where the low diversity of alleles in the population led to a further reduction in the population between 2002–2007.
  • To counteract this reduction in population and gene pool size, 6 male possums were introduced from a nearby population in 2007. This was done again in 2012, and despite there being another bushfire in 2011, the population increased to 150 by 2015.
  • The introduction of these males in 2007 almost doubled the known population at the time, but just as importantly diversified the gene pool, an effect helped by the isolation of the two populations.
  • This increase in genetic diversity also improves a species’ ability to adapt to the drier and hotter climates being experienced.
  • It is evident that both the bushfires and the introduction of males played different but very important roles in the population size and gene pool of the Mt Buller pygmy possum population.

population.

Filed Under: Mutation Tagged With: Band 4, Band 5, smc-3652-10-Mechanisms of Change/Variation

BIOLOGY, M7 2023 HSC 30


Tetanus vaccines were introduced in 1953 resulting in reduced case numbers. The majority of recorded cases occurred in people aged 65 and over.

The graph shows the vaccination schedule for tetanus.


Assess the use of vaccinations and the vaccination schedule. Use the data provided to support your answer.  (5 marks)

Show Answers Only

  • Vaccines are an excellent tool to reduce the severity and spread of certain infectious diseases.
  • This is because vaccines contain dead or inactive versions of a pathogen, which then stimulates the body to fight it and store memory B cells with the associated antibodies.
  • This can be clearly seen on the graph after the first and second injections of the vaccine, where the first injection is the initial exposure while the second injection has a much larger production of antibodies due to the memory B cells being activated. This is the basis of immunity.
  • This effect is compounded each time with the the length of immunity increasing after each dose.
  • The vaccination schedule is designed so that a new dose is scheduled at the time a person following the recommended schedule would become non-immune.
  • The general trend in the graph/data suggest that the increase in cases of people over 65 is likely due to a long period elapsing since their last booster.
  • In summary, if an individual on the recommended vaccination schedule is exposed to the tetanus virus after 6 months of age, they would have already built up an adequate immunity to be able to fight the tetanus bacteria.
  • This effect makes vaccines especially effective in stopping the spread and severity of infectious diseases such as tetanus.

Show Worked Solution

  • Vaccines are an excellent tool to reduce the severity and spread of certain infectious diseases.
  • This is because vaccines contain dead or inactive versions of a pathogen, which then stimulates the body to fight it and store memory B cells with the associated antibodies.
  • This can be clearly seen on the graph after the first and second injections of the vaccine, where the first injection is the initial exposure while the second injection has a much larger production of antibodies due to the memory B cells being activated. This is the basis of immunity.
  • This effect is compounded each time with the the length of immunity increasing after each dose.
  • The vaccination schedule is designed so that a new dose is scheduled at the time a person following the recommended schedule would become non-immune.
  • The general trend in the graph/data suggest that the increase in cases of people over 65 is likely due to a long period elapsing since their last booster.
  • In summary, if an individual on the recommended vaccination schedule is exposed to the tetanus virus after 6 months of age, they would have already built up an adequate immunity to be able to fight the tetanus bacteria.
  • This effect makes vaccines especially effective in stopping the spread and severity of infectious diseases such as tetanus.

Filed Under: Prevention, Treatment and Control Tagged With: Band 4, smc-3658-20-Vaccines

BIOLOGY, M8 2023 HSC 29b

Organisms use various mechanisms to maintain their internal environment within tolerance limits.

Explain TWO adaptations in plants that help to maintain water balance.  (4 marks)

--- 8 WORK AREA LINES (style=lined) ---

Show Answers Only

Answers could include two of the following:

  • Leaves are covered in a waxy cuticle on their surface which reduces water loss. Plants that live in hotter and/or dryer areas will have thicker waxy cuticles.
  • Stomata are holes on the underside of the leaf which allow water to leave the plant via the process of transpiration. Stomata are able to close when the plant is exposed to higher temperatures which reduces transpiration.
  • Many plants also have sunken stomata which reduces transpiration.
  • A plant’s roots are able to absorb water from the ground, however the depths of these roots is dependant on the plant’s environment. Some plants such as cacti will have a shallow root system to absorb overnight condensation, while other plants have deeper root systems which allow them to reach the lower water table.

Show Worked Solution

Answers could include two of the following:

  • Leaves are covered in a waxy cuticle on their surface which reduces water loss. Plants that live in hotter and/or dryer areas will have thicker waxy cuticles.
  • Stomata are holes on the underside of the leaf which allow water to leave the plant via the process of transpiration. Stomata are able to close when the plant is exposed to higher temperatures which reduces transpiration.
  • Many plants also have sunken stomata which reduces transpiration.
  • A plant’s roots are able to absorb water from the ground, however the depths of these roots is dependant on the plant’s environment. Some plants such as cacti will have a shallow root system to absorb overnight condensation, while other plants have deeper root systems which allow them to reach the lower water table.

Filed Under: Homeostasis Tagged With: Band 4, smc-3659-15-Temperature, smc-3659-30-Water Balance in Plants

BIOLOGY, M8 2023 HSC 29a

Organisms use various mechanisms to maintain their internal environment within tolerance limits.

Outline a physiological adaptation in endotherms which assists in maintaining their internal environment.   (2 marks)

Show Answers Only

  • Endotherms have developed the ability to change the diameter of their blood vessels to be able to maintain a stable internal temperature.
  • If their internal temperature increases the blood vessels will dilate (vasodilation) which will cause warm blood to flush through and heat will radiate from the skin.
  • If their internal temperature drops the blood vessels will constrict (vasoconstriction) which will reduce the heat radiating from the skin and reduce heat loss.

Other answers could include

  • Sweating to maintain temperature.
  • Shivering/goosebumps to maintain temperature.

Show Worked Solution

  • Endotherms have developed the ability to change the diameter of their blood vessels to be able to maintain a stable internal temperature.
  • If their internal temperature increases the blood vessels will dilate (vasodilation) which will cause warm blood to flush through and heat will radiate from the skin.
  • If their internal temperature drops the blood vessels will constrict (vasoconstriction) which will reduce the heat radiating from the skin and reduce heat loss.

Other answers could include

  • Sweating to maintain temperature.
  • Shivering/goosebumps to maintain temperature.

Filed Under: Homeostasis Tagged With: Band 4, smc-3659-15-Temperature, smc-3659-20-Adaptations/Endotherms

BIOLOGY, M7 2023 HSC 28

  1. Describe a feature that distinguishes a viral from a bacterial pathogen.   (2 marks)

    --- 5 WORK AREA LINES (style=lined) ---

  2. A waterborne disease outbreak occurred after a flood.
  3. Outline an experimental procedure that could be used to determine if the pathogen is viral or bacterial.   (2 marks)

    --- 5 WORK AREA LINES (style=lined) ---

Show Answers Only

a.   Viral vs Bacterial Pathogen

  • Bacteria are single celled organisms and can reproduce on their own, outside of a host.
  • A virus is simply a protein coating around genetic material that can only reproduce via a host, using ribosomes to make copies of itself. 

Other answers could include:

  • Bacteria contain plasmids while viruses do not.
  • Bacteria contain a cell membrane and flagella while viruses are just a protein coat.
  • The length of a bacterium is 1–10 \(\mu\)m, much larger than the length of a virus which is typically between 0.05–0.1 \(\mu\)m. 

b.   Experimental procedure:

  • Collect diarrhoea samples from infected individuals and make stool cultures. 
  • If the disease is bacterial, the bacteria will be able to grow and multiply but if it is viral no growth will occur. 

Other answers could include

  • Using PCR to multiply DNA within the sample then using antigen testing to determine if the DNA is viral or bacterial in nature.

Show Worked Solution

a.   Viral vs Bacterial Pathogen

  • Bacteria are single celled organisms and can reproduce on their own, outside of a host.
  • A virus is simply a protein coating around genetic material that can only reproduce via a host, using ribosomes to make copies of itself. 

Other answers could include:

  • Bacteria contain plasmids while viruses do not.
  • Bacteria contain a cell membrane and flagella while viruses are just a protein coat.
  • The length of a bacterium is 1–10 \(\mu\)m, much larger than the length of a virus which is typically between 0.05–0.1 \(\mu\)m.  

b.   Experimental procedure:

  • Collect diarrhoea samples from infected individuals and make stool cultures. 
  • If the disease is bacterial, the bacteria will be able to grow and multiply but if it is viral no growth will occur. 

Other answers could include

  • Using PCR to multiply DNA within the sample then using antigen testing to determine if the DNA is viral or bacterial in nature.
Mean mark (b) 56%.

Filed Under: Causes of Infectious Disease Tagged With: Band 4, smc-3655-10-Classifying Pathogens

BIOLOGY, M8 2023 HSC 27

Air pollution has been linked to a variety of non-infectious neurological (brain) disorders. Some of the symptoms include memory loss, cognitive decline and impaired movement and coordination.

500 people from each of three major cities were surveyed and were monitored and tested for a period of 12 months. Each group included males and females aged between 20 and 50 years of age.

The results after 12 months were as follows:
 

Evaluate the method used in this epidemiological study in determining a link between air pollution and the symptoms.  (7 marks)

--- 16 WORK AREA LINES (style=lined) ---

Show Answers Only

  • This study is not an effective study for validating a link between air pollution and cognitive disorders due to a variety of issues with the study’s reliability, validity and accuracy.
  • While the study does have a reasonable sample size and uses 3 different cities, numerous important factors are not specified. These include risk factors such as age, sex, ethnicity and occupation of the participants in each city.
  • The 12 month timeframe of the study may not be long enough for symptoms to develop.
  • The study also does not signify the type and degree of symptoms that were experienced.
  • A non-city comparison where air pollution is low would provide good baseline data against which the data from city participants could be compared.
  • The study does also not take into account other important demographic factors, such as socioeconomic status and geography within a city. The proximity to industry of an individual’s workplace or residence would be a particularly important risk factor to consider.
  • Cities should be chosen that have different levels of air pollution in order to look for general trends in the data, such as more exposure to air pollution corresponds to a greater number of symptoms. There is no evidence that this is part of the study design.
  • This is not a valid nor reliable test in determining a link between air pollution and neurological disorders. Adding prior medical/family history and data relating to the testing centres/cities as well as controlling more variables will lead to a fairer test.

Show Worked Solution

  • This study is not an effective study for validating a link between air pollution and cognitive disorders due to a variety of issues with the study’s reliability, validity and accuracy.
  • While the study does have a reasonable sample size and uses 3 different cities, numerous important factors are not specified. These include risk factors such as age, sex, ethnicity and occupation of the participants in each city.
  • The 12 month timeframe of the study may not be long enough for symptoms to develop.
  • The study also does not signify the type and degree of symptoms that were experienced.
  • A non-city comparison where air pollution is low would provide good baseline data against which the data from city participants could be compared.
  • The study does also not take into account other important demographic factors, such as socioeconomic status and geography within a city. The proximity to industry of an individual’s workplace or residence would be a particularly important risk factor to consider.
  • Cities should be chosen that have different levels of air pollution in order to look for general trends in the data, such as more exposure to air pollution corresponds to a greater number of symptoms. There is no evidence that this is part of the study design.
  • This is not a valid nor reliable test in determining a link between air pollution and neurological disorders. Adding prior medical/family history and data relating to the testing centres/cities as well as controlling more variables will lead to a fairer test.
Mean mark 57%.

Filed Under: Epidemiology Tagged With: Band 4, Band 5, smc-3661-20-Evaluating the Method

BIOLOGY, M7 2023 HSC 26

Malaria is a potentially fatal infectious disease that is spread to humans by infected mosquitoes. Scientists investigated the behaviour of 20 mosquitoes for an hour in each of the four containers shown.

Aim: To determine if wearing clean clothing reduces the transmission of malaria.
 

Assume infected mosquitoes that land on clothing transmit malaria.

  1. Identify the dependent variable and a controlled variable in this investigation.   (2 marks)

    --- 3 WORK AREA LINES (style=lined) ---

  2. The results of the investigation showing the number of times mosquitoes landed on the clothing in an hour are provided.
     
    \begin{array}{|c|c|c|c|c|}
    \hline
    \rule{0pt}{2.5ex} \textit {Experiment} \rule[-1ex]{0pt}{0pt}& \textit {Container A} & \textit {Container B} & \textit {Container C} & \textit {Container D} \\
    \hline
    \rule{0pt}{2.5ex}  1 \rule[-1ex]{0pt}{0pt}& 15 & 7 & 12 & 5 \\
    \hline
    \rule{0pt}{2.5ex} 2 \rule[-1ex]{0pt}{0pt}& 19 & 5 & 9 & 3 \\
    \hline
    \rule{0pt}{2.5ex} 3 \rule[-1ex]{0pt}{0pt}& 12 & 4 & 14 & 6 \\
    \hline
    \rule{0pt}{2.5ex} 4 \rule[-1ex]{0pt}{0pt}& 18 & 6 & 13 & 4 \\
    \hline
    \rule{0pt}{2.5ex} 5 \rule[-1ex]{0pt}{0pt}& 19 & 6 & 10 & 3 \\
    \hline
    \end{array}
  1.  Justify a suitable conclusion for this investigation.   (3 marks)

    --- 6 WORK AREA LINES (style=lined) ---

Show Answers Only

a.   Dependant Variable: Number of mosquitos that land on the clothing.

Controlled Variable: Number of mosquitos in each container.

Alternative controlled variable: size of container
 

b.   Data results show:

  • Wearing clean clothing, on average, reduces the number of mosquitos that land on clothes.
  • This effect occurs for both infected and uninfected mosquitos.
  • Conclusion: wearing clean clothing will reduce the transmission of malaria, as infected mosquitos will land on clean clothing less often than on clothing already worn for a day.

Show Worked Solution

a.   Dependant Variable: Number of mosquitos that land on the clothing.

Controlled Variable: Number of mosquitos in each container.

Alternative controlled variable: size of container

♦ Mean mark 51%.

b.   Data results show:

  • Wearing clean clothing, on average, reduces the number of mosquitos that land on clothes.
  • This effect occurs for both infected and uninfected mosquitos.
  • Conclusion: wearing clean clothing will reduce the transmission of malaria, as infected mosquitos will land on clean clothing less often than on clothing already worn for a day.

Filed Under: Prevention, Treatment and Control Tagged With: Band 4, Band 5, smc-3658-50-Malaria

BIOLOGY, M5 2023 HSC 25d

The normal Huntingtin protein has 10−26 repeats of CAG. In Huntington’s 2 disease there are 37−80 repeats.

Diagram 1 shows a pedigree of a family known to be affected by Huntington's disease. Diagram 2 shows the results of gel electrophoresis on fragments of DNA from chromosome four, known to be altered in Huntington's disease.

Diagram 1

Diagram 2

Predict whether individuals \(S\) and \(U\) will be affected by Huntington's disease, and if so, at what age. Use data from the diagrams to justify your answer.   (3 marks) 

--- 6 WORK AREA LINES (style=lined) ---

Show Answers Only
  • Individual \(U\) has the same number of CAG repeats as individual \(Q\) and therefore would be expected to be affected by Huntington’s at the same age, 45.
  • Individual \(S\) has a normal number of repeats (between 10-26) and much like individual \(P\) who has the same number of repeats, he is not expected to be affected by Huntington’s.
Show Worked Solution
  • Individual \(U\) has the same number of CAG repeats as individual \(Q\) and therefore would be expected to be affected by Huntington’s at the same age, 45.
  • Individual \(S\) has a normal number of repeats (between 10-26) and much like individual \(P\) who has the same number of repeats, he is not expected to be affected by Huntington’s.

Filed Under: Genetic Variation / Inheritance Tagged With: Band 4, smc-3648-75-Inheritance Patterns

BIOLOGY, M5 2023 HSC 25b

Huntington's disease is caused by a misfolded protein 'Huntingtin'. It is caused by excess repeats of the DNA sequence CAG on the coding strand of DNA. The mRNA that is produced has the same sequence as the DNA.

Use the codon chart, starting in the centre, to identify the amino acid that is repeated.   (1 mark)

Show Answers Only
  • Glutamine
Show Worked Solution
  • Glutamine

Filed Under: DNA and Polypeptide Synthesis Tagged With: Band 4, smc-3650-20-Translation

BIOLOGY, M5 2023 HSC 25a

Huntington's disease is an autosomal dominant genetic disease.


Using the pedigree, justify the genotype of individual \(H\). In your answer, refer to the letters on the pedigree to identify individuals.  (3 marks)

--- 6 WORK AREA LINES (style=lined) ---

Show Answers Only

  • Let \(S\) be the dominant allele for Huntington’s and \(s\) be the recessive allele.
  • As individual \(H\) is affected, she could genotype either \(SS\) or \(Ss\).
  • However individual \(H\) has children (\(J\) and \(L\)) that are not affected and thus have genotype \(ss\). This is only possible if she has the recessive allele, and therefore individual \(H\) must have genotype \(Ss\).

Show Worked Solution

  • Let \(S\) be the dominant allele for Huntington’s and \(s\) be the recessive allele.
  • As individual \(H\) is affected, she could genotype either \(SS\) or \(Ss\).
  • However individual \(H\) has children (\(J\) and \(L\)) that are not affected and thus have genotype \(ss\). This is only possible if she has the recessive allele, and therefore individual \(H\) must have genotype \(Ss\).

Filed Under: Genetic Variation / Inheritance Tagged With: Band 4, smc-3648-10-Pedigrees, smc-3648-35-Autosomal

BIOLOGY, M8 2023 HSC 24

  1. Explain how problems with the structure and function of the eye can cause a named visual disorder.  (3 marks)

    --- 6 WORK AREA LINES (style=lined) ---

  2. Describe ONE technology that is used to assist with the effects of a named visual disorder.  (3 marks)

    --- 6 WORK AREA LINES (style=lined) ---

Show Answers Only

a.   The front of the eye is made up of the cornea, lens and pupil.

  • These work together to direct light onto the retina at the back of the eye so that we can see.
  • The lens is controlled by ligaments which change the shape of the lens to allow the focus of light onto the retina from objects at varying distances.
  • If someone suffers from myopia (short-sightedness) their lens is too large or their ligaments are unable to bend the lens correctly, causing the focal point to fall short of the retina.

b.   Glasses are a technology that help people with myopia.

  • Glasses with a concave lens will diverge light rays before they hit the eye lens, allowing the focal point to fall further back. 
  • Lens technology fine tunes this effect so the focal point hits the retina optimally and perfect sight is restored.

Answers could also include

  • A convex lens to address hyperopia (long-sightedness).
  • Laser surgery (LASIK) which uses a laser to flatten or steepen the cornea, addressing myopia, hyperopia and astigmatism.
  • Cataract surgery to replace a clouded/yellow lens.

Show Worked Solution

a.   The front of the eye is made up of the cornea, lens and pupil.

  • These work together to direct light onto the retina at the back of the eye so that we can see.
  • The lens is controlled by ligaments which change the shape of the lens to allow the focus of light onto the retina from objects at varying distances.
  • If someone suffers from myopia (short-sightedness) their lens is too large or their ligaments are unable to bend the lens correctly, causing the focal point to fall short of the retina.

b.   Glasses are a technology that help people with myopia.

  • Glasses with a concave lens will diverge light rays before they hit the eye lens, allowing the focal point to fall further back. 
  • Lens technology fine tunes this effect so the focal point hits the retina optimally and perfect sight is restored.

Answers could also include

  • A convex lens to address hyperopia (long-sightedness).
  • Laser surgery (LASIK) which uses a laser to flatten or steepen the cornea, addressing myopia, hyperopia and astigmatism.
  • Cataract surgery to replace a clouded/yellow lens.

Filed Under: Technologies and Disorders Tagged With: Band 4, smc-3663-20-Eyes

PHYSICS, M8 2023 HSC 27a

Explain how the composition and temperature of a star can be determined from its spectrum.   (4 marks)

--- 10 WORK AREA LINES (style=lined) ---

Show Answers Only

Chemical composition:

  • Each element has a unique emission spectra.
  • When the continuous spectra of a star passes through its cooler and lower density atmosphere, the electrons in the elements within the atmosphere are excited by specific wavelengths of light. When the electrons return to ground state, the light is scattered leaving absorption lines in the continuous spectra (absorption spectra).
  • Therefore by analysing the absorption lines and comparing it to known emission spectra, the chemical composition of the star can be determined.
  • Additionally, the relative intensity of the absorption lines corresponds to the relative abundance of the elements.

Temperature:

  • The surface temperature of a star can be determined from its black body radiation spectra. 
  • The sun’s spectra can be approximated to that of a black body curve. Wein’s Law  \(\lambda_{\text{max}}=\dfrac{b}{T}\)  can be used to calculate the surface temperature of the star.
  • Thus by determining the peak wavelength in the star’s spectrum, the surface temperature can be accurately calculated.

Show Worked Solution

Chemical composition:

  • Each element has a unique emission spectra.
  • When the continuous spectra of a star passes through its cooler and lower density atmosphere, the electrons in the elements within the atmosphere are excited by specific wavelengths of light. When the electrons return to ground state, the light is scattered leaving absorption lines in the continuous spectra (absorption spectra).
  • Therefore by analysing the absorption lines and comparing it to known emission spectra, the chemical composition of the star can be determined.
  • Additionally, the relative intensity of the absorption lines corresponds to the relative abundance of the elements.

Temperature:

  • The surface temperature of a star can be determined from its black body radiation spectra. 
  • The sun’s spectra can be approximated to that of a black body curve. Wein’s Law  \(\lambda_{\text{max}}=\dfrac{b}{T}\)  can be used to calculate the surface temperature of the star.
  • Thus by determining the peak wavelength in the star’s spectrum, the surface temperature can be accurately calculated.

Filed Under: Origins of Elements Tagged With: Band 4, smc-3700-20-Spectra

PHYSICS, M8 2023 HSC 26

Consider the following nuclear reaction

\({ }_{\ \ 6}^{12} \text{C} +{ }_1^1 \text{H} \rightarrow{ }_5^9 \text{B} +{ }_2^4 \text{He}\)

The masses of the isotopes in this process are shown in the table.

Isotope Mass (\(u\))
\({ }_{\ \ 6}^{12} \text{C}\) 12.064
\({ }_5^9 \text{B}\) 9.013
\({ }_2^4 \text{He}\) 4.003
\({ }_1^1 \text{H}\) 1.008
Calculate the energy released in this reaction.  (3 marks)

--- 6 WORK AREA LINES (style=lined) ---

Show Answers Only

\(52.164\) \(\text{MeV}\)  or  \(8.357 \times 10^{-12}\) \(\text{J}\)

Show Worked Solution

\(\text{Mass defect}\) \(=m_r-m_p\)  
  \(=(12.064+1.008)-(9.013+4.003)\)  
  \(=0.056\) \(\text{u}\)  


\(\text{Energy released}\) \(= 0.056 \times 931.5\) \(\text{MeV}\)  
  \(=52.164\) \(\text{MeV}\)  
  \(=8.357 \times 10^{-12} \) \(\text{J}\)  

Filed Under: Properties of the Nucleus Tagged With: Band 4, smc-3703-20-Conservation of Mass-Energy

PHYSICS, M6 2023 HSC 24

An electron is travelling at 3.0 \(\times\) 10\(^{6}\) m s\(^{-1}\) in the path shown.
 

Calculate the magnetic field required to keep the electron in the path.  (3 marks)

--- 6 WORK AREA LINES (style=lined) ---

Show Answers Only

\(1.7 \times 10^{-6}\) \(\text{T}\)

Show Worked Solution
  • The force from the magnetic field on the electron provides the centripetal acceleration for it to travel in uniform circular motion.
\( F_B\) \(=F_c\)  
\(qvB\) \(=\dfrac{mv^2}{r}\)  
\(B\) \(=\dfrac{mv}{qr}\)  
  \(=\dfrac{9.109 \times 10^{-31} \times 3.0 \times 10^6}{1.602 \times 10^{-19} \times 10}\)  
  \(=1.7 \times 10^{-6}\) \(\text{T}\)  


  • Magnetic field strength required = \(1.7 \times 10^{-6}\) \(\text{T}\).
Mean mark 57%.

Filed Under: Charged Particles, Conductors and Electric/Magnetic Fields Tagged With: Band 4, smc-3693-15-Charged Particles in MF, smc-3693-65-Uniform Circular Motion

PHYSICS, M7 2023 HSC 23b

The James Webb Space Telescope (JWST) is sensitive to wavelengths from  6.0 \(\times\) 10\(^{-7}\) m  to  2.8 \(\times\) 10\(^{-5}\) m.

What is the minimum photon energy that it can detect?  (3 marks)

--- 6 WORK AREA LINES (style=lined) ---

Show Answers Only

\(E_{\text{min}}= 7.1 \times 10^{-21}\) \( \text{J}\)

Show Worked Solution

  • The minimum photon energy corresponds to the minimum frequency.
  • Minimum frequency occurs at the maximum wavelength as frequency and wavelength are inversely proportional.
\(E_{\text{min}}\) \(=hf\)  
  \(=\dfrac{hc}{ \lambda}\)  
  \(=\dfrac{6.626 \times 10^{-34} \times 3 \times 10^8}{2.8 \times 10^{-5}} \)  
  \(=7.1 \times 10^{-21}\) \(\text J\)  

Filed Under: Light: Quantum Model Tagged With: Band 4, smc-3698-20-Photons, smc-3698-30-E=hf calcs

PHYSICS, M8 2023 HSC 21

A Hertzsprung–Russell diagram is shown.
 

  1. Identify TWO variables that determine the luminosity of a star.   (2 marks)

--- 4 WORK AREA LINES (style=lined) ---

  1. Describe differences between stars \(A\) and \(B\).   (3 marks)

--- 6 WORK AREA LINES (style=lined) ---

Show Answers Only

a.    Luminosity determinants:

  • Size
  • Temperature

Other variables could include:

  • Mass, colour and the power output of a star.

b.   Differences:

  • Star A is a main sequence star and is therefore fusing hydrogen to helium in its core via both the proton-proton chain and CNO cycle whereas Star B is a white dwarf star and therefore has no fusion taking place in its core.
  • Star A has a greater luminosity compared to Star B.
  • Star A is a younger star then Star B which is at the end of its lifecycle. 

Other differences could include:

  • Mass
  • Radius or size
Show Worked Solution

a.    Luminosity determinants:

  • Size
  • Temperature

Other variables could include:

  • Mass, colour and the power output of a star.

b.   Differences:

  • Star A is a main sequence star and is therefore fusing hydrogen to helium in its core via both the proton-proton chain and CNO cycle whereas Star B is a white dwarf star and therefore has no fusion taking place in its core.
  • Star A has a greater luminosity compared to Star B.
  • Star A is a younger star then Star B which is at the end of its lifecycle. 

Other differences could include:

  • Mass
  • Radius or size

Filed Under: Origins of Elements Tagged With: Band 3, Band 4, smc-3700-10-H-R Diagrams

PHYSICS, M5 2023 HSC 14 MC

Planet \(X\) has a mass 4 times that of Earth and a radius 3 times that of Earth. The escape velocity at the surface of Earth is 11.2 km s\(^{-1}\).

What is the escape velocity at the surface of planet \(X\) ?

  1. 8.40 km s\(^{-1}\) 
  2. 9.70 km s\(^{-1}\)
  3. 12.9 km s\(^{-1}\)
  4. 14.9 km s\(^{-1}\)
Show Answers Only

\(C\)

Show Worked Solution
  • The escape velocity of Earth, \( v_\text{esc}=  \sqrt{ \dfrac{2GM}{r}} \)
  • The escape velocity of planet \(X\)
\(v_\text{esc}\) \(=\sqrt{ \dfrac{2G \times 4M}{3r}} \)  
  \(=\dfrac{2}{\sqrt{3}} \times \sqrt{ \dfrac{2GM}{r}} \)  
  \(=\dfrac{2}{\sqrt{3}} \times 11.2 \)  
  \(= 12.9\ \text{km s}^{-1}\)  


\(\Rightarrow C\)

Filed Under: Motion in Gravitational Fields Tagged With: Band 4, smc-3692-70-Escape Velocity

PHYSICS, M7 2023 HSC 9 MC

The graph shows the relationship between radiation intensity and wavelength for a black body at 4500 K.
 

Which statement describes the expected difference in the graph for a black body at 4000 K?

  1. Intensity at all wavelengths will be less.
  2. Intensity at all wavelengths will be greater.
  3. The peak intensity will occur at a higher frequency.
  4. The peak intensity will occur at a shorter wavelength.
Show Answers Only

\(A\)

Show Worked Solution
  • The total power output of a black body diminishes with decreasing temperature, resulting in lower intensity across all wavelengths for the 4000 K curve.

\(\Rightarrow A\)

Filed Under: Light: Quantum Model Tagged With: Band 4, smc-3698-50-Blackbodies, smc-3698-70-Planck

PHYSICS, M5 2023 HSC 8 MC

A ball is launched from a platform at position \(A\) with velocity \(u\). It lands in the position shown.


The ball could be made to land at position \(B\) by increasing the

  1. velocity \(u\).
  2. launch angle.
  3. mass of the ball.
  4. height of the platform.
Show Answers Only

\(B\)

Show Worked Solution
  • As the launch angle increases, the horizontal velocity of the ball decreases.
  • At a steep launch angle, the ball will travel high into the air but have a short range, thus it could be made to land at position \(B\) as seen in the diagram below.
     

\(\Rightarrow B\)

Mean mark 56%.

Filed Under: Projectile Motion Tagged With: Band 4, smc-3690-10-Projectile Motion Models, smc-3690-25-Range

PHYSICS, M8 2023 HSC 7 MC

A proton and a neutron travel at the same speed.

Which statement correctly explains the difference between their de Broglie wavelengths?

  1. The proton has a longer wavelength because its mass is greater.
  2. The proton has a shorter wavelength because its mass is smaller.
  3. The neutron has a shorter wavelength because its mass is greater.
  4. The neutron has a longer wavelength because its mass is smaller.
Show Answers Only

\(C\)

Show Worked Solution
  • de Broglie wavelength equation  \( \lambda = \dfrac{h}{mv}\ \ \Rightarrow\ \ \lambda \propto \dfrac{1}{m} \)
  • Since the mass of a neutron is slightly greater than the mass of a proton, the neutron will have a shorter wavelength.

\(\Rightarrow C\)

Filed Under: Quantum Mechanical Nature of the Atom Tagged With: Band 4, smc-3702-40-De Broglie

PHYSICS, M5 2023 HSC 5 MC

An exoplanet is in an elliptical orbit, moving in the direction shown. The distances between consecutive positions \(P, Q, R\) and \(S\) are equal.


Between which two points is the exoplanet's travel time the greatest?

  1. \(P\) and \(Q\)
  2. \(Q\) and \(R\)
  3. \(R\) and \(S\)
  4. \(S\) and \(P\)
Show Answers Only

\(D\)

Show Worked Solution
  • As the exoplanet is in an elliptical orbit it will travel the slowest when it is the furthest away from the star.
  • As all distances between the points are equal, the exoplanet will have the greatest travel time between \(S\) and \(P\) where it moves the slowest.

\(\Rightarrow D\)

Filed Under: Motion in Gravitational Fields Tagged With: Band 4, smc-3692-30-Orbital Velocity/Period/Radius

PHYSICS, M7 2023 HSC 3 MC

A diagram representing a double slit experiment using light is shown.
  

Which of the following best represents the expected pattern on the screen?
 

Show Answers Only

\(C\)

Show Worked Solution
  • Light waves diffract when they pass through a double slit and produce an interference pattern.
  • The central maximum will occur in the centre of the screen where the path difference is 0 and where the path lengths differ by integral wavelengths.

\(\Rightarrow C\)

Filed Under: Light: Wave Model Tagged With: Band 4, smc-3697-10-Diffraction, smc-3697-20-Young

BIOLOGY, M4 EQ-Bank 24

Explain ONE example of a mutual symbiotic relationship.   (3 marks)

Show Answers Only
  • A mutual symbiotic relationship is one in which both organisms involved benefit.
  • One example would be the relationship between kangaroos and their gut bacteria.
  • Kangaroos cannot individually produce the enzyme cellulase that is able to digest cellulose, however, the bacteria that exist in their gut are able to.
  • This means that the kangaroo can break down the cell wall of plant cells (made of cellulose) and access the nutrients inside, while the bacteria can also obtain a food supply from the kangaroo as well as a safe place to live.

Other answers could include

  • Termites have protozoans that can digest cellulose.
  • Birds that sit atop cows eat ticks that may get stuck on the cow
Show Worked Solution
  • A mutual symbiotic relationship is one in which both organisms involved benefit.
  • One example would be the relationship between kangaroos and their gut bacteria.
  • Kangaroos cannot individually produce the enzyme cellulase that is able to digest cellulose, however, the bacteria that exist in their gut are able to.
  • This means that the kangaroo can break down the cell wall of plant cells (made of cellulose) and access the nutrients inside, while the bacteria can also obtain a food supply from the kangaroo as well as a safe place to live.

Other answers could include

  • Termites have protozoans that can digest cellulose.
  • Birds that sit atop cows eat ticks that may get stuck on the cow

Filed Under: Population Dynamics Tagged With: Band 4, smc-4311-15-Symbiotic relationships

BIOLOGY, M4 EQ-Bank 7 MC

A tapeworm is an animal that gains it's nutrients while living inside the host, often making the host seriously ill.

What kind of symbiotic relationship is this an example of?

  1. Predation.
  2. Parasitism.
  3. Mutualism.
  4. Commensalism.
Show Answers Only

\(B\)

Show Worked Solution
  • A tapeworm is an example of a parasite, it lives at the expense of a host.

\(\Rightarrow B\)

Filed Under: Population Dynamics Tagged With: Band 4, smc-4311-15-Symbiotic relationships

BIOLOGY, M5 2023 HSC 23

The following graph outlines some hormonal changes during pregnancy.
 

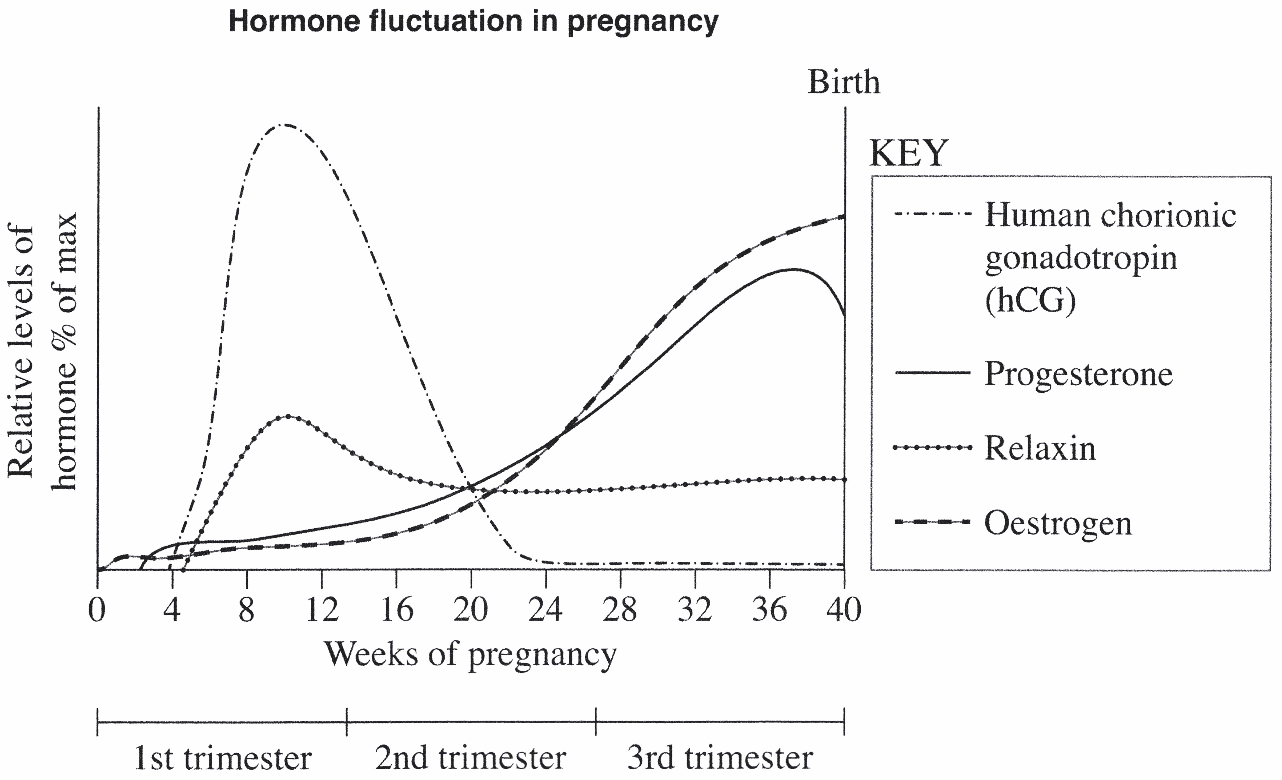
Complete the table for TWO of the hormones graphed.  (4 marks)

\begin{array} {|c|c|c|}
\hline
\rule{0pt}{2.5ex} \quad \textit{Hormone name} \quad \rule[-1ex]{0pt}{0pt} & \quad \quad \textit{Function in pregnancy} \quad \quad & \quad \textit{Trimester where}\quad \\
\text{} \rule[-1.5ex]{0pt}{0pt} & \text{} & \textit{peak occurs}\\
\hline
\text{} & \text{} & \text{} \\
\text{} & \text{} & \text{}\\
\text{} & \text{} & \text{} \\
\text{} & \text{} & \text{}\\
\hline
\text{} & \text{} & \text{} \\
\text{} & \text{} & \text{}\\
\text{} & \text{} & \text{} \\
\text{} & \text{} & \text{}\\
\hline
\end{array}

--- 0 WORK AREA LINES (style=lined) ---

Show Answers Only

Answers could include two of the following:

Hormone Name Function in Pregnancy Trimester where Peak Occurs

Progesterone

Initially, progesterone thickens the uterine lining to support the developing foetus. It is also produced in the placenta, helping to prevent lactation and contractions until full development. 

It will slowly increase until a peak in the third trimester when the placenta is fully developed. 

Oestrogen

Oestrogen is needed for stimulation of the development of the placenta, increasing the size of the uterus and helping the development of foetal organs.

Oestrogen will also gradually increase over time and peak in the final trimester.

Human Chorionic Gonadotrophin (hCG)

As soon as the blastocyst is implanted in the body, hCG will keep the corpus luteum active so it can produce oestrogen and progesterone.

hCG will peak in the first trimester.

Show Worked Solution

Answers could include two of the following:

Hormone Name Function in Pregnancy Trimester where Peak Occurs

Progesterone

Initially, progesterone thickens the uterine lining to support the developing foetus. It is also produced in the placenta, helping to prevent lactation and contractions until full development. 

It will slowly increase until a peak in the third trimester when the placenta is fully developed. 

Oestrogen

Oestrogen is needed for stimulation of the development of the placenta, increasing the size of the uterus and helping the development of foetal organs.

Oestrogen will also gradually increase over time and peak in the final trimester.

Human Chorionic Gonadotrophin (hCG)

As soon as the blastocyst is implanted in the body, hCG will keep the corpus luteum active so it can produce oestrogen and progesterone.

hCG will peak in the first trimester.

Filed Under: Reproduction Tagged With: Band 4, smc-3647-50-Hormones

BIOLOGY, M7 2023 HSC 22a

Describe how phagocytes help protect against pathogens.  (2 marks)

Show Answers Only
  • Phagocytes are white blood cells which can identify and engulf foreign material.
  • Upon detection of foreign material, phagocytes can engulf them forming a vesicle which fuses with a lysosome and allows them to be digested.
Show Worked Solution
  • Phagocytes are white blood cells which identify and engulf foreign material.
  • Upon detection of foreign material, phagocytes can engulf them forming a vesicle which fuses with a lysosome and allows them to be digested.

Filed Under: Immunity and Responses to Pathogens Tagged With: Band 4, smc-3657-30-Innate Response (2nd Line)

BIOLOGY, M5 2023 HSC 21a

Identify the components of a nucleotide.   (1 mark)

Show Answers Only

  • A 5-carbon sugar, a phosphate group and a base pair.

Show Worked Solution

  • A 5-carbon sugar, a phosphate group and a base pair.
Mean mark 57%.

Filed Under: Cell Replication Tagged With: Band 4, smc-3649-10-DNA Structure

BIOLOGY, M6 2023 HSC 20 MC

The diagram shows the karyotype of a normal female Tasmanian devil cell and the karyotype of a Tasmanian devil facial tumour cell.

M1, M2, M3 and M4 are marker chromosomes. These are chromosomes of unknown origin additional to the normal chromosomes found in the cells of Tasmanian devil facial tumour disease.

What can be deduced from the karyotypes?

  1. The karyotype of the tumour cells shows trisomy.
  2. The karyotype of tumour cells contains multiple chromosomal inversions.
  3. The karyotype of tumour cells contains both chromosomal insertions and deletions.
  4. The karyotype of the tumour cells contains more chromosomes than the karyotype of the normal Tasmanian devil cells.
Show Answers Only

\(C\)

Show Worked Solution
  • The karyotype of the tumour cells contains a deletion of the chromosome set 2 and addition of marker chromosomes.

\(\Rightarrow C\)

Filed Under: Mutation Tagged With: Band 4, smc-3652-40-Chromosomal Mutations

BIOLOGY, M6 2023 HSC 19 MC

The following are the five steps in the process of gene cloning.

  1. Selection of organisms containing recombinant DNA sequences
  2. Creation of recombinant DNA joined using DNA ligase
  3. Introduction of recombinant DNA into host organism
  4. Extraction and amplification of DNA to be cloned
  5. Choice of host organism and cloning vector

Which is the correct order for this process?

  1. 5, 2, 1, 3, 4
  2. 5, 4, 2, 3, 1
  3. 3, 2, 4, 5, 1
  4. 4, 5, 1, 2, 3
Show Answers Only

\(B\)

Show Worked Solution

By Elimination:

  • The choice of host organism and cloning vector (5) must come first (Eliminate C and D).
  • The extraction/amplification of the DNA segment of interest must come before the creation of the recombinant DNA (Eliminate A).

\(\Rightarrow B\)

Filed Under: Genetic Technologies Tagged With: Band 4, smc-3654-80-Gene Cloning

BIOLOGY, M5 2023 HSC 17 MC

In humans, blood groups are produced by combinations of three alleles \(I^A, I^B\) and \(i\).

\begin{array}{|c|l|}
\hline \rule{0pt}{2.5ex}\textit{Blood type} \rule[-1ex]{0pt}{0pt}& \textit{Genotype(s)}\\
\hline \rule{0pt}{2.5ex}\text{A} \rule[-1ex]{0pt}{0pt}& I^A I^A \  \text{or}\  I^A i \\
\hline \rule{0pt}{2.5ex}\text{B} \rule[-1ex]{0pt}{0pt}& I^B I^B \ \text{or}\  I^B i \\
\hline \rule{0pt}{2.5ex}\text{AB} \rule[-1ex]{0pt}{0pt}& I^A I^B \\
\hline \rule{0pt}{2.5ex}\text{O} & i i \\
\hline
\end{array}

A mother has blood type \(O\) and her child has blood type \(A\).

Which of the following includes all possible genotype(s) of the father?

  1. \(I^A I^A\)
  2. \(I^A I^A\)  or  \(I^A i\)
  3. \(I^A I^A\)  or  \(I^A i\)  or  \(I^A I^B\)
  4. \(I^A I^A\)  or  \(I^A i\)  or  \(I^A I^B\)  or  \(i i\)
Show Answers Only

\(C\)

Show Worked Solution
  • To have blood type \(A\), you can have either \(I^A I^A\) or \(I^A i\) genotypes.
  • As the mother has genotype \(i  i\), the child with blood type \(A\) can have a father that has a genotype with at least one \(I^A\) allele.
  • Option C includes every possible genotype with at least one \(I^A\) allele.

\(\Rightarrow C\)

Mean mark 56%.

Filed Under: Genetic Variation / Inheritance Tagged With: Band 4, smc-3648-45-Incomplete Dominance

BIOLOGY, M7 2023 HSC 15 MC

A pharmaceutical was tested for its effectiveness in treating a viral infection. A symptom severity score of zero indicates no symptoms.
 

What conclusion can be drawn from the graph?

  1. The pharmaceutical tested had no antiviral properties.
  2. The pharmaceutical tested did not reduce the severity of symptoms.
  3. The pharmaceutical tested increased symptoms in patients in the study.
  4. Pharmaceuticals do not reduce symptoms in patients suffering from viral infections.
Show Answers Only

\(B\)

Show Worked Solution

By Elimination:

  • Option C is an incorrect statement as symptoms did decrease (Eliminate C).
  • This test cannot be used to make a generalised statement about the ineffectiveness of all pharmaceuticals (Eliminate D).
  • The tested pharmaceutical may have antiviral properties against other viruses (Eliminate A).
  • The similarity between administering the antiviral and not treating someone were very similar, and therefore the drug did not reduce the severity of symptoms.

\(\Rightarrow B\)

♦ Mean mark 49%.

Filed Under: Prevention, Treatment and Control Tagged With: Band 4, smc-3658-11-Pharmaceuticals

  • « Previous Page
  • 1
  • …
  • 43
  • 44
  • 45
  • 46
  • 47
  • …
  • 114
  • Next Page »

Copyright © 2014–2025 SmarterEd.com.au · Log in