The city of Robville is divided into five suburbs labelled as `A` to `E` on the map below.
A lake which is situated in the city is shaded on the map.

A table is constructed to represent the number of land borders between suburbs.
If there is no land border between two suburbs, the table records a '0'. If there is a single land border between two suburbs, the table records a '1', and if there are two separate land borders between the same two suburbs, the table records a '2'.
`{:({:\ qquadAquadBquadCquadDquadE:}),({:(A),(B),(C),(D),(E):}[(0,1,1,1,0),(1,0,1,2,0),(1,1,0,0,0),(1,2,0,0,0),(0,0,0,0,0)]):}`
- Explain why all values in the final row and final column of the table are zero. (1 mark)
--- 2 WORK AREA LINES (style=lined) ---
In the network diagram below, vertices represent suburbs and edges represent land borders between suburbs.
The diagram has been started but is not finished.

- The network diagram is missing one edge and one vertex.
On the diagram
- draw the missing edge (1 mark)
- draw and label the missing vertex. (1 mark)
--- 0 WORK AREA LINES (style=lined) ---
- `E\ text(has no land borders with other suburbs.)`
- i. & ii.
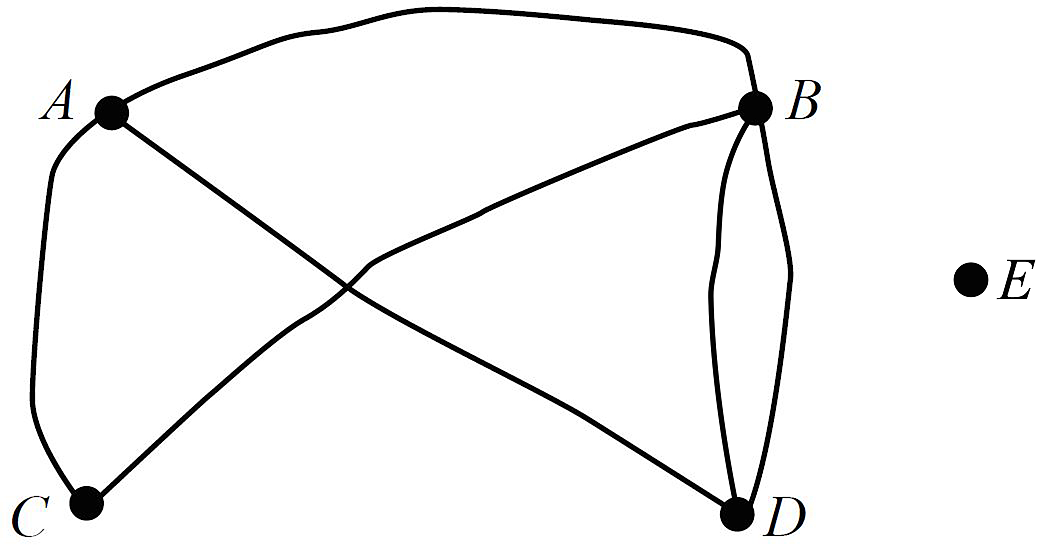
a. `E\ text(has no land borders with other suburbs.)`
| b.i. & ii. |  |