SmarterEd

Aussie Maths & Science Teachers: Save your time with SmarterEd

  • Login
  • Get Help
  • About

Algebra, STD2 EQ-Bank 35

The graph of the parabola \(y=k(x-2)(x-8)\) for some value of \(k\) is shown.
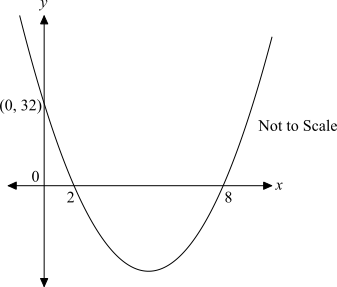
 

By first finding the value of \(k\), find the coordinates of the vertex.   (3 marks)

--- 10 WORK AREA LINES (style=lined) ---

Show Answers Only

\(\text{Vertex:}\ (5,-18)\)

Show Worked Solution

\(\text{Since graph passes through}\ (0,32):\)

\(32\) \(=k(0-2)(0-8)\)
\(32\) \(=16k\)
\(k\) \(=2\)

  
\(\text{Vertex is halfway between \(x\)-intercepts.}\)

\(\Rightarrow \ x=\dfrac{2+8}{2}=5\)

\(y\) \(=2(5-2)(5-8)\)
  \(=2 \times 3 \times (-3)\)
  \(=-18\)

 
\(\therefore\ \text{Vertex at}\ (5,-18).\)

Filed Under: Quadratic Relationships Tagged With: Band 5, smc-6922-10-Find Vertex, syllabus-2027

Algebra, STD2 EQ-Bank 32

A school sold tickets to its annual play.

Adult tickets were sold for $8 each and student tickets were sold for $5 each.

A total of 142 tickets were sold, raising $896 in ticket sales.

By writing two equations to represent this information, find the number of adult tickets and the number of student tickets sold.   (3 marks)

--- 12 WORK AREA LINES (style=lined) ---

Show Answers Only

\(\text{Adult tickets}=62, \ \text{Student tickets}=80\)

Show Worked Solution

\(\text{Let}\ x=\text{adult tickets},\ y=\text{student tickets}\)

\(8x+5y=896\ …\ (1)\)

\(x+y=142\ \ \Rightarrow \ y=142-x\ …\ (2)\)

\(\text{Substitute}\ \ y=142-x\ \ \text{into (1):}\)

\(8x+5(142-x)\) \(=896\)
\(8x+710-5x\) \(=896\)
\(3x\) \(=896-710=186\)
\(x\) \(=62\)

 
\(\text{Substitute}\ \ x=62\ \ \text{into (2):}\)

\(y=142-62=80\)

\(\therefore\ \text{62 adult tickets and 80 student tickets were sold.}\)

Filed Under: Simultaneous Linear Equations Tagged With: Band 5, smc-6920-25-Solve Algebraically, syllabus-2027

Algebra, STD2 EQ-Bank 30

Eleni is a farmer who sold chickens and ducks at the local market.

Each chicken was sold for $15 and each duck was sold for $9.

She sold a total of 78 birds for a total of $930.

By writing two equations to represent this information, find the number of chickens and the number of ducks Eleni sold.   (3 marks)

--- 12 WORK AREA LINES (style=lined) ---

Show Answers Only

\(\text{Chickens}=38, \ \text{Ducks}=40\)

Show Worked Solution

\(\text{Let}\ x=\text{chickens},\ y=\text{ducks}\)

\(15x+9y=930\ …\ (1)\)

\(x+y=78\ \ \Rightarrow \ y=78-x\ …\ (2)\)

\(\text{Substitute}\ \ y=78-x\ \ \text{into (1):}\)

\(15x+9(78-x)\) \(=930\)
\(15x+702-9x\) \(=930\)
\(6x\) \(=930-702=228\)
\(x\) \(=38\)

 
\(\text{Substitute}\ \ x=38\ \ \text{into (2):}\)

\(y=78-38=40\)

\(\therefore\ \text{Eleni sold 38 chickens and 40 ducks.}\)

Filed Under: Simultaneous Linear Equations Tagged With: Band 5, smc-6920-25-Solve Algebraically, syllabus-2027

Algebra, STD2 EQ-Bank 29_2

The number of monthly subscribers \((S)\) to a print magazine is decreasing. The number of subscribers is modelled using

\(S=k(1.06)^{-t}\)  for  \( t \geq 0,\)

where \(t\) is time in months.

The number of subscribers today is 12 000.

  1. Use the model to estimate the number of subscribers 10 months from today.   (2 marks)

    --- 5 WORK AREA LINES (style=lined) ---

  2. The number of subscribers needs to always be above 3000.
  3. Explain why this model is NOT appropriate to use in this case.   (1 mark)

    --- 3 WORK AREA LINES (style=lined) ---

Show Answers Only

a.    \(S=12\,000(1.06)^{-10}=6700.73…=6701\ \text{(nearest subscriber)}\)

b.    \(\text{When}\ \ t=30\ \ \Rightarrow\ \ S \approx 2089\)

\(\text{Since the number of subscribers needs to always be over 3000, it is not appropriate.}\)

Show Worked Solution

a.    \(\text{When}\ \ t=0,\ \ S=12\,000:\)

\(12\,000=k(1.06)^{0}\ \ \Rightarrow\ \ k=12\,000\)

\(\text{Find}\ S\ \text{when}\ \ t=10:\)

\(S=12\,000(1.06)^{-10}=6700.73…=6701\ \text{(nearest subscriber)}\)
 

b.    \(\text{When}\ \ t=30:\)

\(S=12\,000(1.06)^{-30} \approx 2089\)

\(\text{Since the number of subscribers needs to always be over 3000, it is not appropriate.}\)

Filed Under: Exponential Functions (Y12-X), Non-Linear: Exponential/Quadratics (Std 2-X) Tagged With: Band 4, Band 5, smc-7719-20-\(y=ka^{-x}\), smc-7719-50-Model Limits

Algebra, STD2 EQ-Bank 30

The number \((F)\) of fish in Lake Mulloway is decreasing. The number of fish is modelled using

\(F=k(1.05)^{-t}\)  for  \( t \geq 0,\)

where \(t\) is time in years.

The number of fish in Lake Mulloway after 1 year is 4620.

  1. Using the model, estimate the number of fish in Lake Mulloway today.   (2 marks)

    --- 5 WORK AREA LINES (style=lined) ---

  2. The local newsgroup on socials has used the model to predict the number of fish that will be in Lake Mulloway in 40 years time.
  3. If the number of fish in the lake needs to always be above 1000, explain why this model is NOT appropriate to use in this case.   (1 mark)
  4. --- 3 WORK AREA LINES (style=lined) ---

Show Answers Only

a.    \(F=4851\)

b.    \(\text{When}\ \ t=40\ \ \Rightarrow\ \ F \approx 689\)

\(\text{Since the number of fish needs to always be over 1000, it is not appropriate.}\)

Show Worked Solution

a.    \(\text{When}\ \ t=1,\ \ F=4620:\)

\(4620=k(1.05)^{-1}\ \ \Rightarrow\ \ k=4620 \times 1.05=4851\)

\(\text{Find}\ F\ \text{when}\ \ t=0:\)

\(F=4851(1.05)^{0}=4851\)
 

b.    \(\text{When}\ \ t=40:\)

\(F=4851(1.05)^{-40} \approx 689\)

\(\text{Since the number of fish needs to always be over 1000, it is not appropriate.}\)

Filed Under: Exponential Functions Tagged With: Band 4, Band 5, smc-6921-20-\(\large y=ka^{-x}\), smc-6921-50-Model Limitations

v1 Algebra, STD2 EQ-Bank 29

The number \((N)\) of native birds in a wildlife reserve is decreasing. The number of birds is modelled using

\(N=k(1.08)^{-t}\)  for \( t \geq 0,\)

where \(t\) is time in years.

The number of birds in the reserve today is 8000.

  1. Use the model to estimate the number of birds in the reserve 12 years from today.   (2 marks)

    --- 5 WORK AREA LINES (style=lined) ---

  2. The number of birds in the reserve needs to always be above 1500.
  3. Explain why this model is NOT appropriate to use in this case.   (1 mark)

    --- 3 WORK AREA LINES (style=lined) ---

Show Answers Only

a.    \(N=8000(1.08)^{-12}=3176.91…=3177\ \text{(nearest bird)}\)

b.    \(\text{When}\ \ t=25:\)

\(N=8000(1.08)^{-25}=1168.14…\)

\(\text{Since the number of birds needs to always be over 1500, it is not appropriate.}\)

Show Worked Solution

a.    \(\text{When}\ \ t=0,\ \ N=8000:\)

\(8000=k(1.08)^{0}\ \ \Rightarrow\ \ k=8000\)

\(\text{Find}\ N\ \text{when}\ \ t=12:\)

\(N=8000(1.08)^{-12}=3176.91…=3177\ \text{(nearest bird)}\)
 

b.    \(\text{When}\ \ t=25:\)

\(N=8000(1.08)^{-25}=1168.14…\)

\(\text{Since the number of birds needs to always be over 1500, it is not appropriate.}\)

Filed Under: Exponential Functions (Y12-X), Non-Linear: Exponential/Quadratics (Std 2-X) Tagged With: Band 4, Band 5, smc-7719-20-\(y=ka^{-x}\), smc-7719-50-Model Limits

Statistics, STD2 EQ-Bank 35

The life span of light globes from a particular factory is normally distributed with a mean of 840 hours and a standard deviation of 80 hours.

Light globes which have a life span between 600 hours and 712 hours are considered to have a short life span.

Light globes which have a life span between 1000 hours and 1112 hours are considered to have a long life span.

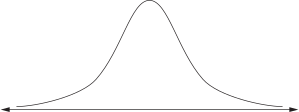
Explain, with reference to areas under the normal distribution curve, whether the number of light globes with a short life span is expected to be more or less than the number of light globes with a long life span.   (3 marks)
 

--- 8 WORK AREA LINES (style=lined) ---

Show Answers Only

\(\text{Sketch the normal curve:}\ \mu=840, \ \sigma=80\)
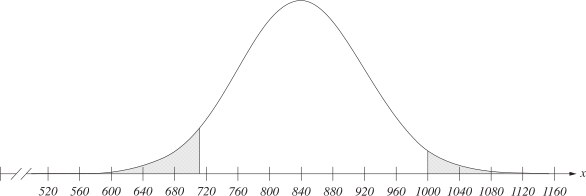
 

\(\text{Since the area shown for the “short life span” is closer to the mean,}\)

\(\text{it is a larger area. It can therefore be expected that there are more}\)

\(\text{light globes with a short life span than with a long life span.}\)

Show Worked Solution

\(\text{Sketch the normal curve:}\ \mu=840, \ \sigma=80\)


\(\text{Since the area shown for the “short life span” is closer to the mean,}\)

\(\text{it is a larger area. It can therefore be expected that there are more}\)

\(\text{light globes with a short life span than with a long life span.}\)

Filed Under: The Normal Distribution (Y12) Tagged With: Band 5, smc-6919-40-Graphs

Statistical, STD2 EQ-Bank 30

A teacher surveyed the students in her Year 8 class to investigate the relationship between the number of hours of phone use per day and the number of hours of sleep per day.

The results for five students are shown on the scatterplot. The least-squares regression line is also shown.
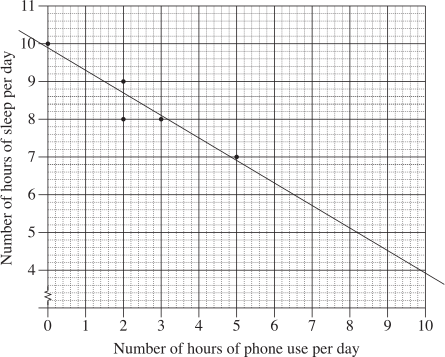


  1. Calculate Pearson's correlation coefficient \((r)\), to 4 decimal places, and describe the relationship between number of hours of sleep per day and number of hours of phone use per day.   (3  marks)

    --- 4 WORK AREA LINES (style=lined) ---

  2. Find the equation of the least-squares regression line.   (2  marks)

    --- 2 WORK AREA LINES (style=lined) ---

  3. From the data, the median number of hours of phone use per day, \(a\), and the median of the number of hours of sleep per day, \(b\), are to be calculated.
  4. By finding the coordinates \((a, b)\), determine whether this point would lie on, below or above the least-squares regression line.   (3  marks)

    --- 3 WORK AREA LINES (style=lined) ---

Show Answers Only

a.    \(r=-0.9414\)

\(\text{There is a strong, negative linear relationship between number of hours of sleep}\)

\(\text{per day and number of hours of phone use per day.}\)
 

b.    \(\text{By calculator (inputting all data points):}\)

\(y=-0.591 x+9.818 \ \text{(3 d.p.)}\)
 

c.    \(x\text{-values of data points:}\ {0,2,2,3,5}\)

\(\text{Median of the number of hours of phone use = 2 hours}\)

\(y\text{-values of data points:}\ {7,8,8,9,10}\)

\(\text{Median of the number of hours of sleep = 8 hours}\)

\((a,b) = (2,8)\ \ \Rightarrow\ \ \text{this point lies below the LSRL.}\)

Show Worked Solution

a.    \(r=-0.9414\)

\(\text{There is a strong, negative linear relationship between number of hours of sleep}\)

\(\text{per day and number of hours of phone use per day.}\)
 

b.    \(\text{By calculator (inputting all data points):}\)

\(y=-0.591 x+9.818 \ \text{(3 d.p.)}\)
 

c.    \(x\text{-values of data points:}\ {0,2,2,3,5}\)

\(\text{Median of the number of hours of phone use = 2 hours}\)

\(y\text{-values of data points:}\ {7,8,8,9,10}\)

\(\text{Median of the number of hours of sleep = 8 hours}\)

\((a,b) = (2,8)\ \ \Rightarrow\ \ \text{this point lies below the LSRL.}\)

Filed Under: Bivariate Data Analysis (Y12) Tagged With: Band 4, Band 5, smc-6934-20-LSRL, smc-6934-40-Pearson’s

Networks, STD2 EQ-Bank 30

A weighted and directed network diagram is shown.
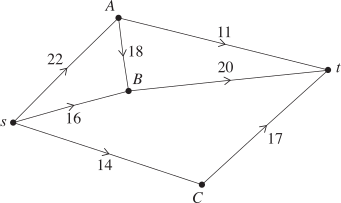
 

  1. What is the outflow from vertex \(C\) ?   (1 mark)

    --- 2 WORK AREA LINES (style=lined) ---

  2. Calculate the maximum flow through the network.   (2 marks)

    --- 5 WORK AREA LINES (style=lined) ---

  3. The capacity of ONE saturated edge is to be increased in order to produce a new network with the maximum possible flow.
  4. State an edge which could have an increased capacity AND find the new maximum flow through this new network.   (2 marks)

    --- 3 WORK AREA LINES (style=lined) ---

Show Answers Only

a.    \(\text{Inflow of \(C\) = Outflow of \(C\) = 14}\)

b.    \(\text{Method 1:}\)

\(\text{Minimum cut through}\ \ sC-Bt-At:\)

\(\text{Maximum flow} = 14+20+11=45\)
 

\(\text{Method 2:}\)
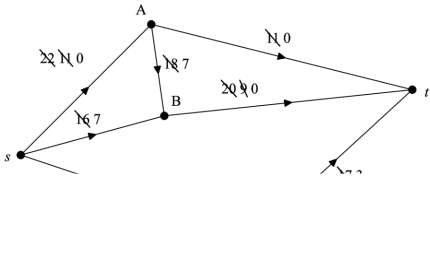


\(sAt\ \ 11\ \text{(leaving an excess flow capacity of } s A=11 \text { )}\)

\(sABt\ \ 11\ \text{(leaving an excess flow capacity of } AB=7 \text { and } B t=9 \text { )}\)

\(sBt\ \ 9\ \text{(leaving an excess flow capacity of } s B=7 \text { )}\)

\(sCt\ \ 14\ \text{(leaving an excess flow capacity of } C t=3)\)

\(\text{Maximum Flow} = 11+11+9+14=45\)
 

c.    \(\text{Answers could include one of the following:}\)

\(\text{B} t \ \text{could be increased (by 7) leading to a maximum flow of 52.}\)

\(\text{A} t \ \text{could be increased (by 11) leading to a maximum flow of 52.}\)

Show Worked Solution

a.    \(\text{Inflow of \(C\) = Outflow of \(C\) = 14}\)

b.    \(\text{Method 1:}\)

\(\text{Minimum cut through}\ \ sC-Bt-At:\)

\(\text{Maximum flow} = 14+20+11=45\)
 

\(\text{Method 2:}\)


\(sAt\ \ 11\ \text{(leaving an excess flow capacity of } s A=11 \text { )}\)

\(sABt\ \ 11\ \text{(leaving an excess flow capacity of } AB=7 \text { and } B t=9 \text { )}\)

\(sBt\ \ 9\ \text{(leaving an excess flow capacity of } s B=7 \text { )}\)

\(sCt\ \ 14\ \text{(leaving an excess flow capacity of } C t=3)\)

\(\text{Maximum Flow} = 11+11+9+14=45\)
 

c.    \(\text{Answers could include one of the following:}\)

\(\text{B} t \ \text{could be increased (by 7) leading to a maximum flow of 52.}\)

\(\text{A} t \ \text{could be increased (by 11) leading to a maximum flow of 52.}\)

Filed Under: Network Flow (Y12) Tagged With: Band 4, Band 5, smc-6915-10-Min Cut/Max Flow, smc-6915-35-Saturated Edges Method, syllabus-2027

Algebra, STD2 EQ-Bank 36

The graph of the parabola \(y=a(x-1)(x-9)\) for some value of \(a\) is shown.
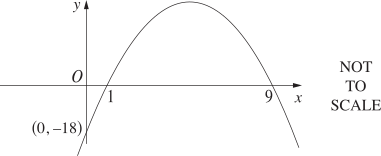
 

By first finding the value of \(a\), find the coordinates of the vertex.   (3 marks)

--- 10 WORK AREA LINES (style=lined) ---

Show Answers Only

\(\text{Vertex:}\ (5,32)\)

Show Worked Solution

\(\text{Since graph passes through}\ (0,-18):\)

\(-18\) \(=a(0-1)(0-9)\)
\(-18\) \(=9a\)
\(a\) \(=-2\)

 
\(\text{Vertex is halfway between \(x\)-intercepts}\ \ \Rightarrow\ \ x=5\)

\(y\) \(=-2(5-1)(5-9)\)
  \(=-2 \times 4 \times (-4)=32\)

 
\(\therefore\ \text{Vertex at}\ (5,32).\)

Filed Under: Quadratic Relationships Tagged With: Band 5, smc-6922-10-Find Vertex, syllabus-2027

Algebra, STD2 EQ-Bank 29

The population ( \(P\) ) of a town is reducing. The population is modelled using

\(P=k(1.1)^{-t}\)  for  \( t \geq 0,\)

where \(t\) is time in years.

The population of the town today is 5000 .

  1. Use the model to estimate the population of the town 15 years from today.   (2 marks)

    --- 5 WORK AREA LINES (style=lined) ---

  2. The population of the town needs to always be above 500 .
  3. Explain why this model is NOT appropriate to use in this case.   (1 mark)

    --- 3 WORK AREA LINES (style=lined) ---

Show Answers Only

a.    \(P=5000(1.1)^{-15}=1196.96…=1197\ \text{(nearest person)}\)

b.    \(\text{When}\ \ t=30\ \ \Rightarrow\ \ P \approx 287\)

\(\text{Since the population needs to always be over 500, it is not appropriate.}\)

Show Worked Solution

a.    \(\text{When}\ \ t=0,\ \ P=5000:\)

\(5000=k(1.1)^{0}\ \ \Rightarrow\ \ k=5000\)

\(\text{Find}\ P\ \text{when}\ \ t=15:\)

\(P=5000(1.1)^{-15}=1196.96…=1197\ \text{(nearest person)}\)
 

b.    \(\text{When}\ \ t=30\ \ \Rightarrow\ \ P \approx 287\)

\(\text{Since the population needs to always be over 500, it is not appropriate.}\)

Filed Under: Exponential Functions Tagged With: Band 4, Band 5, smc-6921-20-\(\large y=ka^{-x}\), smc-6921-50-Model Limitations

Algebra, STD2 EQ-Bank 29

Two friends, Adam and Bertha, sold cupcakes for a fundraising event.

Adam sold \(x\) cupcakes for $3 each. Bertha sold \(y\) cupcakes for $2 each.

Together they sold 113 cupcakes with total sales revenue of $275.

By writing two equations to represent this information, find the number of cupcakes sold by each of the two friends.   (3 marks)

--- 12 WORK AREA LINES (style=lined) ---

Show Answers Only

\(x=49, \ y=64\)

Show Worked Solution

\(3x+2y=275\ …\ (1)\)

\(x+y=113\ \ \Rightarrow \ y=113-x\ …\ (2)\)

\(\text{Substitute}\ \ y=113-x\ \ \text{into (1):}\)

\(3x+2(113-x)\) \(=275\)
\(3x+226-2x\) \(=275\)
\(x\) \(=275-226=49\)

 
\(\text{Substitute}\ \ x=49\ \ \text{into (2):}\)

\(y=113-49=64\)

\(\therefore\ \text{Adam sold 49 and Bertha sold 64.}\)

Filed Under: Simultaneous Linear Equations Tagged With: Band 5, smc-6920-25-Solve Algebraically, syllabus-2027

Measurement, STD2 EQ-Bank 35

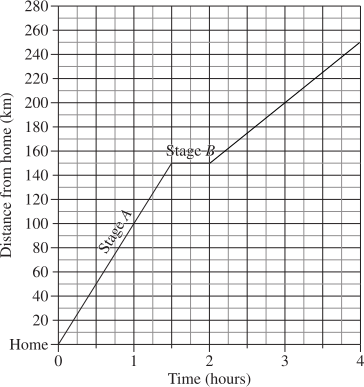
The distance-time graph shows the first two stages of a car journey from home to a holiday house.
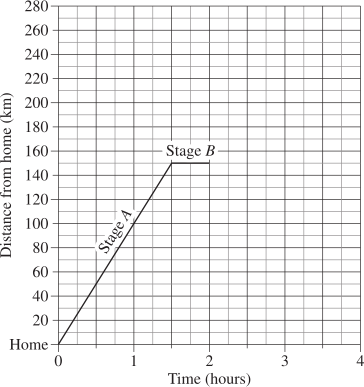
  

  1. At what speed, in metres per second, did the car travel during stage \(A\) of the journey? Give your answer correct to one decimal place.   (2 marks)

    --- 7 WORK AREA LINES (style=lined) ---

  2. After stage \(B\), the car continues to travel towards the holiday house at a constant speed of \(50\ \text{km/h}\) for 2 hours. Graph this part of the journey on the grid above.   (2 marks)

    --- 4 WORK AREA LINES (style=lined) ---

Show Answers Only

a.    \(27.8\ \text{m/s}\)

b.   

Show Worked Solution

a.    \(\text{Distance travelled} = 150\ \text{km}\ =150\,000\ \text{m}\)

\(\text{Stage A duration = 1.5 hours}\)

\(\text{Express 1.5 hours in minutes:}\)

\(\text{Minutes} = 1.5 \times 60 \times 60 = 5400\ \text{seconds}\)

\(\text{Speed} = \dfrac{150\,000}{5400}=27.77…=27.8\ \text{m/s}\)


b.    \(\text{Position after 2 hours at 50km/h}=(150+2\times 50 , 2 + 2) = (250 , 4)\)


Filed Under: Rates Tagged With: Band 4, Band 5, smc-6932-60-Travel Graphs

Statistics, STD2 EQ-Bank 26

The image shows the proportion of people in various categories based on the 2021 census of the Australian population.
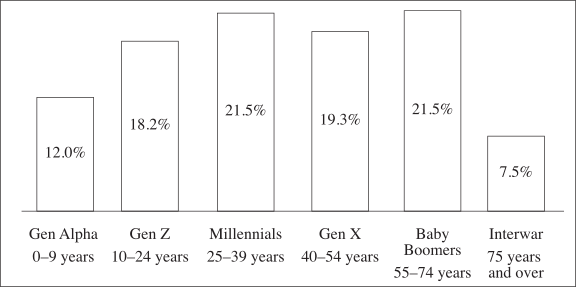
 

The number of people in the 2021 Australian census was \(25\,418\,009\).

Of these, \(812\,728\) identified as Aboriginal and/or Torres Strait Islander people.

Of those who identified as Aboriginal and/or Torres Strait Islander people, 51.1% were aged under 25 years and \(243\,818\) were aged 10–24 years.

What percentage of the Gen Alpha category identified as Aboriginal and/or Torres Strait Islander people?   (3 marks)

--- 7 WORK AREA LINES (style=lined) ---

Show Answers Only

\(\text{Of those who identified as Aboriginal and/or Torres Strait Islander people }\)

\(\text{Number of people under 25 years }=812\,728 \times 0.511=415\,304\)

\(\text{Number in Gen Z}=243\,818 \ \text{(given)}\)

\(\text{Number in Gen Alpha}=415\,304-243\,818=171\,486\)
 

\(\text{Total number in Gen Alpha}=25\,418\,009 \times 0.12=3\,050\,161\)

\(\text{Percentage}=\dfrac{171\,486}{3\,050\,161}=5.6 \%\)

Show Worked Solution

\(\text{Of those who identified as Aboriginal and/or Torres Strait Islander people }\)

\(\text{Number of people under 25 years }=812\,728 \times 0.511=415\,304\)

\(\text{Number in Gen Z}=243\,818 \ \text{(given)}\)

\(\text{Number in Gen Alpha}=415\,304-243\,818=171\,486\)
 

\(\text{Total number in Gen Alpha}=25\,418\,009 \times 0.12=3\,050\,161\)

\(\text{Percentage}=\dfrac{171\,486}{3\,050\,161}=5.6 \%\)

Filed Under: Displaying Data - Bar Charts and Histograms Tagged With: Band 5, smc-6310-10-Bar Charts, syllabus-2027

Networks, STD2 EQ-Bank 26

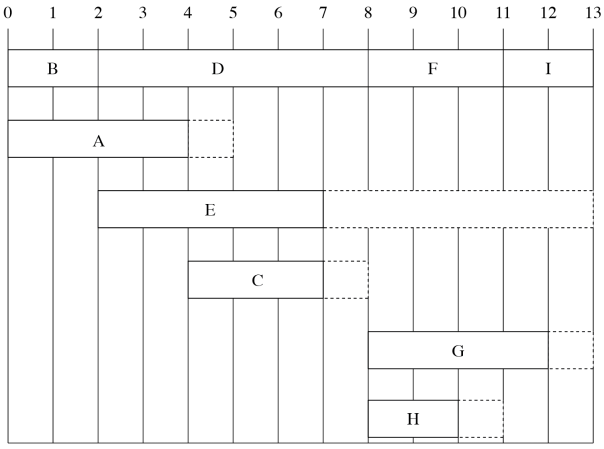
A project requires the completion of 9 activities, \(A\) to \(I\). The project is due to be completed in 13 days.

The directed network diagram shows these activities with their completion times in days.
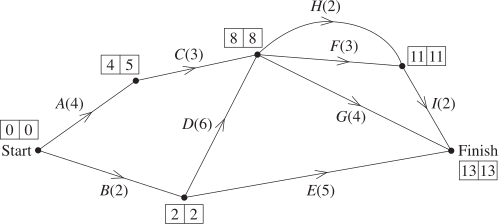


  1. Use the information from the network diagram to complete the Gantt chart, including the critical path and all other activities required for the project.   (3 marks)

    --- 0 WORK AREA LINES (style=lined) ---
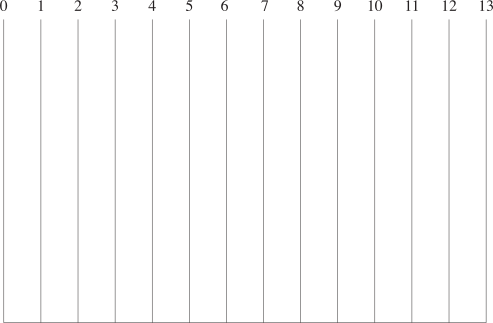
       

  2. List all activities, not on the critical path, which could be occurring at midday on day 8.   (1  mark)

    --- 3 WORK AREA LINES (style=lined) ---

Show Answers Only

a.    
     

b.    \(C\ \text{and}\ E\)

Show Worked Solution

a.    


b.
    \(\text{By inspection of the Gantt chart}\)

\(\text{Activities which could be occurring ~7.5 on chart (midday day 8):}

\(C\ \text{and}\ E\)

Filed Under: Critical Path Analysis (Y12) Tagged With: Band 4, Band 5, smc-6916-35-Gantt Charts, syllabus-2027

Probability, STD2 EQ-Bank 32

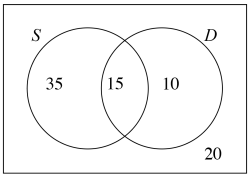
In Year 11 there are 80 students. Of these, 50 play a sport \((S), 25\) are involved in debating ( \(D\) ), and 20 do neither.
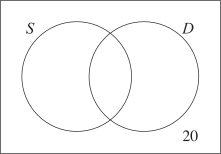
  1. Using this information, complete the Venn diagram.   (2 marks)


  1. A Year 11 student is selected at random.
  2. What is the probability that the student plays a sport and is involved in debating?   (1 mark)

    --- 2 WORK AREA LINES (style=lined) ---

  3. Two Year 11 students are selected at random.
  4. What is the probability that both students are involved in debating only?   (2 marks)

    --- 3 WORK AREA LINES (style=lined) ---

Show Answers Only

a.    \(\text{Venn diagram}\)


b.    \(\dfrac{3}{16}\)

c.    \(\dfrac{9}{632} \)

Show Worked Solution

a.    \(\text{Venn diagram}\)


b.    \(\text{Using the Venn diagram:}\)

\(P\text{(plays both)} = \dfrac{15}{80}=\dfrac{3}{16}\)
 

c.    \(P\text{(both students involved in debating only)}\)

\(=\dfrac{10}{80} \times\ \dfrac{9}{79}=\dfrac{9}{632} (\approx 0.0142)\)

Filed Under: Venn Diagrams and Expected/Relative Frequency Tagged With: Band 4, Band 5, smc-6936-10-Venn Diagrams, syllabus-2027

Algebra, STD2 EQ-Bank 7 MC

The relationship between variables \(x\) and \(y\) is  \(y=k a^x\)  where \(k>0, a>1\)  and \(x\) is measured in days.

The value of \(y\) doubles every week.

Which of the following is closest to the value of \(a\) ?

  1. 1.1
  2. 1.4
  3. 1.7
  4. 2.0
Show Answers Only

\(A\)

Show Worked Solution

\(\text{When}\ \ x=0, \ y=k\)

\(\text{1 week later, when}\ \ x=7:\)

\(\text{Option A:}\ \ y=k \times 1.1^{7}=1.948…\ \text{(almost double)}\)

\(\text{Option B:}\ \ y=k \times 1.14^{7}=10.54…\)

\(\text{Options C and D:}\ \ y \gt 10.54…\)

\(\Rightarrow A\)

Filed Under: Exponential Functions Tagged With: Band 5, smc-6921-10-\(\large y=ka^{x}\)

Statistics, STD2 EQ-Bank 13 MC

Sales of a product on any given day are normally distributed with a mean of $100 and a standard deviation of $8.

Out of 200 days, on how many days would the sales be expected to be between $84 and $108?

  1. 82
  2. 95
  3. 163
  4. 190
Show Answers Only

\(C\)

Show Worked Solution

\(z\text{-score \$84} = \dfrac{84-100}{8}=-2\)

\(z\text{-score \$108} = \dfrac{108-100}{8}=1\)

\(\text{\% days between \(z\)-score 1 and}\ -2 = 68+13.5=81.5% \)

core 2008 VCAA 6-7

\(\text{Number of days} = 0.815 \times 200 = 163\)

\(\Rightarrow C\)

Filed Under: The Normal Distribution (Y12) Tagged With: Band 5, smc-6919-20-z-score Intervals

Financial Maths, STD2 F1 EQ-Bank 32

Mei buys a sedan with a market value of \(\$71\,800\).

Stamp duty is calculated on the vehicle as follows:

    • 3% of market value up to \(\$45\,000\)
    • 5% of market value over \(\$45\,000\)

Calculate the amount of stamp duty payable by Mei.   (2 marks)

--- 5 WORK AREA LINES (style=lined) ---

Show Answers Only

\(\$2690\)

Show Worked Solution

\(\text{Stamp duty on first}\ \$45\,000=0.03\times 45\,000=\$1350\)

\(\text{Amount over}\ \$45\,000=71\,800-45\,000=\$26\,800\)

\(\text{Stamp duty on excess}=0.05\times 26\,800=\$1340\)

\(\therefore\ \text{Total stamp duty}=1350+1340=\$2690\)

Filed Under: Tax and Percentage Increase/Decrease (Std 1-X) Tagged With: Band 5, smc-6967-50-Stamp Duty

Financial Maths, STD2 F1 EQ-Bank 36

Lachlan buys a 4WD with a market value of \(\$58\,200\).

Stamp duty is calculated on the vehicle as follows:

    • 3% of market value up to \(\$45\,000\)
    • 5% of market value over \(\$45\,000\)

Calculate the amount of stamp duty payable by Lachlan.   (2 marks)

--- 5 WORK AREA LINES (style=lined) ---

Show Answers Only

\(\$2010\)

Show Worked Solution

\(\text{Stamp duty on first}\ \$45\,000=0.03\times 45\,000=\$1350\)

\(\text{Amount over}\ \$45\,000=58\,200-45\,000=\$13\,200\)

\(\text{Stamp duty on excess}=0.05\times 13\,200=\$660\)

\(\therefore\ \text{Total stamp duty}=1350+660=\$2010\)

Filed Under: Tax and Percentage Increase/Decrease Tagged With: Band 5, smc-1125-50-Stamp Duty

Financial Maths, STD2 F1 EQ-Bank 30

Aanya is buying a used car with a sale price of \(\$15\,800\). In addition to the sale price, the following costs are charged:

    • transfer of registration $50
    • stamp duty which is calculated at $3 for every $100, or part thereof, of the sale price.

Aanya is considering two loan options to finance the total amount payable for the car.

Loan A 

 - A bank loan with simple interest at 6.5% per annum.

 - Repaid in equal monthly repayments over 4 years.

Loan B

 - A dealership loan with simple interest at 5.8% per annum

 - Repaid in equal monthly repayments over 5 years.
 

  1. Calculate the total amount Aanya needs to borrow.   (1 mark)

    --- 2 WORK AREA LINES (style=lined) ---

  2. Calculate the monthly repayment for each loan option, correct to the nearest cent and identify which loan has the lowest monthly repayment.   (3 marks)

    --- 7 WORK AREA LINES (style=lined) ---

  3. Identify ONE disadvantage of choosing this loan compared to the other.   (1 mark)

    --- 3 WORK AREA LINES (style=lined) ---

Show Answers Only

a.    \(\$16\,324\)

b.  \(\text{Loan B has the lowest monthly repayment (\$350.97 < \$428.51)}\)

c.  \(\text{Loan B costs}\ \ 21\,057.96-20\,568.24=\$489.72\ \ \text{more in total repayments.}\)

Show Worked Solution

a.    \(\text{Calculate total amount to borrow:}\)

\(\text{Stamp duty}=\dfrac{15\,800}{100}\times 3=158\times 3=\$474\)

\(\text{Total borrowed}=15\,800+50+474=\$16\,324\)
 

b.    \(\text{Loan A:}\)

\(I=Prn=16\,324\times 0.065\times 4=\$4244.24\)

\(\text{Total to repay}=16\,324+4244.24=\$20\,568.24\)

\(\text{Monthly repayment}=\dfrac{20\,568.24}{48}=428.505\approx \$428.51\)
 

\(\text{Loan B:}\)

\(I=Prn=16\,324\times 0.058\times 5=\$4733.96\)

\(\text{Total to repay}=16\,324+4733.96=\$21\,057.96\)

\(\text{Monthly repayment}=\dfrac{21\,057.96}{60}=350.966\approx \$350.97\)
 

\(\text{Loan B has the lowest monthly repayment (\$350.97 < \$428.51)}\)
 

c.    \(\text{Consider the total repayments of each loan (see part b):}\)

\(\text{Loan B costs}\ \ 21\,057.96-20\,568.24=\$489.72\ \ \text{more in total repayments.}\)

Filed Under: Tax and Percentage Increase/Decrease Tagged With: Band 4, Band 5, smc-1125-50-Stamp Duty, smc-1125-60-X-topic Loans

Financial Maths, STD2 F1 EQ-Bank 29

A second-hand motorbike has a sale price of \(\$12\,400\). In addition to the sale price, the following costs are charged:

  • transfer of registration $85
  • stamp duty which is calculated at $4.50 for every $100, or part thereof, of the sale price.

Jordan borrows the total amount to be paid for the motorbike, including transfer of registration and stamp duty. Simple interest at the rate of 8.5% per annum is charged on the loan. The loan is to be repaid in equal monthly repayments over 2 years.

Calculate Jordan's monthly repayment, correct to the nearest cent. (5 marks)

--- 7 WORK AREA LINES (style=lined) ---

Show Answers Only

\(\$635.85\)

Show Worked Solution

\(\text{Stamp duty}=\dfrac{12\,400}{100}\times 4.5=\$558\)

\(\text{Total borrowed}=12\,400+85+558=\$13\,043\)

\(\text{Interest} =Prn=13\,043\times 0.085\times 2=\$2217.31\)

\(\text{Total to repay}=13\,043+2217.31=\$15\,260.31\)

 
\(\therefore\ \text{Monthly repayment}=\dfrac{15\,260.31}{24}=635.846\approx \$635.85\)

Filed Under: Tax and Percentage Increase/Decrease Tagged With: Band 4, Band 5, smc-1125-50-Stamp Duty, smc-1125-60-X-topic Loans

Financial Maths, STD1 F3 2025 HSC 24 v1

A used car has a sale price of \(\$18\,600\). In addition to the sale price, the following costs are charged:

  • transfer of registration $50
  • stamp duty which is calculated at $3 for every $100, or part thereof, of the sale price.

Tahlia borrows the total amount to be paid for the car, including transfer of registration and stamp duty. Simple interest at the rate of 7.2% per annum is charged on the loan. The loan is to be repaid in equal monthly repayments over 4 years.

Calculate Tahlia's monthly repayment, correct to the nearest cent.   (5 marks)

--- 12 WORK AREA LINES (style=lined) ---

Show Answers Only

\(\$515.41\)

Show Worked Solution

\(\text{Stamp duty}=\dfrac{18\,600}{100}\times 3=\$558\)

\(\text{Total borrowed}=18\,600+50+558=\$19\,208\)

\(\text{Interest}=Prn=19\,208\times 0.072\times 4=\$5531.904\)

\(\text{Total to repay}=19\,208+5531.904=\$24\,739.904\)

 
\(\therefore\ \text{Monthly repayment}=\dfrac{24\,739.904}{48}=515.4146…\approx \$515.41\)

Filed Under: Tax and Percentage Increase/Decrease (Std 1-X) Tagged With: Band 4, Band 5, smc-6967-50-Stamp Duty, smc-6967-60-X-topic Loans

Financial Maths, STD1 F1 2025 HSC 19 v2

At the end of the 2024-2025 financial year, Hannah had a gross annual salary of \(\$78\,500\). She had allowable tax deductions totalling $2,300 for work-related expenses.

\(\begin{array} {|l|l|}\hline \rule{0pt}{2.5ex}\text{ Taxable income}\rule[-1ex]{0pt}{0pt} & \text{ Tax payable}\\\hline \rule{0pt}{2.5ex}\text{\$0 – \$18 200}\rule[-1ex]{0pt}{0pt} & \text{Nil}\\\hline \rule{0pt}{2.5ex}\text{\$18 201 – \$45 000}\rule[-1ex]{0pt}{0pt} & \text{16 cents for each \$1 over \$18 200}\\\hline\rule{0pt}{2.5ex}\text{\$45 001 – \$135 000}\rule[-1ex]{0pt}{0pt} & \text{\$4288 plus 30 cents for each \$1 over \$45 000}\\\hline\rule{0pt}{2.5ex}\text{\$135 001 – \$190 000}\rule[-1ex]{0pt}{0pt} & \text{\$31 288 plus 37 cents for each \$1 over \$135 000}\\\hline\rule{0pt}{2.5ex}\text{\$190 001 and over}\rule[-1ex]{0pt}{0pt} & \text{\$51 638 plus 45 cents for each \$1 over \$190 000}\\\hline\end{array}\)


The Medicare levy is 2% of taxable income. During the year, Hannah paid $1,250 per month in Pay As You Go (PAYG) tax.

Determine whether Hannah will receive a tax refund or owe money to the Australian Taxation Office. Justify your answer with calculations.    (4 marks)

--- 7 WORK AREA LINES (style=lined) ---

Show Answers Only

\(\text{Hannah owes}\ \$172\ \text{to the ATO.}\)

Show Worked Solution

\(\text{Taxable income}=78\,500-2300=\$76\,200\)

\(\text{Tax payable}\) \(=4288+0.30\times (76\,200-45\,000)\)
  \(=4288+0.30\times 31\,200\)
  \(=4288+9360\)
  \(=\$13\,648\)

 
\(\text{Medicare levy}=0.02\times 76\,200=\$1524\)

\(\text{Total tax + Medicare}=13\,648+1524=\$15\,172\)

\(\text{Total PAYG paid}=1250\times 12=\$15\,000\)

\(\therefore\ \text{Hannah owes}\ \ 15\,172-15\,000=\$172\ \ \text{to the ATO.}\)

Filed Under: Tax and Percentage Increase/Decrease (Std 1-X) Tagged With: Band 5, smc-6967-10-Tax Tables, smc-6967-40-Medicare

Financial Maths, STD2 F1 EQ-Bank 28

At the end of the 2024-2025 financial year, Marcus had a taxable income of $168 000.

  1. The table shows the income tax rate for Australian residents for the 2024-2025 financial year.

\(\begin{array} {|l|l|}\hline \rule{0pt}{2.5ex}\text{ Taxable income}\rule[-1ex]{0pt}{0pt} & \text{ Tax payable}\\\hline \rule{0pt}{2.5ex}\text{\$0 – \$18 200}\rule[-1ex]{0pt}{0pt} & \text{Nil}\\\hline \rule{0pt}{2.5ex}\text{\$18 201 – \$45 000}\rule[-1ex]{0pt}{0pt} & \text{16 cents for each \$1 over \$18 200}\\\hline\rule{0pt}{2.5ex}\text{\$45 001 – \$135 000}\rule[-1ex]{0pt}{0pt} & \text{\$4288 plus 30 cents for each \$1 over \$45 000}\\\hline\rule{0pt}{2.5ex}\text{\$135 001 – \$190 000}\rule[-1ex]{0pt}{0pt} & \text{\$31 288 plus 37 cents for each \$1 over \$135 000}\\\hline\rule{0pt}{2.5ex}\text{\$190 001 and over}\rule[-1ex]{0pt}{0pt} & \text{\$51 638 plus 45 cents for each \$1 over \$190 000}\\\hline\end{array}\)

  1. Using the table, calculate Marcus's tax payable.   (3 marks)

    --- 7 WORK AREA LINES (style=lined) ---

  2. The Medicare levy is 2% of taxable income.
  3. Calculate the Medicare levy payable by Marcus.   (1 mark)

    --- 3 WORK AREA LINES (style=lined) ---

Show Answers Only

a.    \(\$43\,498\)

b.    \(\$3360\)

Show Worked Solution

a.    \(\text{Calculate tax payable:}\)

\(\text{Tax payable}\) \(=31\,288+0.37\times (168\,000-135\,000)\)
  \(=31\,288+0.37\times 33\,000\)
  \(=31\,288+12\,210\)
  \(=\$43\,498\)


b.    \(\text{Calculate Medicare levy:}\)

\(\text{Medicare levy}=0.02\times 168\,000=\$3360\)

Filed Under: Tax and Percentage Increase/Decrease Tagged With: Band 4, Band 5, smc-1125-10-Tax Tables, smc-1125-40-Medicare Levy

Financial Maths, STD1 F1 2025 HSC 19 v1

At the end of the 2024-2025 financial year, Priya's taxable income was $92 400.

  1. The table shows the income tax rate for Australian residents for the 2024-2025 financial year.

\begin{array} {|l|l|}
\hline
\rule{0pt}{2.5ex}\text{    Taxable income}\rule[-1ex]{0pt}{0pt} & \text{    Tax payable}\\
\hline
\rule{0pt}{2.5ex}\text{\$0 – \$18 200}\rule[-1ex]{0pt}{0pt} & \text{Nil}\\
\hline
\rule{0pt}{2.5ex}\text{\$18 201 – \$45 000}\rule[-1ex]{0pt}{0pt} & \text{16 cents for each \$1 over \$18 200}\\
\hline
\rule{0pt}{2.5ex}\text{\$45 001 – \$135 000}\rule[-1ex]{0pt}{0pt} & \text{\$4288 plus 30 cents for each \$1 over \$45 000}\\
\hline
\rule{0pt}{2.5ex}\text{\$135 001 – \$190 000}\rule[-1ex]{0pt}{0pt} & \text{\$31 288 plus 37 cents for each \$1 over \$135 000}\\
\hline
\rule{0pt}{2.5ex}\text{\$190 001 and over}\rule[-1ex]{0pt}{0pt} & \text{\$51 638 plus 45 cents for each \$1 over \$190 000}\\
\hline
\end{array}

  1. Using the table, calculate Priya's tax payable.   (3 marks)

    --- 6 WORK AREA LINES (style=lined) ---

  2. The Medicare levy is 2% of taxable income.
  3. Calculate the Medicare levy payable by Priya.   (1 mark)

    --- 3 WORK AREA LINES (style=lined) ---

Show Answers Only

a.    \(\$18\,508\)

b.    \(\$1848\)

Show Worked Solution

a.    \(\text{Calculate tax payable:}\)

\(\text{Tax payable}\) \(=4288+0.30\times (92\,400-45\,000)\)
  \(=4288+0.30\times 47\,400\)
  \(=4288+14\,220\)
  \(=\$18\,508\)


b.    \(\text{Calculate Medicare levy:}\)

\(\text{Medicare levy}=0.02\times 92\,400=\$1848\)

Filed Under: Tax and Percentage Increase/Decrease (Std 1-X) Tagged With: Band 4, Band 5, smc-6967-10-Tax Tables, smc-6967-40-Medicare

Financial Maths, STD2 F1 EQ-Bank 15 MC

Ethan earned $546 for a 7-hour shift after his hourly pay rate increased by 4%.

What was his hourly pay rate before the increase?

  1. $72.80
  2. $74.88
  3. $75.00
  4. $78.00
Show Answers Only

\(C\)

Show Worked Solution

\(\text{New hourly rate}=\dfrac{546}{7}=\$78.00\)

\(\text{Let}\ \ h=\ \text{original hourly rate}\)

\(h \times 1.04\) \(=\$78.00\)  
\(h\) \(=\dfrac{78.00}{1.04}=\$75.00\)  

 
\(\Rightarrow C\)

Filed Under: Tax and Percentage Increase/Decrease Tagged With: Band 5, smc-1125-30-% Increase/Decrease

Financial Maths, STD1 F1 EQ-Bank 4 MC v1

A car salesperson at a Sydney dealership earns commission on a sliding scale:

  • 4% on the first $20 000 of monthly sales
  • 6% on the next $30 000 of monthly sales
  • 8% on any amount above $50 000 of monthly sales.

Last month, the salesperson made total sales of $72 000.

Calculate the salesperson's commission for the month.   (2 marks)

--- 6 WORK AREA LINES (style=lined) ---

Show Answers Only

\(\$4360\)

Show Worked Solution

\(\text{Commission on first}\ \$20\,000=0.04\times 20\,000=\$800\)

\(\text{Commission on next}\ \$30\,000=0.06\times 30\,000=\$1800\)

\(\text{Sales above}\ \$50\,000= 72\,000- 50\,000=\$22\,000\)

\(\text{Commission on}\ \$22\,000=0.08\times 22\,000=\$1760\)

\(\text{Total commission}= 800+ 1800+ 1760=\$4360\)

Filed Under: Earning Money and Budgeting Tagged With: Band 5, smc-1126-20-Commission

Financial Maths, STD1 F1 EQ-Bank 29

A tutoring business charges $44 per hour for one-on-one lessons. The price includes 10% GST.

  1. Calculate the amount of GST included in a single one-hour lesson.   (1 mark)

    --- 2 WORK AREA LINES (style=lined) ---

  2. In one week, the tutor delivers 25 one-hour lessons. The tutor's costs for the week are $200 for printing, equipment and travel. Calculate the tutor's profit for the week.   (2 marks)

    --- 4 WORK AREA LINES (style=lined) ---

Show Answers Only

a.    \(\$4.00\)

b.    \(\$900\)

Show Worked Solution

a.    \(\text{Calculate GST component:}\)

\(\text{GST is included in the price, so divide by 11:}\)

\(\text{GST}=\dfrac{44}{11}=\$4.00\)


b.    \(\text{Calculate profit:}\)

\(\text{Revenue}=25\times 44=\$1100\)

\(\text{Profit}= 1100- 200=\$900\)

Filed Under: Earning Money and Budgeting Tagged With: Band 4, Band 5, smc-1126-30-Budgeting

Financial Maths, STD1 F1 2022 HSC 7 MC v1

Sienna works a 40-hour week at a Bunnings warehouse and is paid at an hourly rate of $25. Any overtime hours worked are paid at time-and-a-half.

In a particular week, she earned $1450.

How many hours in total did Sienna work in this week to earn this amount?

  1. 12
  2. 38.6
  3. 52
  4. 58
Show Answers Only

\(C\)

Show Worked Solution

\(\text{Normal pay}=40\times 25=\$1000\)

\(\text{Overtime pay earned}= 1450-1000=\$450\)

\(\text{Overtime rate}= 25\times1.5=\$37.50\ \text{per hour}\)

\(\text{Overtime hours}=\dfrac{450}{37.50}=12\ \text{hours}\)

\(\text{Total hours}=40+12=52\ \text{hours}\)

\(\Rightarrow C\)

Filed Under: Earning Money and Budgeting (Std 1-X) Tagged With: Band 5, smc-6966-10-Wages

Financial Maths, STD1 F1 EQ-Bank 30

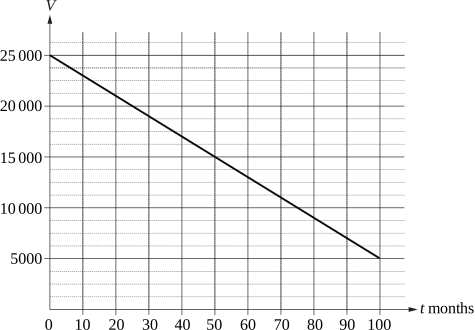
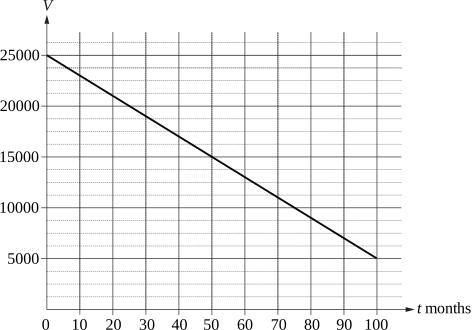
Hugo purchased a jet ski for $25 000. The value of the jet ski decreases according to a linear model. The graph shows the value of the jet ski, $\(V\), against the time, \(t\) months, since it was purchased.
 

  1. By how much does the value of the jet ski decrease every 10 months?   (1 mark)

    --- 2 WORK AREA LINES (style=lined) ---

  2. Find the value of the jet ski after 6 years.   (1 mark)

    --- 1 WORK AREA LINES (style=lined) ---

  3. Identify ONE problem with using this model to determine the value of Hugo's jet ski over time.   (1 mark)

    --- 2 WORK AREA LINES (style=lined) ---

Show Answers Only

a.    \(\$2000\)

b.    \(\$10\,600\)

c.    \(\text{Jet ski will have a negative value after 125 months.}\)

Show Worked Solution

a.    \(\text{Total decrease over 100 months}= 25\,000-5000= \$20\,000\)

\(\text{Decrease per 10 months}= \dfrac{10}{100} \times 20\,000 = \$2000\)
 

b.    \(\text{6 years} = 6 \times 12 = 72\ \text{months}\)

\(\text{Depreciation rate}= \$200\ \text{per month}\)

\(V = 25\,000-(200 \times 72)=\$10\,600\)
 

c.    \(\text{Model limitations:}\)

\(\text{The linear model predicts the jet ski’s value reaches \$0 at 125 months and negative}\)

\(\text{values beyond that, which is unrealistic.}\)

Filed Under: Simple Interest and S/L Depreciation Tagged With: Band 4, Band 5, smc-1124-20-Straight-line Depreciation

Financial Maths, STD1 F1 EQ-Bank 32

Zoe purchased a new ute for $36 000. The straight-line depreciation model used by her accountant assumes the ute decreases in value by $4800 each year.

  1. Use the straight-line depreciation formula  \(S = V_0-Dn\)  to find the salvage value of the ute after 5 years.   (1 mark)

    --- 2 WORK AREA LINES (style=lined) ---

  2. After how many full years will the model predict the ute is worth less than $10 000?   (2 marks)

    --- 4 WORK AREA LINES (style=lined) ---

  3. Zoe's accountant suggests that this straight-line model may not be appropriate for predicting the ute's value beyond 7 years. Give ONE reason why the model may not be suitable for long-term predictions.   (1 mark)

    --- 2 WORK AREA LINES (style=lined) ---

Show Answers Only

a. \(\$12\,000\)

b. \(\text{After 6 full years}\)

c.    \(\text{Model limitations}\)

\(\text{Consider the expected value of the ute at}\ \ t=8:\)

\(S=36\,000-4800 \times 8=-\$2400\)

\(\text{The model predicts negative values in the long term which is unrealistic.}\)

Show Worked Solution

a.    \(\text{Find salvage value:}\)

\(S\) \(= V_0-Dn\)
  \(= 36\,000-4800 \times 5\)
  \(= \$12\,000\)


b.    \(\text{Find}\ n\ \text{when}\ \ S<10\,000:\)

\(S\) \(< 10\,000\)
\(36\,000-4800n\) \(< 10\,000\)
\(26\,000\) \(< 4800n\)
\(n\) \(> \dfrac{26\,000}{4800}= 5.4166…\)

 
\(\therefore\ n=6\ \text{full years}\)
 

c.    \(\text{Model limitations}\)

\(\text{Consider the expected value of the ute at}\ \ t=8:\)

\(S=36\,000-4800 \times 8=-\$2400\)

\(\text{The model predicts negative values in the long term which is unrealistic.}\)

Filed Under: Simple Interest and S/L Depreciation Tagged With: Band 5, Band 6, smc-1124-20-Straight-line Depreciation

Financial Maths, STD1 F1 EQ-Bank 9 MC

Mia bought a used Toyota HiLux for $42 000. The ute depreciates at a rate of 30 cents per kilometre travelled. Mia plans to sell the ute when its value reaches $24 000.

How many kilometres can Mia drive before she needs to sell the ute?

  1. 18 000 km
  2. 60 000 km
  3. 80 000 km
  4. 140 000 km
Show Answers Only

\(B\)

Show Worked Solution

\(\text{Total depreciation allowed} = 42\,000-24\,000=\$18\,000\)

\(\text{Using Total depreciation} = D \times n:\)

\(n=\dfrac{18\,000}{0.30}=60\,000\ \text{km}\)

\(\Rightarrow B\)

Filed Under: Simple Interest and S/L Depreciation Tagged With: Band 5, smc-1124-20-Straight-line Depreciation

Financial Maths, STD1 F1 EQ-Bank 8 MC

Ava is saving for a trip to Bali. She invests an amount of money at a simple interest rate of 3.5% per annum. After 2 years, she has earned $210 in interest.

How much money did Ava originally invest?

  1. $1470
  2. $2100
  3. $3000
  4. $6000
Show Answers Only

\(C\)

Show Worked Solution

\(I=\$210,\ r=3.5\%=0.035,\ n=2\ \text{years}\)

\(\text{Using}\ \ I=Prn\ \ \text{to find}\ P:\)

\(I\) \(=Prn\)  
\(P\) \(=\dfrac{I}{r \times n}=\dfrac{210}{0.035 \times 2}=\$3000\)  

 
\(\Rightarrow C\)

Filed Under: Simple Interest and S/L Depreciation Tagged With: Band 5, smc-1124-10-Simple Interest

Algebra, STD1 EQ-Bank 25

A scientist is studying a colony of bacteria in a laboratory. At the start of the experiment there are 500 bacteria.

Each hour the number of bacteria is modelled to be 1.25 times the number of the previous hour.

Let  \(t=0\)  be the start of the experiment.

  1. By first completing the table of values below, draw a graph showing how the bacteria population is modelled from  \(t=0\)  to  \(t=8\) hours.   (3 marks)

    --- 0 WORK AREA LINES (style=lined) ---

\(\begin{array}{|l|c|c|c|c|c|} \hline \rule{0pt}{2.5ex}t \ \text{(hours)} \rule[-1ex]{0pt}{0pt}& \ \ \quad 0 \ \ \quad & \ \ \quad 1 \ \ \quad & \ \ \quad 2 \ \ \quad & \ \ \quad 4 \ \ \quad & \ \ \quad 8 \ \ \quad \\ \hline \rule{0pt}{2.5ex}\text{Number of bacteria} \rule[-1ex]{0pt}{0pt}& 500 & & & & \\ \hline \end{array}\)
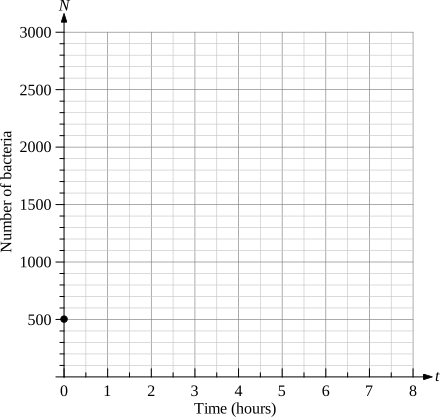


  1. Using your graph from (a), or otherwise, determine after how many hours the bacteria population first exceeds 2000.   (1 mark)

    --- 2 WORK AREA LINES (style=lined) ---

Show Answers Only

a.    \(\text{Table of values:}\)

\(\text{Number of bacteria} = 500 \times 1.25^t\)

\(\begin{array}{|l|c|c|c|c|c|} \hline \rule{0pt}{2.5ex}t \ \text{(hours)} \rule[-1ex]{0pt}{0pt}& \ \ \quad 0 \quad \ \ & \ \ \quad 1 \ \ \quad & \ \ \quad 2 \ \ \quad & \ \ \quad 4 \ \ \quad & \ \ \quad 8 \ \ \quad \\ \hline \rule{0pt}{2.5ex}\text{Number of bacteria} \rule[-1ex]{0pt}{0pt}& 500 & \textbf{625} & \textbf{781} & \textbf{1221} & \textbf{2980} \\ \hline \end{array}\)
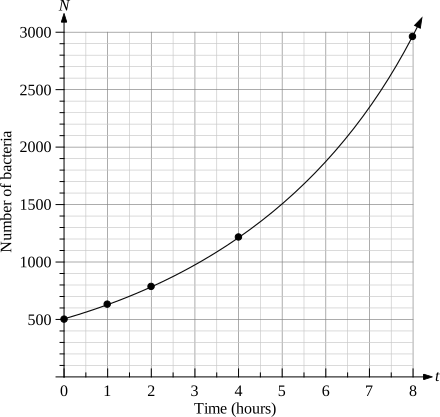
 

b.    \(\text{From the graph, the bacteria population reaches 2000 at approximately }\ t \approx 6.25 \ \text{hours.}\)

Show Worked Solution

a.    \(\text{Table of values:}\)

\(\text{Number of bacteria} = 500 \times 1.25^t\)

\(\begin{array}{|l|c|c|c|c|c|} \hline \rule{0pt}{2.5ex}t \ \text{(hours)} \rule[-1ex]{0pt}{0pt}& \ \ \quad 0 \quad \ \ & \ \ \quad 1 \ \ \quad & \ \ \quad 2 \ \ \quad & \ \ \quad 4 \ \ \quad & \ \ \quad 8 \ \ \quad \\ \hline \rule{0pt}{2.5ex}\text{Number of bacteria} \rule[-1ex]{0pt}{0pt}& 500 & \textbf{625} & \textbf{781} & \textbf{1221} & \textbf{2980} \\ \hline \end{array}\)
 

b.    \(\text{From the graph, the bacteria population reaches 2000 at approximately }\ t \approx 6.25 \ \text{hours.}\)

Filed Under: Graphs of Practical Situations Tagged With: Band 4, Band 5, smc-6840-10-Non-linear Graphs

Algebra, STD1 EQ-Bank 26

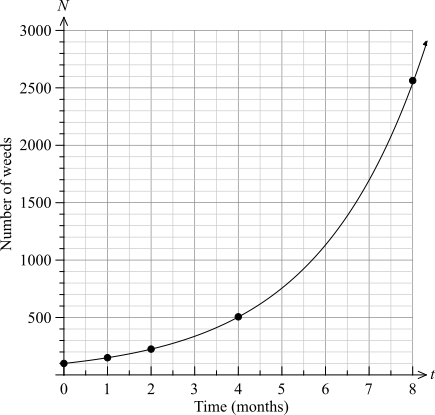
Rangers at a nature reserve are monitoring the spread of an invasive weed. At the start of monitoring there are 100 weeds. The number of weeds is growing at a rate of 50% per month.

Let  \(N\) = number of weeds, and  \(t\) = time in months.

  1. Complete the table of values below that models the growth of the weeds over an 8 month period. Round all answers to the nearest whole number.   (2 marks)
      
    \(\begin{array}{|c|c|c|c|c|c|} \hline \vphantom{\dfrac{1}{1}}\quad t \quad & \quad 0 \quad & \quad 1 \quad & \quad 2 \quad & \quad 4 \quad & \quad 8 \quad \\[6pt] \hline \vphantom{\dfrac{1}{1}}N & 100 & & & & \\[12pt] \hline \end{array}\)

    --- 3 WORK AREA LINES (style=lined) ---

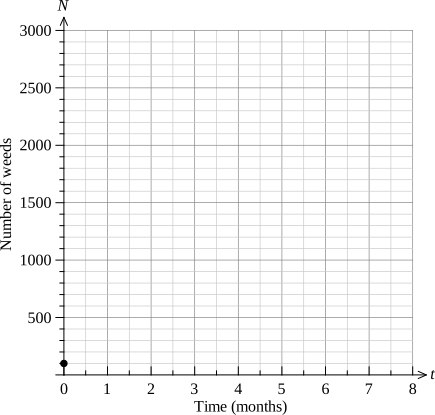
  2. Using the table of values from (a), neatly plot the points and join with a smooth curve.   (2 marks)

    --- 0 WORK AREA LINES (style=lined) ---
      

Show Answers Only

a.    \(\text{Table of values:}\)

\begin{array}{|c|c|c|c|c|c|} \hline \quad t \quad & \quad 0 \quad & \quad 1 \quad & \quad 2 \quad & \quad 4 \quad & \quad 8 \quad  \\[6pt] \hline \ N  & 100 & 150 & 225 & 506 & 2563 \\[6pt] \hline \end{array} 

b.      
   

Show Worked Solution

a.    \(\text{Table of values:}\)

\begin{array}{|c|c|c|c|c|c|} \hline \quad t \quad & \quad 0 \quad & \quad 1 \quad & \quad 2 \quad & \quad 4 \quad & \quad 8 \quad  \\[6pt] \hline \ N  & 100 & 150 & 225 & 506 & 2563 \\[6pt] \hline \end{array}

\(\text{Algebraic method}\)

\(\text{Formula:  }\ N=100\times1.5^t\)

\(t=0:\ N=100\times1.5^{0}=100\)

\(t=1:\ N=100\times1.5^{1}=150\)

\(t=2:\ N=100\times1.5^{2}=225\)

\(t=4:\ N=100\times1.5^{4}=506.25\approx506\)

\(t=8:\ N=100\times1.5^{8}=2562.89\ldots\approx2563\)
  

\(\text{Using CASIO calculator with constant multiplier}\)

\begin{array} {|c|c|c|c|}
\hline t & \text{Input} & \text{Output}\ (N) & \text{Rounded}\ (N) \\
\hline {0} & 100= & 100 & 100 \\
\hline {1} & \text{Ans}\times 1.5= & 150  & 150 \\
\hline {2} & = & 225 & 225 \\
\hline {4} & = & 506.25 & 506 \\
\hline {8} & = & 2562.890625 & {2563} \\
\hline \end{array}  

b.      


Filed Under: Graphs of Practical Situations Tagged With: Band 4, Band 5, smc-6840-10-Non-linear Graphs

Algebra, STD1 EQ-Bank 27

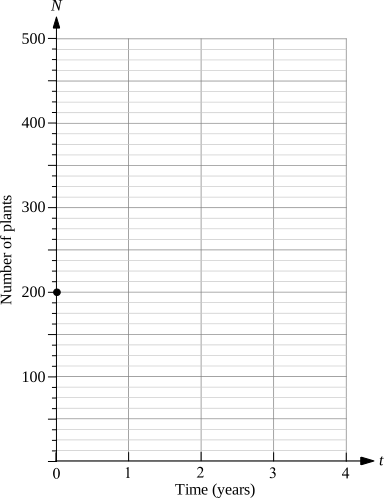
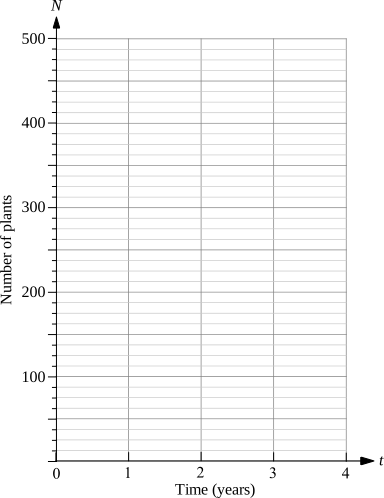
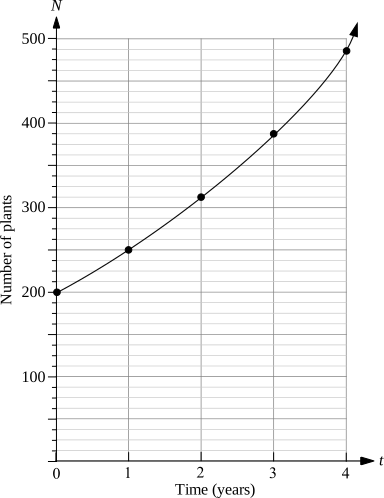
A conservation program is tracking the recovery of a native wildflower species in a national park. At the start of the program there are 200 plants. The number of plants is predicted to grow at a rate of 25% per year.

Let  \(N\) = number of plants, and  \(t\) = time in years.

  1. Complete the table of values below that models the growth of the plants. Round all answers to the nearest whole number.   (2 marks)
    \begin{array}{|c|c|c|c|c|c|}
    \hline
    \rule{0pt}{2.5ex}\quad t \quad \rule[-1ex]{0pt}{0pt}& \quad 0 \quad & \quad 1 \quad& \quad 2 \quad & \quad 3 \quad & \quad 4 \quad \\
    \hline
    \rule{0pt}{2.5ex}N \rule[-1ex]{0pt}{0pt}& 200 & & & & \\
    \hline
    \end{array}

    --- 3 WORK AREA LINES (style=lined) ---

  2. Using the table of values from (a), neatly plot the points and join with a smooth curve.   (2 marks)

    --- 0 WORK AREA LINES (style=lined) ---


Show Answers Only

a.    \(\text{Table of values:}\)

\begin{array}{|c|c|c|c|c|c|}
\hline
\rule{0pt}{2.5ex}\quad t \quad \rule[-1ex]{0pt}{0pt}& \quad 0 \quad & \quad 1 \quad& \quad 2 \quad & \quad 3 \quad & \quad 4 \quad \\
\hline
\rule{0pt}{2.5ex}N \rule[-1ex]{0pt}{0pt}& 200 & & & & \\
\hline
\end{array}

b.     
Show Worked Solution

a.    \(\text{Table of values:}\)

\begin{array}{|c|c|c|c|c|c|}
\hline
\rule{0pt}{2.5ex}\quad t \quad \rule[-1ex]{0pt}{0pt}& \quad 0 \quad & \quad 1 \quad& \quad 2 \quad & \quad 3 \quad & \quad 4 \quad \\
\hline
\rule{0pt}{2.5ex}N \rule[-1ex]{0pt}{0pt}& 200 & & & & \\
\hline
\end{array}

\(\text{Algebraic method}\)

\(\text{Formula:   }\ N=200\times1.25^t\)

\(t=0:\ N=200\times1.25^{0}=200\)

\(t=1:\ N=200\times1.25^{1}=250\)

\(t=2:\ N=200\times1.25^{2}=312.5\approx313\)

\(t=3:\ N=200\times1.25^{3}=390.625\approx391\)

\(t=4:\ N=200\times1.25^{4}=488.28\ldots\approx488\)
  

\(\text{Using CASIO calculator with constant multiplier}\)

\begin{array} {|c|c|c|c|}
\hline t & \text{Input} & \text{Output}\ (N) & \text{Rounded}\ (N) \\
\hline \colorbox{lightblue}{0} & 200= & 200 & \colorbox{lightblue}{200} \\
\hline \colorbox{lightblue}{1} & \text{Ans}\times 1.25= & 250  & \colorbox{lightblue}{250} \\
\hline \colorbox{lightblue}{2} & = & 312.5 & \colorbox{lightblue}{313} \\
\hline \colorbox{lightblue}{3} & = & 390.625 & \colorbox{lightblue}{391} \\
\hline \colorbox{lightblue}{4} & = & 488.28\ldots & \colorbox{lightblue}{488} \\
\hline \end{array}  

b.     


Filed Under: Graphs of Practical Situations Tagged With: Band 4, Band 5, smc-6840-10-Non-linear Graphs

Algebra, STD1 EQ-Bank 24

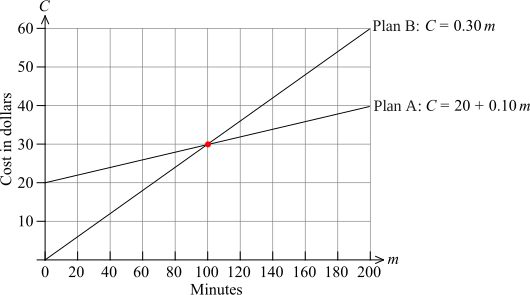
Zara is looking for a new mobile phone plan. She has found two plans that suit her needs and wants to work out which plan is cheaper depending on how many minutes she uses.

Plan \(\text{A}\):   $20 per month fixed charge plus $0.10 per minute

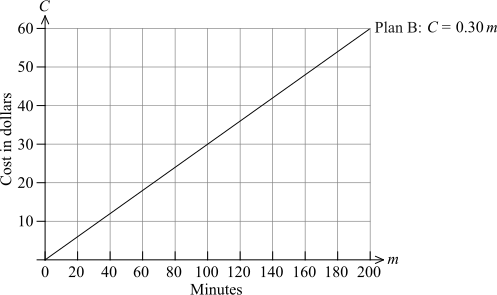
Plan \(\text{B}\):  $0.30 per minute, no fixed charge

Let  \(C\) = total monthly cost in dollars, and  \(m\) = number of minutes used.

  1. Plan \(\text{B}\) can be modelled by the equation  \(C=0.30m\).
  2. Write an equation for the monthly cost of Plan \(\text{A}\).   (1 mark)

    --- 2 WORK AREA LINES (style=lined) ---

  3. The graph of Plan \(\text{B}\) is provided on the grid below. Use the equation from (a) to add the graph of Plan \(\text{A}\) to the grid.   (2 marks)

    --- 3 WORK AREA LINES (style=lined) ---
      
  4. For how many minutes per month do both plans cost the same amount?   (1 mark)

    --- 5 WORK AREA LINES (style=lined) ---

  5. Zara uses an average of 140 minutes per month.
  6. Which plan she should choose and how much does she save compared to the other plan.   (1 mark)

    --- 4 WORK AREA LINES (style=lined) ---

Show Answers Only

a.    \(\text{Plan A: }C=20+0.10m\)

b.    

c.    \(100\ \text{minutes}\)

d.    \(\text{Plan A, cheaper by } \$8\)

Show Worked Solution

a.    \(\text{Plan A: }\ C=20+0.10m\)
  

b.    \(\text{Table of values}\)

\(\begin{array}{|c|c|c|c|c|c|} \hline m & 0 & 50 & 100 & 150 & 200 \\ \hline \text{Plan A} & 20 & 25 & 30 & 35 & 40 \\ \hline \end{array}\)


c.    \(\text{From the graph, the lines intersect at }\ m=100.\)

\(\therefore\ \text{Both plans cost the same at } 100\ \text{minutes}\)
  

d.    \(\text{Plan A:   }\ C=20+0.10\times140=\$34\)

\(\text{Plan B:   }\ C=0.30\times140=\$42\)

\(\text{Difference} = 42-34=\$8\)

\(\therefore\ \text{Zara should choose Plan A, which is \$8 cheaper than Plan B.}\)

Filed Under: Simultaneous Linear Equations Tagged With: Band 3, Band 4, Band 5, smc-6839-20-Other SE Applications, smc-6839-30-Find Intersection

Algebra, STD1 EQ-Bank 36

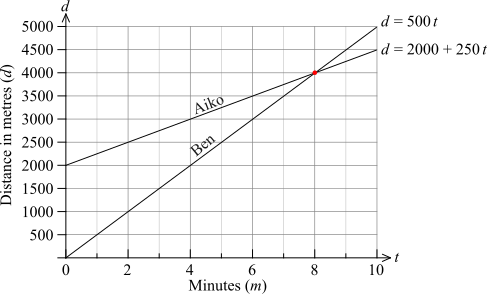
Two cyclists, Aiko and Ben, are riding along the same straight track in the same direction.

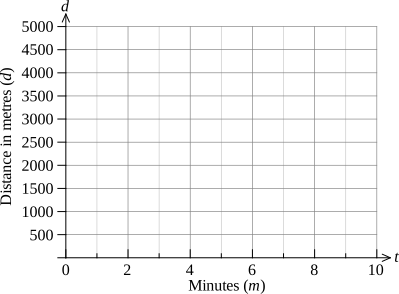
Aiko starts 2000 m ahead of Ben. Aiko rides at a constant speed of 250 metres/minute and Ben rides at a constant speed of 500 metres/minute.

Let    \(d\) = distance from the starting point in metres, and 

   \(t\) = time in minutes.

  1. The equation  \(d=2000+250t\)  models Aiko's distance from the starting point.
  2. Write an equation to model Ben's distance.   (1 mark)

    --- 2 WORK AREA LINES (style=lined) ---

  3. Use the equations from (a) to graph Aiko and Ben's journeys on the grid below.   (2 marks)

    --- 3 WORK AREA LINES (style=lined) ---
      
  4. After how many minutes does Ben catch Aiko?   (1 mark)

    --- 1 WORK AREA LINES (style=lined) ---

  5. How far has each cyclist travelled from their own starting point when they meet?   (2 marks)

    --- 4 WORK AREA LINES (style=lined) ---

Show Answers Only

a.    \(d=500t\)

b.    

c.    \(8\ \text{minutes}\)

d.    \(\text{Aiko travelled 2000 m, Ben travelled 4000 m.}\)

Show Worked Solution

a.    \(d=500t\)

b.    \(\text{Table of values:}\)

\(\begin{array}{|c|c|c|c|c|c|c|} \hline t & 0 & 2 & 4 & 6 & 8 & 10 \\ \hline \text{Aiko} & 2000 & 2500 & 3000 & 3500 & 4000 & 4500 \\ \hline \text{Ben} & 0 & 1000 & 2000 & 3000 & 4000 & 5000 \\ \hline \end{array}\)
 

c.    \(\text{From the graph, the lines intersect at }\ t=8.\)

\(\therefore\ \text{Ben catches Aiko after 8 minutes}\)
 

d.    \(\text{When}\ \ t=8, d=4000:\)

\(\text{Aiko started 2000 m ahead, so the distance travelled}\)

\(=4000-2000=2000\ \text{m}\)

\(\text{Ben started at the origin, so the distance travelled =4000 m}\)

Filed Under: Simultaneous Linear Equations Tagged With: Band 4, Band 5, Band 6, smc-6839-20-Other SE Applications, smc-6839-30-Find Intersection

Algebra, STD1 EQ-Bank 34

Two water tanks sit side by side on a farm.

Tank A has a capacity of 1000 litres and is full. It is being emptied at a constant rate of 60 litres per minute.

At the same time, Tank B is empty and is being filled at a constant rate of 40 litres per minute.

Let    \(V\) = volume of water in litres, and 

   \(t\) = time in minutes.

  1. The equation  \(V=1000-60t\)  models the volume of water in Tank A.
  2. Write an equation to model the volume of water in Tank B.   (1 mark)

    --- 2 WORK AREA LINES (style=lined) ---
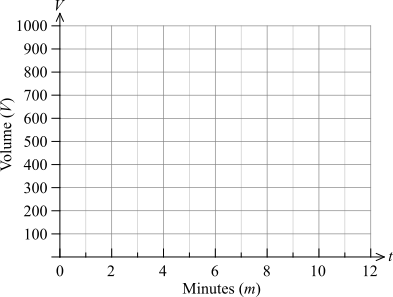
  3. Complete the table below and use the values to graph the volume of water in Tank A and Tank B on the grid below.   (3 marks)
     
          \(\begin{array}{|c|c|c|c|c|c|c|c|} \hline t & 0 & 2 & 4 & 6 & 8 & 10 & 12 \\ \hline \text{Tank A} & \ \ \ \ \ \ \ \  & 880 & 760 & 640 & 520 & 400 & 280 \\ \hline \text{Tank B} & 0 & \ \ \ \ \ \ \ \ \  & 160 & 240 & 320 & 400 & \ \ \ \ \ \ \ \  \\ \hline \end{array}\)
  
    1. --- 0 WORK AREA LINES (style=lined) ---

  1. After how many minutes do both tanks contain the same volume of water?   (1 mark)

    --- 1 WORK AREA LINES (style=lined) ---

  2. What is the volume of water in each tank at this time?   (1 mark)

    --- 4 WORK AREA LINES (style=lined) ---

Show Answers Only

a.    \(V=40t\)

b.    \(\text{Table of values:}\)

\(\begin{array}{|c|c|c|c|c|c|c|c|} \hline t & 0 & 2 & 4 & 6 & 8 & 10 & 12 \\ \hline \text{Tank A} & 1000 & 880 & 760 & 640 & 520 & 400 & 280 \\ \hline \text{Tank B} & 0 & 80 & 160 & 240 & 320 & 400 & 480 \\ \hline \end{array}\)
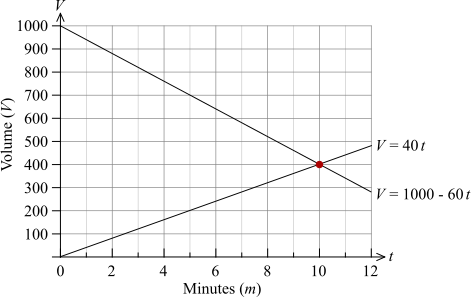
 

c.    \(10\ \text{minutes}\)

d.    \(400\ \text{litres}\)

Show Worked Solution

a.    \(V=40t\)

b.    \(\text{Table of values:}\)

\(\begin{array}{|c|c|c|c|c|c|c|c|} \hline t & 0 & 2 & 4 & 6 & 8 & 10 & 12 \\ \hline \text{Tank A} & 1000 & 880 & 760 & 640 & 520 & 400 & 280 \\ \hline \text{Tank B} & 0 & 80 & 160 & 240 & 320 & 400 & 480 \\ \hline \end{array}\)


c.    \(\text{From the graph, the lines intersect at }\ t=10.\)

\(\therefore\ \text{Both tanks contain the same volume after 10 minutes}\)
  

d.    \(\text{Method 1: Graphically}\)

\(\text{From the graph, when }\ t=10,\ \text{the volume in both tanks = 400 litres}\)
  

\(\text{Method 2: Algebraically}\)

\(\text{When }\ t=10:\)

\(\text{Tank A volume:}\ \ V=1000-60\times10=400\ \text{L}\)

\(\text{Tank B volume:}\ \ V=40\times10=400\ \text{L}\ \checkmark\)

\(\therefore\ \text{Each tank contains } 400\ \text{litres}\)

Filed Under: Simultaneous Linear Equations Tagged With: Band 4, Band 5, Band 6, smc-6839-20-Other SE Applications, smc-6839-30-Find Intersection

Algebra, STD1 EQ-Bank 6 MC

An AFL football team scored 15 times in a game, made up of goals and behinds.

Goals are worth 6 points and behinds are worth 1 point. The team's total score was 45 points.

Let  \(g\) = number of goals and  \(b\) = number of behinds.

Which pair of equations correctly represents this situation?

  1. \(g+b=45\)  and  \(6g+b=15\)
  2. \(6g+b=15\)  and  \(g+b=45\)
  3. \(g+b=15\)  and  \(6g+b=45\)
  4. \(g+b=15\)  and  \(g+6b=45\)
Show Answers Only

\(C\)

Show Worked Solution

\(g+b=15-\text{Eliminate A and B}\)

\(\text{Total points from goals} = 6g\)

\(\text{Total points from behinds} = b\)

\(\text{Total points} = 6g+b\ \ \Rightarrow\ \ 6g+b=45\)

\(\Rightarrow C\)

Filed Under: Simultaneous Linear Equations Tagged With: Band 5, smc-6839-20-Other SE Applications

Algebra, STD1 EQ-Bank 31

A cake-shop owner sells muffins for $2.50 each. It costs $1 to make each muffin and $300 for the equipment needed to make the muffins.

The owner uses a spreadsheet with formulas to model this situation.
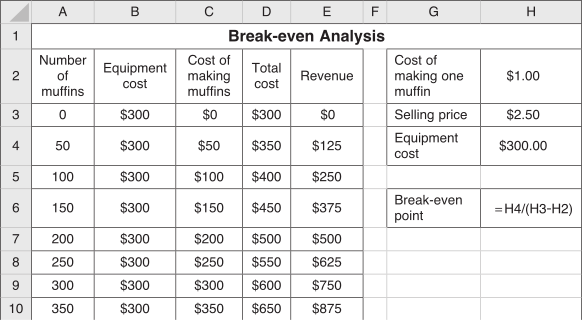
 

  1. How many muffins need to be sold to ‘break-even’?   (1 mark)

    --- 2 WORK AREA LINES (style=lined) ---

  2. How much profit is made if 400 muffins are sold?   (2 marks)

    --- 3 WORK AREA LINES (style=lined) ---

Show Answers Only

a.  \(\text{200 muffins}\)

b.   \(\text{Profit} =\$ 300\)

Show Worked Solution

a.    \(\text{By inspection of the spreadsheet:}\)

\(\text{Total cost = Revenue = \$500}\ \ \Rightarrow\ \ \text{200 muffins}\)

\(\text{Breakeven when 200 muffins sold.}\)
 

b.    \(\text{When 400 muffins are sold:}\)

\(\text{Revenue} =400 \times \$ 2.50=\$ 1000\)

\(\text{Cost} =400 \times 1+\$ 300=\$ 700\)

\(\text{Profit} = 1000-700=\$ 300\)

Filed Under: Simultaneous Linear Equations Tagged With: Band 4, Band 5, smc-6839-10-Cost/Revenue

Algebra, STD1 EQ-Bank 23

Maya operates Sydney City Walking Tours, a city walking tour business.

The bus she hires holds up to 40 people. Each person on the tour pays $35 and receives a complimentary bottle of water.

Maya uses a spreadsheet to model the costs and revenue for each tour. 
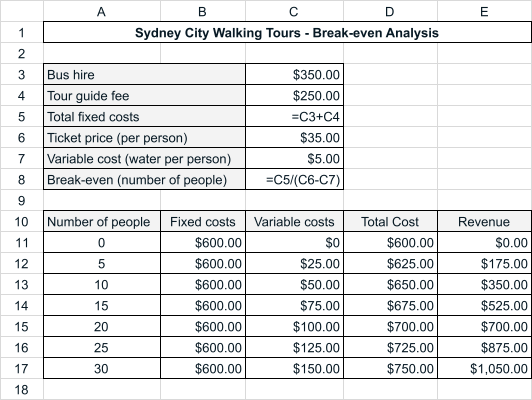
  

  1. What are the total fixed costs for each tour?   (1 mark)

    --- 2 WORK AREA LINES (style=lined) ---

  2. How many people need to attend the tour for Maya to break-even?   (1 mark)

    --- 2 WORK AREA LINES (style=lined) ---

  3. Calculate the profit Maya makes if the tour is fully booked.   (2 marks)

    --- 5 WORK AREA LINES (style=lined) ---

Show Answers Only

a.    \($600\)

b.    \(20\ \text{people}\)

c.    \($600\)

Show Worked Solution

a.    \(\text{Total fixed costs}=$350+$250=$600\)
    

b.    \(\text{From the spreadsheet, Maya’s break-even is when }\)

\(\text{Total cost}=\text{Revenue}=$700\)

\(\therefore\ \text{People to break-even} = 20\)
  

c.    \(\text{Fully booked}=40\ \text{people}\)

\(\text{Variable cost} =40\times \$5= \$200\)

\(\text{Total costs} =$600+$200= \$800\)

\(\text{Revenue} =40\times \$35 = \$1400\)

\(\therefore\ \text{Profit} = \$1400-\$800 = \$600\)

Filed Under: Simultaneous Linear Equations Tagged With: Band 3, Band 4, Band 5, smc-6839-10-Cost/Revenue, smc-6839-40-Spreadsheets

Algebra, STD1 EQ-Bank 22

Gemstar Promotions is organising the annual Concert Under the Stars event to take place on the last weekend in January.

The outdoor venue holds up to 800 people. Each ticket holder receives a complimentary souvenir program valued at $15.

Garth from Gemstar Promotions uses a spreadsheet to model the costs and revenue for the concert. 
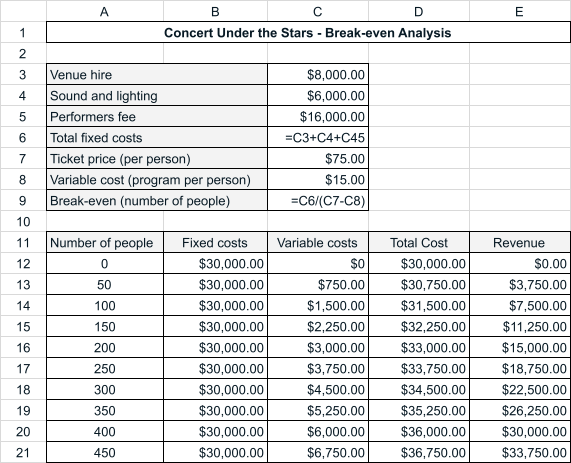
  

  1. What are the total fixed costs for the concert?   (1 mark)

    --- 2 WORK AREA LINES (style=lined) ---

  2. The promoter will only proceed with the concert if the loss is no more than $3000.   
  3. What is the minimum number of tickets that must be sold for the concert to go ahead?   (2 marks)

    --- 4 WORK AREA LINES (style=lined) ---

  4. Use the formula in cell C9 to calculate the number of tickets that must be sold for the promoter to break even?   (1 mark)

    --- 3 WORK AREA LINES (style=lined) ---

  5. Calculate the profit for Gemstar Promotions if the concert is fully booked.   (1 mark)

    --- 3 WORK AREA LINES (style=lined) ---

Show Answers Only

a.    \($30\,000\)

b.    \(450\ \text{people}\)

c.    \(500\ \text{people}\)

d.    \($18\,000\)

Show Worked Solution

a.    \(\text{Total fixed costs}=$8000+$6000+$16\,000=$30\,000\)
    

b.    \(\text{Maximum allowable loss}=$3000\)

\(\text{From the spreadsheet, at}\ 450\ \text{people}:\)

\(\text{Total cost}=$36\,750,\ \text{Revenue}=$33\,750\)

\(\text{Loss}=$36\,750-$33\,750=$3000\ \checkmark\)

\(\therefore\ \text{Minimum ticket sales}=450\)
  

c.    \(\text{Breakeven = C6/(C7-C8)}\)

\(\text{Breakeven}\ = \dfrac{30\,000}{75.00-15.00}=500\ \text{people}\)
  

d.    \(\text{Venue capacity}=800\ \text{people}\)

\(\text{Variable cost} =800\times \$15= $12\,000\)

\(\text{Total costs} =$30\,000+$12\,000= \$42\,000\)

\(\text{Revenue} =800\times \$75 = \$60\,000\)

\(\therefore\ \text{Profit} = \$60\,000-\$42\,000 = \$18\,000\)

Filed Under: Simultaneous Linear Equations Tagged With: Band 3, Band 4, Band 5, smc-6839-10-Cost/Revenue, smc-6839-40-Spreadsheets

Measurement, STD2 EQ-Bank 30

Island \(A\) and island \(B\) are both on the equator.

The longitude of island \(A\) is \(\text{5°E}\) and the longitude of island \(B\) is \(\text{90°W}\).

Joanna leaves island \(A\) at 7 pm on Monday evening.

She arrives at island \(B\) after travelling for 11 hours and 24 minutes.

What local time AND day is it on island \(B\) when she arrives?   (3 marks)

--- 7 WORK AREA LINES (style=lined) ---

Show Answers Only

\(12: 04 \ \text{am}\ \text{(Tue)}\)

Show Worked Solution

\(\text{Longitudinal difference}=90+5=95^{\circ}\)

\(\text{Calculate time difference (using \(15^\circ=1\) hr):}\)

\(\text{Time difference}=\dfrac{95}{15}=6.\dot{3}=\text{6 hours 20 mins}\)

\(\text{Island \(A\) is east of island \(B\)} \ \Rightarrow \ \text{Island \(A\) is ahead}\)

\(\text{Time (Island \(B\))}\) \(=\text{Departure time}+ \text{travel time}-\text{6 h 20 min}\)
  \(=7 \ \text{pm (Mon)}+\text{11 h 24 m}-\text{6 h 20 m}\)
  \(=7 \ \text{pm}+\text{5 h 4 m}\)
  \(=12: 04 \ \text{am}\ \text{(Tue)}\)

Filed Under: Positions on the Earth's Surface Tagged With: Band 5, smc-6305-10-Longitude and Time Differences

Statistics, STD2 EQ-Bank 29

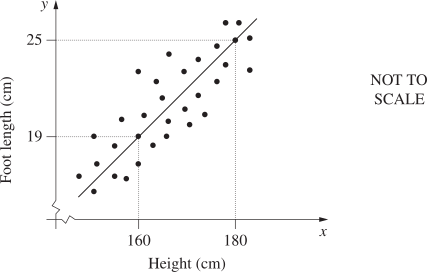
Each member of a group of males had his height and foot length measured and recorded. The results were graphed and a line of fit drawn.
 

  1. Identify the independent variable.   (1 mark)

    --- 1 WORK AREA LINES (style=lined) ---

  2. Why does the value of the `y`-intercept have no meaning in this situation?   (1 mark)

    --- 2 WORK AREA LINES (style=lined) ---

  3. George is 10 cm taller than his brother Harry. Use the line of fit to estimate the difference in their foot lengths.   (1 mark)

    --- 2 WORK AREA LINES (style=lined) ---

Show Answers Only

a.    `text{Height is the independent variable (x-axis variable).}`
 

b.    `text(The y-intercept occurs when)\ x = 0.\ text(It has no meaning to have)`

`text(a height of 0 cm.)`
  

c.    `text(A 20 cm height difference results in a foot length difference of 6 cm.)`

`text(A 10 cm height difference means George should have a 3 cm longer foot.)`

Show Worked Solution

a.    `text{Height is the independent variable (x-axis variable).}`
 

b.    `text(The y-intercept occurs when)\ x = 0.\ text(It has no meaning to have)`

`text(a height of 0 cm.)`
  

c.    `text(A 20 cm height difference results in a foot length difference of 6 cm.)`

`text(A 10 cm height difference means George should have a 3 cm longer foot.)`

Filed Under: Bivariate Data Analysis (Y12) Tagged With: Band 3, Band 4, Band 5, smc-6934-10-Line of Best Fit

ENGINEERING, AE 2025 HSC 27c

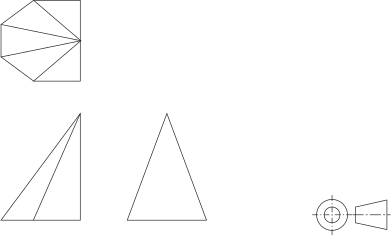
The orthographic views of a security camera cover, manufactured from sheet metal, are shown. Complete a half pattern development of the camera cover.   (6 marks)
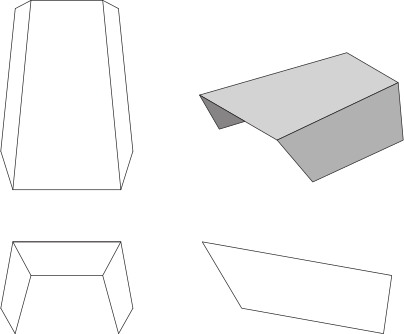
 

--- 24 WORK AREA LINES (style=blank) ---
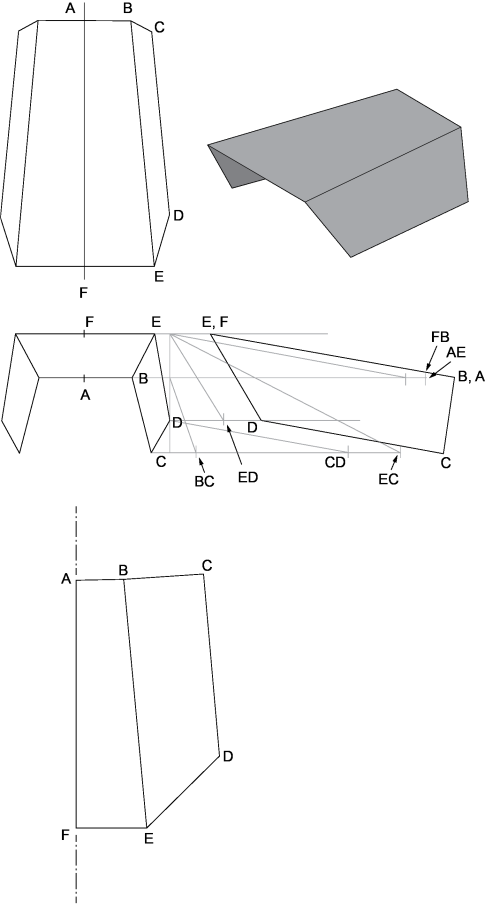
Show Answers Only

Show Worked Solution


♦♦♦ Mean mark 34%.

Filed Under: Communication Tagged With: Band 5, Band 6, smc-3726-10-Transition pieces, smc-3726-20-Orthogonal diagrams

ENGINEERING, CS 2025 HSC 26c

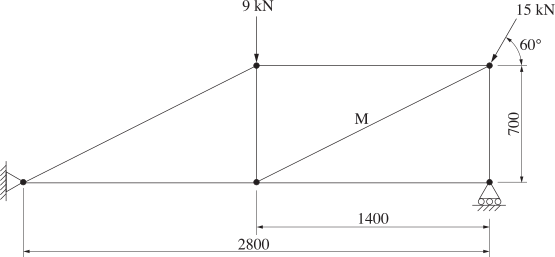
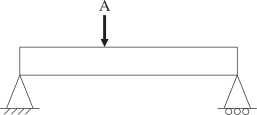
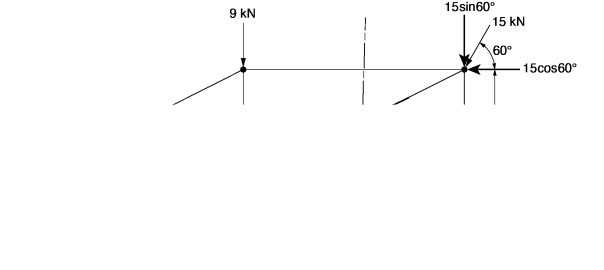
A truss is loaded as shown.
 

Determine the magnitude and nature of the force in member \(\text{M}\).   (6 marks)

--- 24 WORK AREA LINES (style=lined) ---
Show Answers Only

\(\text{Magnitude} = 5869.7 \ \text{N}\)

\(\text{Nature}\ =\ \text{Tension}\)

Show Worked Solution

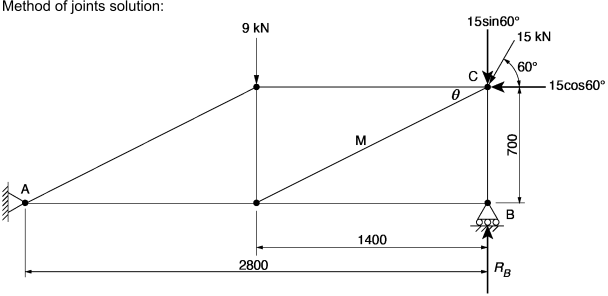
Find reactions at supports — take moments about \(\text{A}\):

\(\Sigma M_A\) \(= 0\)  
  \(0 = +(9 \times 1.4)+(15\sin60° \times 2.8)-(15\cos60° \times 0.7)-R_B \times 2.8\)  
  \(0 = 12.6+36.373-5.25-2.8R_B\)  
\(R_B\) \(= \dfrac{43.723}{2.8}\)  
\(R_B\) \(= 15.615 \ \text{kN} \uparrow\)  

 
Consider RHS of section plane — sum vertical forces:

\(\Sigma F_V\) \(= 0\)  
  \(0 = 15.615-15\sin60°-F_M\sin26.565°\)  
\(F_M\) \(= \dfrac{2.625}{\sin26.565°}\)  
\(F_M\) \(= 5.8697 \ \text{kN}\)  
\(F_M\) \(= 5869.7 \ \text{N (Tension)}\)  

♦♦ Mean mark 51%.

Find \(R_B\) as above \(= 15.615 \ \text{kN} \uparrow\)


Consider Joint C — sum vertical forces:

\(\Sigma F_V\) \(= 0\)  
  \(0 = 15.615-15\sin60°-F_M\sin26.565°\)  
\(F_M\) \(= \dfrac{2.625}{\sin26.565°}\)  
\(F_M\) \(= 5.8697 \ \text{kN}\)  
\(F_M\) \(= 5869.7 \ \text{N (Tension)}\)  


Filed Under: Engineering Mechanics Tagged With: Band 5, smc-3714-10-Truss analysis

ENGINEERING, PPT 2025 HSC 25c

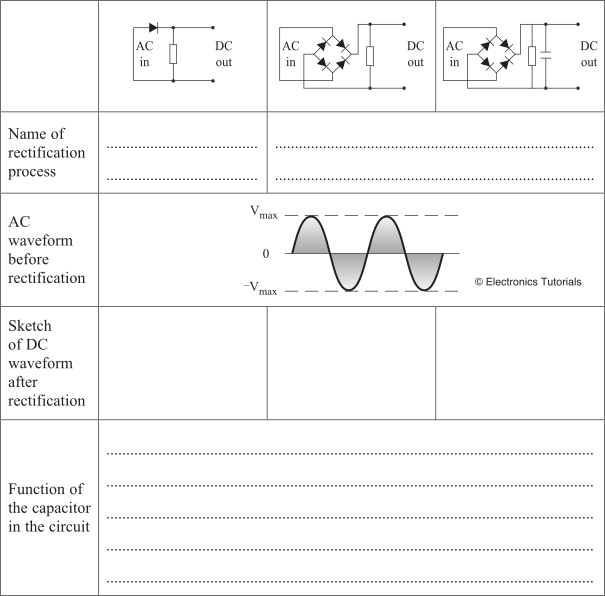
The table below shows three different rectification circuits.

Complete the table by:

  • naming the rectification process
  • sketching DC waveform after rectification
  • outlining the function of the capacitor in the circuit.   (4 marks)

    --- 0 WORK AREA LINES (style=lined) ---
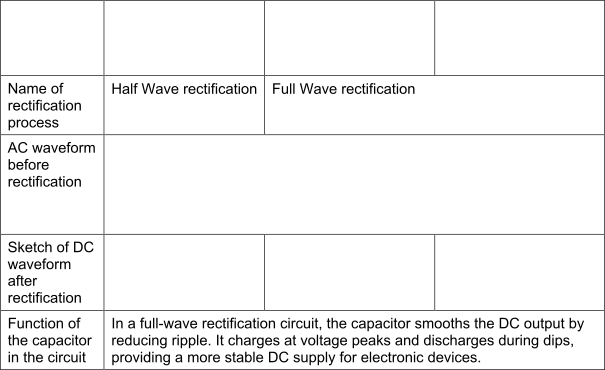
Show Answers Only

Show Worked Solution


♦♦ Mean mark 38%.

Filed Under: Electricity/Electronics Tagged With: Band 5, smc-3720-20-Circuit diagrams, smc-3720-30-AC/DC

ENGINEERING, PPT 2025 HSC 25a

Describe the manufacturing process of powder forming.   (2 marks)

--- 5 WORK AREA LINES (style=lined) ---

Show Answers Only
  • Metal powders are mixed and poured into a die or mould.
  • The powder is compressed under high pressure to form a compact shape.
  • The compact is then sintered — heated below melting point — to bond particles into a solid part.
Show Worked Solution
  • Metal powders are mixed and poured into a die or mould.
  • The powder is compressed under high pressure to form a compact shape.
  • The compact is then sintered — heated below melting point — to bond particles into a solid part.

♦ Mean mark 45%.

Filed Under: Materials Tagged With: Band 5, smc-3719-10-Manufacturing - Ferrous

ENGINEERING, AE 2025 HSC 24c

Describe the operation of a mechanical altimeter. Use a labelled diagram to support your answer.   (4 marks)

--- 6 WORK AREA LINES (style=lined) ---

Show Answers Only
  • A mechanical altimeter measures altitude by detecting changes in atmospheric pressure.
  • Air enters through a static vent and acts on a sealed aneroid capsule inside the instrument.
  • As altitude increases, external air pressure decreases, causing the capsule to expand.
  • This expansion drives a mechanical linkage connected to a pointer on the display dial, indicating altitude.


Show Worked Solution
  • A mechanical altimeter measures altitude by detecting changes in atmospheric pressure.
  • Air enters through a static vent and acts on a sealed aneroid capsule inside the instrument.
  • As altitude increases, external air pressure decreases, causing the capsule to expand.
  • This expansion drives a mechanical linkage connected to a pointer on the display dial, indicating altitude.
   

♦♦ Mean mark 38%.

Filed Under: Mechanics and Hydraulics Tagged With: Band 5, smc-3724-70-Pressure, smc-3724-80-Components/Instruments

ENGINEERING, CS 2025 HSC 22c

A building is being partially demolished and replaced. Part of the original structure will be retained.

A section of a building support structure is shown.


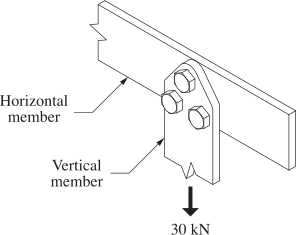
The section consists of a vertical 12 mm thick steel member connected to a 12 mm thick horizontal member with three M16 bolts. A vertical tensile load of 30 kN acts on the bolts.

  1. Assuming the load is evenly distributed across the three bolts, calculate the shear stress on each bolt.   (3 marks)

    --- 12 WORK AREA LINES (style=lined) ---

  2. The shear strength of each connecting bolt is 250 MPa. The support structure must have a factor of safety (FoS) of 2.5.
  3. Determine if the M16 bolts used can safely support the 30 kN load. Support your answer with a calculation.   (3 marks)

    --- 12 WORK AREA LINES (style=lined) ---

Show Answers Only

i.    \(49.7\ \text{MPa}\)

ii.   \(\sigma_{\text{allowable}}=\dfrac{\sigma_{\text{yield}}}{\text{FoS}}=\dfrac{250\times10^{6}}{2.5}=100\ \text{MPa}\)

Since the calculated shear stress (49.7 MPa) is less than the allowable shear stress (100 MPa), the M16 bolts can safely support the 30 kN load with the required factor of safety of 2.5.

Show Worked Solution

i.    Note to students:

The exam provides space for a working sketch showing the bolt arrangement and loading — this is good practice and helps clarify the shear plane, but full marks can be achieved with calculations alone.

\(\text{Force on 1 bolt}=\dfrac{30\times10^{3}}{3}=10\times10^{3}\ \text{N}\)

\(A=\dfrac{\pi d^{2}}{4}=\dfrac{\pi\times(16\times10^{-3})^{2}}{4}=201.1\times10^{-6}\ \text{m}^{2}\)

\(\sigma=\dfrac{F}{A}=\dfrac{10\times10^{3}}{201.1\times10^{-6}}=49.7\ \text{MPa per bolt}\)


♦ Mean mark (i) 52%.

ii.  Note to students:

The exam provides space for a working sketch showing the bolt arrangement and loading — this is good practice and helps clarify the shear plane, but full marks can be achieved with calculations alone.

\(\sigma_{\text{allowable}}=\dfrac{\sigma_{\text{yield}}}{F\ \text{of}\ S}=\dfrac{250\times10^{6}}{2.5}=100\ \text{MPa}\)

Since the calculated shear stress (49.7 MPa) is less than the allowable shear stress (100 MPa), the M16 bolts can safely support the 30 kN load with the required factor of safety of 2.5.

Filed Under: Engineering Materials Tagged With: Band 4, Band 5, smc-3714-60-Shear stress, smc-3714-80-Stress/Strain - other

Calculus, MET2 2025 VCAA 4

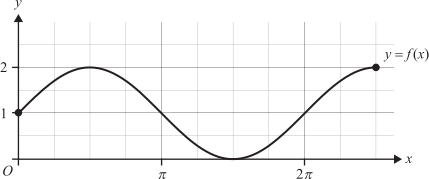
Consider the function  \(f:\left[0, \dfrac{5 \pi}{2}\right] \rightarrow R, f(x)=\sin (x)+1\).

The graph of  \(y=f(x)\)  is shown below.


  1. Evaluate  \(f\left(\dfrac{2 \pi}{3}\right)\).   (1 mark)

    --- 2 WORK AREA LINES (style=lined) ---

  2. Find the exact values of \(x\) for which  \(f(x)=\dfrac{3}{2}\).   (1 mark)

    --- 3 WORK AREA LINES (style=lined) ---

  3. There exist real numbers \(a\) and \(k\) in the interval \(\left(0, \dfrac{5 \pi}{2}\right)\), such that  \(f(x+k)=f(x)\) for all  \(x \in[0, a]\).
  4. Find the value of \(k\) and the largest possible value of \(a\).   (2 marks)

    --- 3 WORK AREA LINES (style=lined) ---

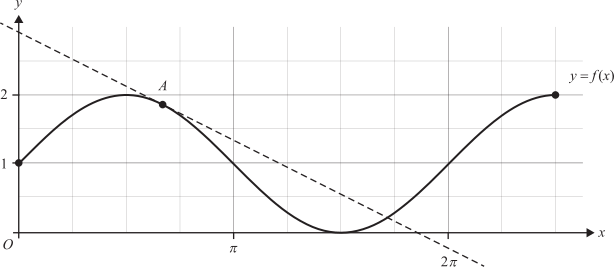
  5. Consider the tangent to the graph of  \(y=f(x)\) at the point \(A\) where  \(x=\dfrac{2 \pi}{3}\), as shown on the axes below.
     

  1. Find the equation of the tangent to the graph of \(y=f(x)\) at the point where  \(x=\dfrac{2 \pi}{3}\).   (1 mark)

    --- 2 WORK AREA LINES (style=lined) ---

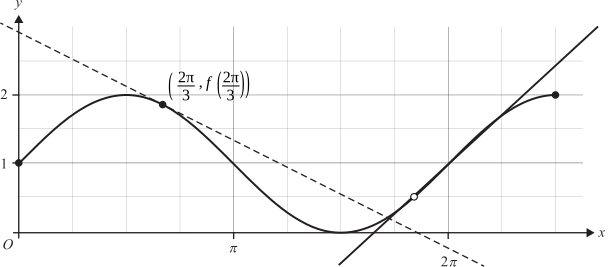
  2. Apply two iterations of Newton's method to \(f\) with  \(x_0=\dfrac{2 \pi}{3}\).
    1. Write down \(x_2\), correct to one decimal place.   (1 mark)

      --- 1 WORK AREA LINES (style=lined) ---

    2. On the axes in part d, draw the tangent to the graph of  \(y=f(x)\) at the point where  \(x=x_1\).
    3. Answer on the graph in part d.   (1 mark)

      --- 0 WORK AREA LINES (style=lined) ---
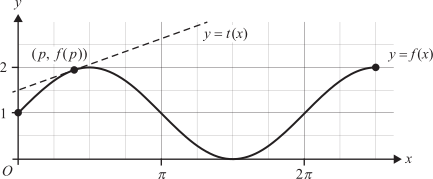
  3. Now consider the line \(y=t(x)\), which is the tangent to the graph of  \(y=f(x)\) at the point  \((p, f(p))\), where  \(p \in\left(0, \dfrac{5 \pi}{2}\right)\).

      1. Show that  \(t(x)=\cos (p)(x-p)+\sin (p)+1\).   (2 marks)

        --- 6 WORK AREA LINES (style=lined) ---

      2. Determine the minimum and maximum possible values for the \(y\)-intercept of  \(y=t(x)\), for  \(p \in\left(0, \dfrac{5 \pi}{2}\right)\).   (2 marks)

        --- 3 WORK AREA LINES (style=lined) ---

      3. Determine the values of \(p\) for which  \(y=t(x)\) has a unique \(x\)-intercept that is equal to the \(x\)-intercept of  \(y=f(x)\).
      4. Give your answers correct to two decimal places.   (2 marks)

        --- 2 WORK AREA LINES (style=lined) ---

  1. Let  \(g:\left[0, \dfrac{5 \pi}{2}\right] \rightarrow R, g(x)=a x^3+b x^2+c x+d\)  be a polynomial function, where \(a, b, c, d \in R\).
  2. Suppose  \(g(0)=f(0)\)  and  \(g^{\prime}(0)=f^{\prime}(0)\).
    1. Show that  \(c=1\)  and  \(d=1\).   (2 marks)

      --- 5 WORK AREA LINES (style=lined) ---

    2. If  \(g(2 \pi)=f(2 \pi)\) and  \(g^{\prime}(2 \pi)=f^{\prime}(2 \pi)\), determine the area bounded by the graphs of  \(y=f(x)\)  and  \(y=g(x)\), for  \(x \in[0,2 \pi]\).
    3. Give your answer correct to two decimal places.    (2 marks)

      --- 7 WORK AREA LINES (style=lined) ---

    4. Let  \(a=0, c=1, d=1\).
    5. Find \(b\) and \(r\), such that  \(g(r)=f(r)\) and  \(g^{\prime}(r)=f^{\prime}(r)\), where  \(b \in R\) and  \(r \in\left(0, \dfrac{5 \pi}{2}\right)\).   (2 marks)

      --- 5 WORK AREA LINES (style=lined) ---

Show Answers Only

a.    \(f\left(\dfrac{2 \pi}{3}\right)=\dfrac{2+\sqrt{3}}{2}\)
 

b.   \(x=\dfrac{\pi}{6}, \dfrac{5 \pi}{6}, \dfrac{13 \pi}{6}\)
 

c.    \(k=2 \pi, \ \ a=\dfrac{\pi}{2}\)
 

d.    \(y=-\dfrac{x}{2}+\dfrac{\pi}{3}+\dfrac{\sqrt{3}}{2}+1\)
 

e.i.  \(x_2=5.2\)
 

e.ii.

f.i.    \(f^{\prime}(p)=\cos (p)\)

\(\text{Equation of tangent at}\ (p, \sin (p)+1):\)

\(y-(\sin (p)+1)\) \(=\cos (p)(x-p)\)
\(t(x)\) \(=\cos (p)(x-p)+\sin (p)+1\)


f.ii.  \(y \text{-int (min)}=1-2 \pi \ \text { (at } p=2 \pi)\)

\(y \text{-int (max)}=1+\pi \ \text { (at } p= \pi)\)
 

f.iii. \(p=2.38 \ \text{or} \ 7.04\)
 

g.i.  \(g(x)=a x^3+b x^2+c x+d, \ f(x)=\sin (x)+1\)

\(\text{Given} \ \ f(0)=g(0):\)

\(d=\sin (0)+1=1\)
 

\(g^{\prime}(x)=3 a x^2+2 b x+c, \ f^{\prime}(x)=\cos (x)\)

\(\text{Given} \ \ f^{\prime}(0)=g^{\prime}(0):\)

\(c=1\)
 

g.ii.  \(\text {Area}=1.53\)
  

g.iii. \(r=\pi, \ b=-\dfrac{1}{\pi}\)

Show Worked Solution

a.    \(f(x)=\sin (x)+1\)

\(f\left(\dfrac{2 \pi}{3}\right)=\sin \left(\dfrac{2 \pi}{3}\right)+1=\dfrac{2+\sqrt{3}}{2}\)
 

b.   \(\text{Solve \(\ f(x)=\dfrac{3}{2} \ \) for \(x\) (by CAS):}\)

\(\sin (x)+1=\dfrac{3}{2} \ \Rightarrow \ \sin (x)=\dfrac{1}{2}\)

\(\text{Solve} \ \ \sin (x)=\dfrac{1}{2} \ \text { for } \ x \in\left[0, \dfrac{5 \pi}{2}\right]:\)

\(x=\dfrac{\pi}{6}, \dfrac{5 \pi}{6}, \dfrac{13 \pi}{6}\)
 

c.    \(f(x+k)=f(x) \ \ \text{for} \ \ x \in[0, a]\)

\(\text{By inspection of graph:}\)

\(k=2 \pi, \ \ a=\dfrac{\pi}{2}\)

♦♦ Mean mark (c) 28%.

d.    \(f(x)=\sin (x)+1 \ \Rightarrow \ f^{\prime}(x)=\cos (x)\)

\(f^{\prime}\left(\dfrac{2 \pi}{3}\right)=-\dfrac{1}{2}\)

\(\text{Find equation of line} \ \ m_2=-\dfrac{1}{2} \ \ \text{through}\ \ \left(\dfrac{2 \pi}{3}, \dfrac{2+\sqrt{3}}{2}\right):\)

\(y=-\dfrac{x}{2}+\dfrac{\pi}{3}+\dfrac{\sqrt{3}}{2}+1\)
 

e.i.  \(x_0=\dfrac{2 \pi}{3}\)

\(x_1=\dfrac{2 \pi}{3}-\dfrac{f\left(\dfrac{2 \pi}{3}\right)}{f^{\prime}\left(\dfrac{2 \pi}{3}\right)}=5.8264 \ldots\)

\(x_2=5.8264 \ldots-\dfrac{f(5.8264)}{f^{\prime}(5.8264)}=5.2 \ \text{(1 d.p.)}\)
 

e.ii.

♦♦ Mean mark (e.ii) 28%.

f.i.    \(f^{\prime}(p)=\cos (p)\)

\(\text{Equation of tangent at}\ (p, \sin (p)+1):\)

\(y-(\sin (p)+1)\) \(=\cos (p)(x-p)\)
\(t(x)\) \(=\cos (p)(x-p)+\sin (p)+1\)


f.ii.  \(t(x)=\cos (p) x+\sin (p)+1-p \times \cos (p)\)

\(y\text{-intercept}=\sin (p)+1-p \times \cos (p)\)

\(\text{Find max/min of} \ y\text{-int for} \ p \in\left[0, \dfrac{5 \pi}{2}\right] \ \ \text{(by CAS):}\)

\(y \text{-int (min)}=1-2 \pi \ \text { (at } p=2 \pi)\)

\(y \text{-int (max)}=1+\pi \ \text { (at } p= \pi)\)

♦♦ Mean mark (f.ii) 26%.
♦♦♦ Mean mark (f.iii) 23%.

f.iii. \(x \text{-intercept of} \ f(x) \ \text{occurs at} \ \ x=\dfrac{3 \pi}{2}\)

\(\text{Solve} \ \ t\left(\dfrac{3 \pi}{2}\right)=0 \ \ \text {for}\  p:\)

\(p=2.38 \ \text{or} \ 7.04\)
 

g.i.  \(g(x)=a x^3+b x^2+c x+d, \ f(x)=\sin (x)+1\)

\(\text{Given} \ \ f(0)=g(0):\)

\(d=\sin (0)+1=1\)
 

\(g^{\prime}(x)=3 a x^2+2 b x+c, \ f^{\prime}(x)=\cos (x)\)

\(\text{Given} \ \ f^{\prime}(0)=g^{\prime}(0):\)

\(c=1\)
 

g.ii.  \(g(x)=a x^3+b x^2+x+1 \ \Rightarrow \ g^{\prime}(x)=3 a x^2+2 b x+1\)

\(\text{Given \(\ g(2 \pi)=f(2 \pi)=1\ \) and \(\ \ g^{\prime}(2 \pi)=f^{\prime}(2 \pi)=1\)}\)

\(\text{Solve \(\ g(2 \pi)=1 \ \) and \(\ g^{\prime}(2 \pi)=1\)  simultaneously for \(a, b\):}\)

\(a=\dfrac{1}{2 \pi^2}, \ b=-\dfrac{3}{2 \pi}\)

♦♦ Mean mark (g.ii) 33%.
♦♦♦ Mean mark (g.iii) 24%.

\(\text{Find intersection of}\ f(x)\ \text{and}\ g(x)\ \text{(by CAS)}:\)

\(f(x)=g(x)\ \ \Rightarrow\ \ x=\pi\)

\(\text {Area}=\displaystyle \int_0^\pi f(x)-g(x)\, d x+\int_\pi^{2 \pi} g(x)-f(x)\, d x=1.53\)
  

g.iii. \(a=0, c=1, d=1\)

\(g(x)=b x^2+x+1, \ f(x)=\sin (x)+1\)

\(g^{\prime}(x)=2 b x+1, \ f^{\prime}(x)=\cos (x)\)

\(\text{Solve simultaneous equations for \(b\) and \(r\):}\)

\(br^2+r=\sin (r)\ \ldots\ (1)\)

\(2 b r+1=\cos (r)\ \ldots\ (2)\)

\(r=\pi, \ b=-\dfrac{1}{\pi}\)

Filed Under: Area Under Curves, Tangents and Normals, Trapezium Rule and Newton, Trig Graphing Tagged With: Band 4, Band 5, Band 6, smc-2757-10-Sin, smc-5145-50-Newton's method, smc-634-30-Trig Function, smc-634-50-Find tangent given curve, smc-723-60-Trig, smc-723-80-Area between graphs

Statistics, MET2 2025 VCAA 3

The time taken for a driver to travel to work each day, in minutes, is modelled by a continuous random variable \(T\) with probability density function

\(f(t)=\left\{\begin{array}{cl}
\dfrac{1}{1\,215\,000}(t-29)(59-t)^3 & 29 \leq t \leq 59 \\
0 & \text {otherwise}
\end{array}\right.\)

    1. Find the mean time taken, in minutes, for the driver to travel to work each day.   (1 mark)

      --- 2 WORK AREA LINES (style=lined) ---

    2. Find the standard deviation of the time taken, in minutes, for the driver to travel to work each day.   (2 marks)

      --- 7 WORK AREA LINES (style=lined) ---

  1. The driver allows \(k\) minutes to travel to work each day. If the journey takes longer than \(k\) minutes, the driver will be late. Whether the driver is late on a particular day is independent of whether they are late on any other day.
    1. If \(k=47\), write a definite integral to show that the probability of the driver being late is 0.08704    (1 mark)

      --- 2 WORK AREA LINES (style=lined) ---

    2. If \(k=47\), find the probability that the driver will be late on at least one day in a five-day working week.
    3. Give your answer correct to four decimal places.   (2 marks)

      --- 3 WORK AREA LINES (style=lined) ---

    4. For \(k=47\), let \(\hat{P}\) be the proportion of days the driver is late in any five-day working week. Find \(\operatorname{Pr}(0.4 \leq \hat{P} \leq 0.6)\) correct to four decimal places.   (2 marks)

      --- 4 WORK AREA LINES (style=lined) ---

    5. Find the integer \(k\) such that the probability, correct to one decimal place, of the driver being late at least once in any five-day working week is 0.2    (2 marks)

      --- 8 WORK AREA LINES (style=lined) ---

  2. At a given traffic light, the wait time is modelled by a normal distribution with a mean of 2.5 minutes and a standard deviation of \(\sigma\) minutes.
    1. If \(\sigma=0.6\), find the probability that the wait time will be less than 3.5 minutes.
    2. Give your answer correct to two decimal places.   (1 mark)

      --- 2 WORK AREA LINES (style=lined) ---

    3. Find the value of \(\sigma\) such that there is a 2% chance of a wait time longer than 3.5 minutes.
    4. Give your answer correct to two decimal places.   (1 mark)

      --- 4 WORK AREA LINES (style=lined) ---

  3. The driver passes through three traffic lights \((A, B\) and \(C)\) on their journey to work. The probability of each traffic light being red is shown in the table below.
  4. \begin{array}{|l|c|c|c|}
    \hline \rule{0pt}{2.5ex}\text {Traffic light} \rule[-1ex]{0pt}{0pt}& \quad A \quad & \quad B \quad & \quad C  \quad\\
    \hline \rule{0pt}{2.5ex} \text {Probability that the traffic light is red} \quad  \rule[-1ex]{0pt}{0pt}& 0.2 & 0.3 & 0.1 \\
    \hline
    \end{array}
  5. Let \(Y\) be the random variable representing the number of traffic lights that are red on the driver's journey to work. Assume that each traffic light being red is independent of any other traffic light being red.
  6. Complete the following table for the probability distribution of \(Y\).    (2 marks)

    --- 0 WORK AREA LINES (style=lined) ---

  7. \begin{array}{|c|c|c|c|c|}
    \hline \rule{0pt}{2.5ex}y \rule[-1ex]{0pt}{0pt}& \ \ \quad 0 \ \ \quad & \ \ \quad 1 \ \ \quad & \ \ \quad 2 \ \ \quad & \ \ \quad 3 \ \ \quad \\
    \hline \rule{0pt}{2.5ex}\operatorname{Pr}(Y=y) \rule[-1ex]{0pt}{0pt}& & & & \\
    \hline
    \end{array}
Show Answers Only

a.i.   \(\displaystyle \int_{29}^{59}(t \times f(t)) d t=39\)
 

a.ii. \(\text{Strategy 1}\)

\(\text{sd}(T)=\sqrt{\displaystyle\int_{29}^{59} t^2 f(t) d t-39^2}=\dfrac{10 \sqrt{14}}{7}\)

\(\text{Strategy 2}\)

\(\text{sd}(T)=\sqrt{\displaystyle\int_{29}^{59}(t-39)^2 f(t)\, d t}=\dfrac{10 \sqrt{14}}{7}\)
 

b.i.  \(P\text{(driver being late)}=\displaystyle\int_{47}^{59} f(t)\, d t=0.08704\)
 

b.ii.  \(P(\text{(driver late at least 1 day in week)}=0.3658 \ \ \text{(4 d.p.)}\)
 

b.iii. \(0.0631 \ \text{(4 d.p.)}\)
 

b.iv. \(k=49\)
 

c.i.  \(P(W<3.5)=0.95\)
 

c.ii   \(\sigma=0.49\)
 

d.

\begin{array}{|c|c|c|c|c|}
\hline \rule{0pt}{2.5ex}y \rule[-1ex]{0pt}{0pt}& \quad 0 \quad & \quad 1 \quad& \quad 2 \quad & \quad 3 \quad \\
\hline \rule{0pt}{2.5ex}\operatorname{Pr}(Y=y) \rule[-1ex]{0pt}{0pt}& \frac{63}{125}=0.504& \frac{199}{500}=0.398 & \frac{23}{250}=0.092 & \frac{3}{500}=0.006 \\
\hline
\end{array}

Show Worked Solution

a.i.   \(\text{Calculate (by CAS):}\)

\(\displaystyle \int_{29}^{59}(t \times f(t)) d t=39\)
 

a.ii. \(\text{Strategy 1}\)

\(\text{sd}(T)=\sqrt{\displaystyle\int_{29}^{59} t^2 f(t) d t-39^2}=\dfrac{10 \sqrt{14}}{7}\)

\(\text{Strategy 2}\)

\(\text{sd}(T)=\sqrt{\displaystyle\int_{29}^{59}(t-39)^2 f(t)\, d t}=\dfrac{10 \sqrt{14}}{7}\)
 

b.i.  \(P\text{(driver being late)}\)

\(=\displaystyle\int_{47}^{59} f(t)\, d t=0.08704\)
 

b.ii.  \(P(\text{(driver late at least 1 day in week)}\)

\(=1-P(\text{never late in 5 days})\)

\(=1-(0.08704)^5\)

\(=0.3658 \ \ \text{(4 d.p.)}\)
 

b.iii. \(\text{Let} \ \ Y \sim \text{Bi}(5,0.08704)\)

\(\operatorname{Pr}(0.4 \leqslant \hat{P} \leqslant 0.6)=\operatorname{Pr}(2 \leqslant Y \leqslant 3)=0.0631 \ \text{(4 d.p.)}\)
 

b.iv. \(\text{Solve for} \ k:\)

\(1-\left(1-\displaystyle \int_k^{59} f(t) d t\right)^5=0.2\)

\(k=49\)
 

c.i.  \(W \sim N\left(\mu, \sigma^2\right) \sim\left(2.5,0.6^2\right)\)

\(\text{Solve (by CAS):}\)

\(P(W<3.5)=0.95\)
 

c.ii   \(\text{Find \(z\)-score when \(P(W>3.5)=0.02\)}\)

\(z \text {-score }=2.0537 \ldots\)

\(\text{Solve for} \ \sigma :\)

\(\dfrac{3.5-2.5}{\sigma}=2.0537 \ldots \ \Rightarrow \ \sigma=0.49\ \text{(2 d.p.)}\)
 

d.

\begin{array}{|c|c|c|c|c|}
\hline \rule{0pt}{2.5ex}y \rule[-1ex]{0pt}{0pt}& \quad 0 \quad & \quad 1 \quad& \quad 2 \quad & \quad 3 \quad \\
\hline \rule{0pt}{2.5ex}\operatorname{Pr}(Y=y) \rule[-1ex]{0pt}{0pt}& \frac{63}{125}=0.504& \frac{199}{500}=0.398 & \frac{23}{250}=0.092 & \frac{3}{500}=0.006 \\
\hline
\end{array}

Filed Under: Normal Distribution, Probability Density Functions Tagged With: Band 3, Band 4, Band 5, smc-637-10-E(X), smc-637-30-Var(X), smc-637-60-Polynomial PDF, smc-719-10-Single z-score

ENGINEERING, CS 2025 HSC 20 MC

A cable with an initial length of 15 m and a cross-sectional area of \(300 \times 10^{-6} \ \text{m}^2\) is subjected to a tensile force of \(75\,000\ \text{N}\), causing an elongation of \(\text{0.01 m}\) and a decrease in cross-sectional area to \(280 \times 10^{-6}\ \text{m}^2\).

Assuming the deformation occurs within the elastic region, what is the Young's Modulus of the cable?

  1. \(\text{402 GPa}\)
  2. \(\text{375 GPa}\)
  3. \(\text{268 MPa}\)
  4. \(\text{250 MPa}\)
Show Answers Only

\(B\)

Show Worked Solution

\(\sigma=\dfrac{F}{A}=\dfrac{75\ 000}{300\times10^{-6}}=250\times10^{6}\ \text{Pa}\)

\(\varepsilon=\dfrac{\Delta L}{L}=\dfrac{0.01}{15}=6.667\times10^{-4}\)

\(E=\dfrac{\sigma}{\varepsilon}=\dfrac{250\times10^{6}}{6.667\times10^{-4}}=375\times10^{9}\ \text{Pa}=375\ \text{GPa}\)

\(\Rightarrow B\)


♦ Mean mark 47%.

Filed Under: Engineering Mechanics Tagged With: Band 5, smc-3714-75-Young/Hooke, smc-3714-80-Stress/Strain - other

ENGINEERING, AE 2025 HSC 19 MC

The orthographic views of a part are shown.
 

What is the total number of true lengths that are visible in ALL three views?

  1. 9
  2. 10
  3. 12
  4. 15
Show Answers Only

\(B\)

Show Worked Solution
  • A true length appears when a line is parallel to the projection plane — it shows its actual length in that view.
  • Top view: the base rectangle has 4 true length edges; the base diagonal is also a true length = 5 true lengths.
  • Front view: the base line is true length; one slant edge is true length = 2 true lengths.
  • Side view: the base line is true length; both slant edges are true length = 3 true lengths.
  • Total: \(5+2+3=10\)

\(\Rightarrow B\)


♦♦♦ Mean mark 30%.

Filed Under: Communication Tagged With: Band 5, smc-3726-10-Transition pieces, smc-3726-20-Orthogonal diagrams

ENGINEERING, PPT 2025 HSC 18 MC

A 9 V battery is used to power a simple series circuit. The circuit has one 2.1 V LED with a maximum allowable current of 50 mA.

Which resistor would be the most suitable option to ensure the LED operates at maximum brightness (without failure)?

  1. \(38\ \Omega\)
  2. \(42\ \Omega\)
  3. \(138\ \Omega\)
  4. \(180\ \Omega\)
Show Answers Only

\(C\)

Show Worked Solution

\(V_R= V_{\text{supply}}-V_{\text{LED}}= 9-2.1= 6.9\ \text{V}\)

\(R= \dfrac{V_R}{I}= \dfrac{6.9}{0.05}= 138\ \Omega\)

\(\Rightarrow C\)


♦♦ Mean mark 39%.

Filed Under: Electricity/Electronics Tagged With: Band 5, smc-3720-24-P=VI / V=IR calcs

ENGINEERING, CS 2025 HSC 16 MC

A simply supported beam with a vertical point load is shown.
 

Which row of the table correctly describes the shear force and the bending moment diagrams at point \(\text{A}\)?
 

\begin{align*}
\begin{array}{l}
\rule{0pt}{2.5ex} \ \rule[-1ex]{0pt}{0pt}& \\
\rule{0pt}{2.5ex}\textbf{A.}\rule[-1ex]{0pt}{0pt}\\
\rule{0pt}{2.5ex}\textbf{B.}\rule[-1ex]{0pt}{0pt}\\
\rule{0pt}{2.5ex}\textbf{C.}\rule[-1ex]{0pt}{0pt}\\
\rule{0pt}{2.5ex}\textbf{D.}\rule[-1ex]{0pt}{0pt}\\
\end{array}
\begin{array}{|c|c|}
\hline
\rule{0pt}{2.5ex}\quad \textit{Shear force}\quad \rule[-1ex]{0pt}{0pt}& \ \ \textit{Bending moment}\ \ \\
\hline
\rule{0pt}{2.5ex}\text{Minimum}\rule[-1ex]{0pt}{0pt}&\text{Maximum}\\
\hline
\rule{0pt}{2.5ex}\text{Maximum}\rule[-1ex]{0pt}{0pt}& \text{Maximum}\\
\hline
\rule{0pt}{2.5ex}\text{Maximum}\rule[-1ex]{0pt}{0pt}& \text{Minimum} \\
\hline
\rule{0pt}{2.5ex}\text{Minimum}\rule[-1ex]{0pt}{0pt}& \text{Minimum} \\
\hline
\end{array}
\end{align*}

Show Answers Only

\(A\)

Show Worked Solution
  • For a simply supported beam with a central point load, shear force is zero (minimum) at midspan — the shear force diagram crosses zero directly under the point load.
  • Bending moment is maximum at midspan — the bending moment diagram peaks directly under the point load and is zero at both supports.
  • These two facts are fundamental: the point where shear force = 0 always corresponds to maximum bending moment.

\(\Rightarrow A\)


♦ Mean mark 51%.

Filed Under: Engineering Mechanics Tagged With: Band 5, smc-3714-20-Bending stress, smc-3714-30-Shear force diagram, smc-3714-40-Bending moment diagram

ENGINEERING, PPT 2025 HSC 2 MC

An image of a steel engine part is shown.
 

Based on the grain structure, what forming method was used to manufacture the engine part?

  1. Cast
  2. Forged
  3. Machined
  4. Rolled
Show Answers Only

\(B\)

Show Worked Solution
  • The curved grain flow lines following the part’s contour are uniquely produced by forging.
  • Casting produces random equiaxed grains — no directional flow lines.
  • Machining is subtractive — grain structure comes from the original stock.
  • Rolling produces straight, linear grain flow — not contoured.

\(\Rightarrow B\)


♦ Mean mark 47%.

Filed Under: Materials Tagged With: Band 5, smc-3719-10-Manufacturing - Ferrous

Functions, MET2 2025 VCAA 2

Let  \(f: R \rightarrow R, \ f(x)=\dfrac{x}{2}+7\)  and

\(g: R \rightarrow R, \ g(x)=A e^{k x}\)  where  \(A, k \in R\).

The graphs of  \(y=f(x)\)  and  \(y=g(x)\)  intersect at the points \((-12,1)\) and \((2,8)\), as shown below.


  1. Write down two simultaneous equations in terms of \(A\) and \(k\).
  2. Solve them, using algebra, to show that  \(A=2^{\tfrac{18}{7}}\)  and  \(k=\dfrac{3}{14} \log _e(2)\).   (3 marks)

    --- 12 WORK AREA LINES (style=lined) ---

  3. Find the value of \(b\), where  \(b \in R\), such that \(g(x)\) can be expressed in the form  \(g(x)=A \times 2^{b x}\).   (1 mark)

    --- 3 WORK AREA LINES (style=lined) ---

  4. Use a definite integral to evaluate the area bounded by the graphs of  \(y=f(x)\)  and  \(y=g(x)\), where  \(x \in[-12,2]\).
  5. Give the area correct to two decimal places.   (2 marks)

    --- 5 WORK AREA LINES (style=lined) ---

  6. Let  \(h(x)=f(x)-g(x)\).
    1. Write down an expression for the derivative of \(h(x)\).   (1 mark)

      --- 2 WORK AREA LINES (style=lined) ---

    2. Find the maximum value of \(h(x)\), where  \(x \in[-12,2]\).   (1 mark)
    3. Give your answer correct to two decimal places.

      --- 2 WORK AREA LINES (style=lined) ---

  7. Let \(g^{-1}\) be the inverse of \(g\).
  8. Find the points where the graph of  \(y=g^{-1}(x)\)  intersects with the graph of  \(y=2(x-7)\).   (2 marks)

    --- 5 WORK AREA LINES (style=lined) ---

  9. Let \(F\) be an anti-derivative of \(f\) that passes through \((0, c)\), where \(c \in R\).
    1. Show that it is not possible for the graph of  \(y=F(x)\)  to pass through both \((-12,1)\) and \((2,8)\).   (2 marks)

      --- 9 WORK AREA LINES (style=lined) ---

    2. The graph of  \(y=F(x)\) can be dilated by a factor of \(m\) from the \(x\)-axis such that its image passes through both \((-12,1)\) and \((2,8)\).
    3. Find the values of \(m\) and \(c\).   (2 marks)

      --- 6 WORK AREA LINES (style=lined) ---

Show Answers Only

a.    \(f(x)=\dfrac{x}{2}+7, \ g(x)=A e^{k x}\)

\(\text{Intersection occurs at }(-12,1) \text { and }(2,8):\)

\(A e^{-12 k}\) \(=1\ \ldots\ (1)\)
\(A e^{2 k}\) \(=18\ \ldots\ (2)\)

 
\(\text{Divide:}\ \ (2) ÷ (1)\)

\(e^{2 k-(-12 k)}\) \(=8\)
\(e^{14 k}\) \(=8\)
\(14 k\) \(=\log _e 8\)
\(14 k\) \(=3\log _e 2\)
\(14 k\) \(=\dfrac{3}{14} \log _e 2\)


\(\text{Substitute \(k\) into (1):}\)

\(A e^{-12\left(\tfrac{3}{14} \log _e 2\right)}\) \(=1\)
\(A e^{-\tfrac{18}{7} \log_e2}\) \(=1\)
\(A \times 2^{-\tfrac{18}{7}}\) \(=1\)
\(A\) \(=2^{\tfrac{18}{7}}\)


b.    \(g(x)=2^{\tfrac{18}{7}} \times 2^{\tfrac{3 x}{14}}\)
 

c.    \(\text{Area}=\displaystyle \int_{-12}^2 f(x)-g(x)=15.87 \ \text{u}^2\)
 

d.i.  \(h^{\prime}(x)=\dfrac{1}{2}-\dfrac{6 \log _e 2}{7} \times 2^{\tfrac{3 x}{14}+\tfrac{4}{7}}\)
 

d.ii. \(h(x)_{\text{max}}=1.72\)
 

e.   \(\text{Intersection at}\ (1,-12) \ \text{and} \ (8,2).\)
 

f.i.  \(f(x)=\dfrac{x}{2}+7\)

\(F(x)=\displaystyle \int f(x)\ d x=\dfrac{1}{4} x^2+7 x+c\)
 

\(\text{If} \ F(x) \ \text{passes through} \ (-12,1):\)

\(F(-12)=\dfrac{1}{4}(-12)^2+7(-12)+c=1 \ \ \Rightarrow\ \ c=49\)
 

\(\text{If \(F(x)\) passes through \((2,8)\):}\)

\(F(2)=\dfrac{1}{4}(2)^2+7(2)+c=8 \ \ \Rightarrow \ \ c=-7\)

\(\text{Since \(c\) cannot have 2 values, it cannot pass through both points.}\)
 

f.ii.  \(m=\dfrac{1}{9}, \ c=57\)

Show Worked Solution

a.    \(f(x)=\dfrac{x}{2}+7, \ g(x)=A e^{k x}\)

\(\text{Intersection occurs at }(-12,1) \text { and }(2,8):\)

\(A e^{-12 k}\) \(=1\ \ldots\ (1)\)
\(A e^{2 k}\) \(=18\ \ldots\ (2)\)
Mean mark (a) 51%.

\(\text{Divide:}\ \ (2) ÷ (1)\)

\(e^{2 k-(-12 k)}\) \(=8\)
\(e^{14 k}\) \(=8\)
\(14 k\) \(=\log _e 8\)
\(14 k\) \(=3\log _e 2\)
\(14 k\) \(=\dfrac{3}{14} \log _e 2\)


\(\text{Substitute \(k\) into (1):}\)

\(A e^{-12\left(\tfrac{3}{14} \log _e 2\right)}\) \(=1\)
\(A e^{-\tfrac{18}{7} \log_e2}\) \(=1\)
\(A \times 2^{-\tfrac{18}{7}}\) \(=1\)
\(A\) \(=2^{\tfrac{18}{7}}\)


b.    \(g(x)\) \(=2^{\tfrac{18}{7}} \times e^{\left(\tfrac{3}{14} \log _e 2\right) x}\)
    \(=2^{\tfrac{18}{7}} \times e^{\left(\tfrac{3 x}{14} \log _e 2\right)}\)
    \(=2^{\tfrac{18}{7}} \times e^{\left(\log _e 2^{\tfrac{3x}{14}}\right)}\)
    \(=2^{\tfrac{18}{7}} \times 2^{\tfrac{3 x}{14}}\)

Mean mark (b) 55%.
 

c.    \(\text{Area}=\displaystyle \int_{-12}^2 f(x)-g(x)=15.87 \ \text{u}^2\)
 

d.i.  \(h(x)=f(x)-g(x)\)

\(h(x)=\dfrac{x}{2}+7-2^{\tfrac{18}{7}} \times e^{k x}\)

\(h^{\prime}(x)=\dfrac{1}{2}-\dfrac{6 \log _e 2}{7} \times 2^{\tfrac{3 x}{14}+\tfrac{4}{7}}\)
 

d.ii. \(\text{Solve}\ \ h^{\prime}(x)=0\ \ \text{for}\ x\ \text{(by CAS):}\) 

\(x=-3.829\)

\(\text{Substitute into} \ \ h(x):\)

\(h(x)_{\text{max}}=1.72\)
 

e.   \(\text{Strategy 1}\)

\(\text{By CAS, find} \ \ g^{-1}(x):\)

\(g^{-1}(x)=\dfrac{2\left(7 \log _e x-7 \log _e 8+3 \log _e 2\right)}{3 \log _e 2}\)

\(\text{Solve} \ \ g^{-1}(x)=2(x-7) \ \ \text{for} \ x:\)

\(x=1,8\)

\(\text{Intersection at}\ (1,-12) \ \text{and} \ (8,2).\)
 

\(\text{Strategy 2}\)

\(y=2(x-7) \ \ \text{is the inverse of}\ \  y=\dfrac{x}{2}+7\ \ \text{(i.e.}\ f(x)).\)

\(\text{Two inverse functions will intersect at}\ (1,-12) \ \text{and} \ (8,2).\)
 

f.i.  \(f(x)=\dfrac{x}{2}+7\)

\(F(x)=\displaystyle \int f(x)\ d x=\dfrac{1}{4} x^2+7 x+c\)
 

\(\text{If} \ F(x) \ \text{passes through} \ (-12,1):\)

\(F(-12)=\dfrac{1}{4}(-12)^2+7(-12)+c=1 \ \ \Rightarrow\ \ c=49\)
 

\(\text{If \(F(x)\) passes through \((2,8)\):}\)

\(F(2)=\dfrac{1}{4}(2)^2+7(2)+c=8 \ \ \Rightarrow \ \ c=-7\)

\(\text{Since \(c\) cannot have 2 values, it cannot pass through both points.}\)

♦ Mean mark (f.i) 50%.

f.ii.  \(F(x)=\dfrac{1}{4} x^2+7 x+c\)

\(\text{Dilation of \(m\) from \(x\)-axis passes through \((-12,1)\) and \((2,8)\).}\)

\(\text{Solve simultaneously: }\)

\(m \times F(-12)=36 m-84 m+m c=1\ \ldots\ (1)\)

\(m \times F(2)=m+14 m+m c=8\ \ldots\ (2)\)

\(m=\dfrac{1}{9}, \ c=57\)

♦♦ Mean mark (f.ii) 34%.

Filed Under: Area Under Curves, Graphs and Applications, Log/Index Laws and Equations, Transformations Tagged With: Band 3, Band 4, Band 5, smc-723-50-Log/Exponential, smc-726-50-Exponential Equation, smc-753-20-Dilation (Only)

  • « Previous Page
  • 1
  • 2
  • 3
  • 4
  • …
  • 85
  • Next Page »

Copyright © 2014–2026 SmarterEd.com.au · Log in