SmarterEd

Aussie Maths & Science Teachers: Save your time with SmarterEd

  • Login
  • Get Help
  • About

Networks, STD2 N3 2019 FUR2 3

Fencedale High School is planning to renovate its gymnasium.

This project involves 12 activities, `A` to `L`.

The directed network below shows these activities and their completion times, in weeks.


The minimum completion time for the project is 35 weeks.

  1. Identify the critical path and state how many activities are on it?  (2 marks)

    --- 2 WORK AREA LINES (style=lined) ---

  2. Determine the latest start time of activity `E`.  (1 mark)

    --- 1 WORK AREA LINES (style=lined) ---

  3. Which activity has the longest float time?  (1 mark)

    --- 2 WORK AREA LINES (style=lined) ---

It is possible to reduce the completion time for activities `C, D, G, H` and `K` by employing more workers.

  1.  The completion time for each of these five activities can be reduced by a maximum of two weeks.


    What is the minimum time, in weeks, that the renovation project could take?  (1 mark)

    --- 2 WORK AREA LINES (style=lined) ---

Show Answers Only
  1. `8\ text(activities)`
  2. `12\ text(weeks)`
  3. `text(Activity)\ J`
  4. `29\ text(weeks)`
Show Worked Solution

a.  `text(Scanning forwards and backwards:)`


`text(Critical path:)\ ABDFGIKL`

`:. 8\ text(activities)`
 

b.  `text(LST for activity)\ E = 12\ text{weeks  (i.e. start of 13th week)}`
 

c.   `text(Consider float times of all activities not on critical path.)`

`J-5, H-1, E-1, C-1`

`:.\ text(Activity)\ J\ text(has the largest float time.)`
 

d.   `text(Critical path after reducing)\ CDGHK\ text(by 2 weeks is)`

`ABDFGIKL.`
 

`:.\ text(Minimum time)` `= 2 + 4 + 7 + 1 + 2 + 2 + 5 + 6`
  `= 29\ text(weeks)`

Filed Under: Critical Paths Tagged With: Band 4, Band 5, Band 6, smc-916-30-Scanning Both Ways, smc-916-40-Critical Path Adjustments

NETWORKS, FUR2 2019 VCAA 3

Fencedale High School is planning to renovate its gymnasium.

This project involves 12 activities, `A` to `L`.

The directed network below shows these activities and their completion times, in weeks.


The minimum completion time for the project is 35 weeks.

  1. How many activities are on the critical path?   (1 mark)

    --- 4 WORK AREA LINES (style=lined) ---

  2. Determine the latest start time of activity `E`.   (1 mark)

    --- 1 WORK AREA LINES (style=lined) ---

  3. Which activity has the longest float time?   (1 mark)

    --- 3 WORK AREA LINES (style=lined) ---

It is possible to reduce the completion time for activities `C, D, G, H` and `K` by employing more workers.

  1.  The completion time for each of these five activities can be reduced by a maximum of two weeks.


    What is the minimum time, in weeks, that the renovation project could take?   (1 mark)

    --- 3 WORK AREA LINES (style=lined) ---

  2. The reduction in completion time for each of these five activities will incur an additional cost to the school.


    The table below shows the five activities that can have their completion times reduced and the associated weekly cost, in dollars.
      

           Activity                    Weekly cost ($)             
    `C` 3000
    `D` 2000
    `G` 2500
    `H` 1000
    `K` 4000

      
    The completion time for each of these five activities can be reduced by a maximum of two weeks.


    Fencedale High School requires the overall completion time for the renovation project to be reduced by four weeks at minimum cost.


    Complete the table below, showing the reductions in individual activity completion times that would achieve this.   (2 marks)

    --- 5 WORK AREA LINES (style=lined) ---

           Activity       

                 Reduction in completion time             
            (0, 1 or 2 weeks)
    `C`  
    `D`  
    `G`  
    `H`  
    `K`  
Show Answers Only
  1. `8\ text(activities)`
  2. `12\ text(weeks)`
  3. `text(Activity)\ J`
  4. `29\ text(weeks)`
  5.  
             Activity       

             Reduction in completion time         
            (0, 1 or 2 weeks)
      `C` 0
      `D` 1
      `G` 2
      `H` 1
      `K` 1
Show Worked Solution

a.  `text(Scanning forwards and backwards:)`


`text(Crirical path:)\ ABDFGIKL`

`:. 8\ text(activities)`
 

b.  `text(LST for activity)\ E = 12\ text{weeks  (i.e. start of 13th week)}`
 

c.   `text(Consider float times of all activities not on critical path.)`

`J-5, H-1, E-1, C-1`

`:.\ text(Activity)\ J\ text(has the largest float time.)`
 

d.   `text(Critical path after reducing)\ CDGHK\ text(by 2 weeks is)`

`ABDFGIKL.`
 

`:.\ text(Minimum time)` `= 2 + 4 + 7 + 1 + 2 + 2 + 5 + 6`
  `= 29\ text(weeks)`

  
e.
   `text(Reduce cheapest activities on the critical path by 1 week)`

`↓ 1 =>\ text(Activity)\ D\ text(and)\ G`
 

`text{Possibilities for reducing by a further week (choose 2)}`

`C and D:\ text(cost $5000)\ \ text{(too expensive)}`

`G and H:\ text(cost $3500)\ \ text{(yes)}`

`K:\ text(cost $4000)\ \ text{(yes)}`
 

         Activity       

         Reduction in completion time         
        (0, 1 or 2 weeks)
  `C` 0
  `D` 1
  `G` 2
  `H` 1
  `K` 1

Filed Under: Critical Path Analysis Tagged With: Band 5, Band 6, smc-621-30-Float time/LST, smc-621-40-Crashing/Reduce completion time

NETWORKS, FUR2 2019 VCAA 2

Fencedale High School offers students a choice of four sports, football, tennis, athletics and basketball.

The bipartite graph below illustrates the sports that each student can play.


Each student will be allocated to only one sport.

  1. Complete the table below by allocating the appropriate sport to each student.   (1 mark)

    --- 0 WORK AREA LINES (style=lined) ---


         Student                                 Sport                         
    Blake  
    Charli  
    Huan  
    Marco  


  1. The school medley relay team consists of four students, Anita, Imani, Jordan and Lola.


    The medley relay race is a combination of four different sprinting distances: 100 m, 200 m, 300 m and 400 m, run in that order.


    The following table shows the best time, in seconds, for each student for each sprinting distance.
     

      Best time for each sprinting distance (seconds)
         Student             100 m               200 m               300 m               400 m       
      Anita 13.3 29.6 61.8 87.1
      Imani 14.5 29.6 63.5 88.9
      Jordan 13.3 29.3 63.6 89.1
      Lola 15.2 29.2 61.6 87.9


    The school will allocate each student to one sprinting distance in order to minimise the total time taken to complete the race.


    To which distance should each student be allocated?


    Write your answers in the table below.  (2 marks)

    --- 2 WORK AREA LINES (style=lined) ---


           Student                                Sprinting distance (m)                         
      Anita  
      Imani  
      Jordan  
      Lola  
Show Answers Only
a.           Student                                 Sport                         
    Blake   Tennis
    Charli   Football
    Huan   Basketball
    Marco   Athletics


b.           Student                Sprinting distance (m)         
    Anita 400
    Imani 200
    Jordan 100
    Lola 300
Show Worked Solution

a.    `text(Charli must choose football)`

`=>\ text(Blake must choose tennis)`

`=>\ text(Huan must choose basketball etc…)`
 

         Student                                 Sport                         
    Blake   Tennis
    Charli   Football
    Huan   Basketball
    Marco   Athletics


b.    `text(Using the Hungarian Algorithm:)`

`text(After row and column reduction,)`
 

     Student        100 m         200 m         300 m         400 m    
    Anita 0 2.3 2.1 1.1
    Imani 0 1.1 2.6 1.7
    Jordan 0 2 3.9 3.1
    Lola 0 0 0 0


`text(Final table values:)`
 

     Student        100 m         200 m         300 m         400 m    
    Anita 0 1.2 1 0
    Imani 0 0 1.5 0.6
    Jordan 0 0.9 2.8 2
    Lola 1.1 0 0 0


         Student                Sprinting distance (m)         
    Anita 400
    Imani 200
    Jordan 100
    Lola 300

Filed Under: Matching Problems Tagged With: Band 3, Band 5, smc-623-10-Hungarian Algorithm, smc-623-20-Other Matching

MATRICES, FUR2 2019 VCAA 3

On Sunday, matrix `V` is used when calculating the expected number of visitors at each location every hour after 10 am. It is assumed that the park will be at its capacity of 2000 visitors for all of Sunday.

Let `L_0` be the state matrix that shows the number of visitors at each location at 10 am on Sunday.

The number of visitors expected at each location at 11 am on Sunday can be determined by the matrix product

 
`{:(qquadqquadqquadqquadqquadqquadqquadqquadqquadqquadqquadqquadqquadqquadqquadqquadqquadqquadqquadqquadqquadqquadqquadqquad text(this hour)),(qquadqquadqquadqquadqquadqquadqquadqquadqquadqquadqquadqquadqquadqquadqquadqquadqquadqquadqquad qquad qquad  \ A qquad quad F qquad \  G \ quad quad W),({:V xx L_0 qquad text(where) qquad L_0 = [(500), (600), (500), (400)]{:(A),(F),(G),(W):}, qquad text(and):} qquad V = [(0.3,0.4,0.6,0.3),(0.1,0.2,0.1,0.2),(0.1,0.2,0.2,0.1),(0.5,0.2,0.1,0.4)]{:(A),(F),(G),(W):}\ text(next hour)):}`
 

  1. Safety restrictions require that all four locations have a maximum of 600 visitors.
  2. Which location is expected to have more than 600 visitors at 11 am on Sunday?   (1 mark) 

    --- 3 WORK AREA LINES (style=lined) ---

  3. Whenever more than 600 visitors are expected to be at a location on Sunday, the first 600 visitors can stay at that location and all others will be moved directly to Ground World `(G)`.
  4. State matrix `R_n` contains the number of visitors at each location `n` hours after 10 am on Sunday, after the safety restrictions have been enforced.
  5. Matrix `R_1` can be determined from the matrix recurrence relation
  6. `qquad qquad qquad R_0 = [(500),(600),(500),(400)]{:(A),(F),(G),(W):}, qquad qquad R_1 = V xx R_0 + B_1`
  7. where matrix `B_1` shows the required movement of visitors at 11 am.
    1. Determine the matrix `B_1`.   (1 mark)

      --- 4 WORK AREA LINES (style=lined) ---

    2. State matrix `R_2` can be determined from the new matrix rule
    3. `qquad qquad R_2 = VR_1 + B_2`
    4. where matrix `B_2` shows the required movement of visitors at 12 noon.
    5. Determine the state matrix `R_2`.   (1 mark)

      --- 3 WORK AREA LINES (style=lined) ---

Show Answers Only
  1. `text(Location)\ A`
  2.  i. `B_1 = [(-210),(0),(210),(0)]`
    ii. `R_2 = [(600),(288),(512),(600)]`
Show Worked Solution
a.   `text{By inspection (higher decimal values in row 1)}`
  `=>\ text(test location)\ A`
  `text(Visitors at)\ A\ text{(11 am)}` `= 0.3 xx 500 + 0.4 xx 600 + 0.6 xx 500 + 0.3 xx 400`
    `= 810`

 
`text(Location)\ A\ text(will have more than 600 visitors.)`


b.i.   `VR_0` `= [(0.3,0.4,0.6,0.3),(0.1,0.2,0.1,0.2),(0.1,0.2,0.2,0.1),(0.5,0.2,0.1,0.4)][(500),(600),(500),(400)]=[(810),(300),(310),(580)]`
     
  `R_1` `= V xx R_0 + B_1`
    `= [(810),(300),(310),(580)] + [(-210),(0),(210),(0)]`
  `:. B_1` `= [(-210),(0),(210),(0)]`


b.ii.   `R_2` `= [(0.3,0.4,0.6,0.3),(0.1,0.2,0.1,0.2),(0.1,0.2,0.2,0.1),(0.5,0.2,0.1,0.4)][(600),(300),(520),(580)] + B_2`
    `= [(786),(288),(282),(644)] + [(-186),(0),(230),(-44)]= [(600),(288),(512),(600)]`

Filed Under: Transition Matrices - Modified Tagged With: Band 4, Band 5, Band 6, smc-1893-20-State Matrix in discrete period, smc-1893-32-4x4 Matrix

MATRICES, FUR2 2019 VCAA 2

The theme park has four locations, Air World `(A)`, Food World `(F)`, Ground World `(G)` and Water World `(W)`.

The number of visitors at each of the four locations is counted every hour.

By 10 am on Saturday the park had reached its capacity of 2000 visitors and could take no more visitors.

The park stayed at capacity until the end of the day

The state matrix, `S_0`, below, shows the number of visitors at each location at 10 am on Saturday.
 

`S_0 = [(600), (600), (400), (400)] {:(A),(F),(G),(W):}`
 

  1. What percentage of the park’s visitors were at Water World `(W)` at 10 am on Saturday?   (1 mark)

    --- 2 WORK AREA LINES (style=lined) ---

Let `S_n` be the state matrix that shows the number of visitors expected at each location `n` hours after 10 am on Saturday.

The number of visitors expected at each location `n` hours after 10 am on Saturday can be determined by the matrix recurrence relation below.
 

`{:(qquad qquadqquadqquadqquadqquadqquadqquadqquadqquadqquadqquadqquadqquadqquadqquadqquadqquadqquadqquadqquadqquadqquad text(  this hour)),(qquadqquadqquadqquadqquadqquadqquadqquadqquadqquadqquadqquadqquadqquadqquadqquadqquadqquadqquad qquad qquad quad A qquad quad F qquad \  G \ quad quad W),({:S_0 = [(600), (600), (400), (400)], qquad S_(n+1) = T xx S_n quad quad qquad text(where):}\ T = [(0.1,0.2,0.1,0.2),(0.3,0.4,0.6,0.3),(0.1,0.2,0.2,0.1),(0.5,0.2,0.1,0.4)]{:(A),(F),(G),(W):}\ text(next hour)):}`
 

  1. Complete the state matrix, `S_1`, below to show the number of visitors expected at each location at 11 am on Saturday.   (1 mark)

    --- 0 WORK AREA LINES (style=lined) ---

 
`S_1 = [(\ text{______}\ ), (\ text{______}\ ), (300),(\ text{______}\ )]{:(A),(F),(G),(W):}`
 

  1. Of the 300 visitors expected at Ground World `(G)` at 11 am, what percentage was at either Air World `(A)` or Food World `(F)` at 10 am?   (1 mark)

    --- 3 WORK AREA LINES (style=lined) ---

  2. The proportion of visitors moving from one location to another each hour on Sunday is different from Saturday.


    Matrix `V`, below, shows the proportion of visitors moving from one location to another each hour after 10 am on Sunday.


    `qquad qquad {:(qquadqquadqquadqquadqquadtext(this hour)),(qquad qquad qquad \ A qquad quad F qquad \  G \ quad quad W),(V = [(0.3,0.4,0.6,0.3),(0.1,0.2,0.1,0.2),(0.1,0.2,0.2,0.1),(0.5,0.2,0.1,0.4)]{:(A),(F),(G),(W):}\ text(next hour)):}`


    Matrix `V` is similar to matrix `T` but has the first two rows of matrix `T` interchanged.


  3. The matrix product that will generate matrix `V` from matrix `T` is
  4. `qquad qquad V = M xx T`
  5. where matrix `M` is a binary matrix.
  6. Write down matrix `M`.   (1 mark)

    --- 4 WORK AREA LINES (style=lined) ---

Show Answers Only
  1. `20%`
  2. `S_1 = [(300 ), (780), (300),(620)]{:(A),(F),(G),(W):}`
  3. `60%`
  4. `M = [(0,1,0,0), (1,0,0,0), (0,0,1,0), (0,0,0,1)]`
Show Worked Solution

a.   `text(Total visitors)\ =2000`

`text{Percentage}\  (W)` `= 400/2000= 20%`


b.   `S_1` `= TS_0`
    `= [(0.1, 0.2, 0.1, 0.2),(0.3,0.4,0.6,0.3),(0.1,0.2,0.2,0.1),(0.5,0.2,0.1,0.4)][(600),(600),(400),(400)]=[(300),(780),(300),(620)]`


c.  `text(Visitors from)\ A to G= 0.1 xx 600 = 60`

`text(Visitors from)\ F to G= 0.2 xx 600 = 120`

`:.\ text(Percentage of)\ G\ text(at 11 am)= (60 + 120)/300= 60%`
 

d.   `M = [(0,1,0,0), (1,0,0,0), (0,0,1,0), (0,0,0,1)]`


`text(Check:)`

`M xx T = [(0,1,0,0), (1,0,0,0), (0,0,1,0), (0,0,0,1)][(0.1, 0.2, 0.1, 0.2),(0.3,0.4,0.6,0.3),(0.1,0.2,0.2,0.1),(0.5,0.2,0.1,0.4)] = [(0.3,0.4,0.6,0.3),(0.1,0.2,0.1,0.2),(0.1,0.2,0.2,0.1),(0.5,0.2,0.1,0.4)]`

Filed Under: Transition Matrices - Regular Tagged With: Band 3, Band 4, Band 5, page-break-before-question, smc-618-30-State Matrix in discrete period, smc-618-50-Permutation, smc-618-62-4x4 Matrix

Calculus, EXT2 C1 2002 HSC 2b

For  `n = 0, 1, 2,`...

let  `I_n = int_0 ^{(pi)/(4)} tan^(n) theta  d theta`.

  1.  Show that  `I _1 = (1)/(2) ln2`.   (1 mark)

    --- 5 WORK AREA LINES (style=lined) ---

  2.  Show that, for  `n >= 2`,
     
         `I_n + I_(n - 2) = (1)/(n-1)`.   (3 marks)

    --- 6 WORK AREA LINES (style=lined) ---

Show Answers Only
  1. `text(Proof)\ text{(See Worked Solutions)}`
  2. `text(Proof)\ text{(See Worked Solutions)}`
Show Worked Solution

i.         `I_n = int_0 ^{(pi)/(4)} tan^n theta \ d theta`

`I_1` `= int_0 ^{(pi)/(4)} tan theta \ d theta`
  `= [ -ln cos x ]_0 ^{(pi)/(4)}`
  `= [- ln cos\ (pi)/(4) + ln cos 0]`
  `= -ln 2^{-(1)/(2)}`
  `= (1)/(2) ln 2`


ii. `I_n` `= int_0 ^{(pi)/(4)} tan^(n – 2) theta ⋅ tan^2 theta \ d theta`
    `= int_0 ^{(pi)/(4)} tan^(n-2) theta ⋅ (sec^2 theta – 1) d theta`
    `= int_0 ^{(pi)/(4)} tan^(n – 2) theta ⋅ sec^2 theta \ d theta – int_0 ^{(pi)/(4)} tan^(n – 2) theta \ d theta`

 
`text(Let) \ \ u = tan theta`

`(du)/(d theta) = sec^2 theta \ => \ du = sec^2 theta \ d theta`

`text(When)` `theta` `= (pi)/(4),`   `\ \ \ \u` `= 1`
  `theta` `=0,`   `u` `= 0`


`I_n` `= int_0 ^1 u^(n-2) \ du – I_(n – 2)`
  `= [(1)/(n-1) ⋅ u^(n-1)]_0 ^1 – I_(n – 2)`
  `= (1)/(n – 1) – I_(n-2)`

 
`:. \ I_n + I_(n – 2)=(1)/(n – 1)\ \ \ \ (n>=2)`

Filed Under: Recurrence Relations Tagged With: Band 4, Band 5, smc-1054-10-Trig

Calculus, EXT2 C1 2008 HSC 3c

For  `n >= 0`, let  `I_n = int_0 ^{(pi)/(4)} tan^(2n) theta  d theta`.   

  1. Show that for `n >= 1`,
     
         `I _n = (1)/(2n - 1) - I_(n-1)`.  (2 marks)

    --- 6 WORK AREA LINES (style=lined) ---

  2. Hence, or otherwise, calculate  `I_3`.   (2 marks)

    --- 5 WORK AREA LINES (style=lined) ---

Show Answers Only
  1. `text(Proof)\ text{(See Worked Solutions)}`
  2. `(52 – 15 pi)/(60)`
Show Worked Solution
i. `I_n` `= int_0 ^{(pi)/(4)} tan^(2n-2) theta * tan^2 theta \ d theta`
    `= int_0 ^{(pi)/(4)} tan^(2n-2) theta * (sec^2 theta – 1) \ d theta`
    `= int_0 ^{(pi)/(4)} tan^(2n-2) theta * sec^2 theta  d theta – int_0 ^{(pi)/(4)} tan^(2n-2) theta \ d theta`
    `= int_0 ^{(pi)/(4)} tan^(2n-2)theta * sec^2 theta \ d theta – I_(n-1)`


`text(Let) \ \ u = tan theta`

`(du)/(d theta) = sec^2 theta \ => \ du = \ sec^2 theta \ d theta`

`text(When)`    `theta` `= (pi)/(4)` `,` `\ \ \ \u` `= 1`
  `theta` `= 0` `,` `u` `= 0`


`I_n` `= int_0 ^1 u^(2n – 2) \ du – I_(n – 1)`
  `= [1/(2n -1) ⋅ u^(2n – 1)]_0 ^1 – I_(n – 1)`
  `= 1/(2n-1)(1^(2n-1)-0)  – I_(n – 1)`
  `= 1/(2n-1)  – I_(n – 1)`


ii.        `I_0 = int_0 ^{(pi)/(4)} d theta = (pi)/(4)`

`I_3` `= (1)/(5) – I_2`
  `= (1)/(5) – ((1)/(3) – I_1)`
  `= (1)/(5) – (1)/(3) + (1 – I_0)`
  `= (13)/(15) – (pi)/(4)`
  `= (52 – 15 pi)/(60)`

Filed Under: Recurrence Relations Tagged With: Band 4, Band 5, smc-1054-10-Trig

Combinatorics, EXT1 A1 SM-Bank 6

  1. In how many ways can the numbers 9, 8, 7, 6, 5, 4 be arranged around a circle?   (1 mark)

    --- 2 WORK AREA LINES (style=lined) ---

  2. How many of these arrangements have at least two odd numbers together?    (2 marks)

    --- 6 WORK AREA LINES (style=lined) ---

Show Answers Only
  1. `120`
  2. `108`
Show Worked Solution

i.    `text{Fix 9 (or any odd number) on the circle}.`

`text(Arrangements) \ = 5 ! = \ 120`
  

ii.     `text(Fix) \ 9 \ text(on circle).`

  `text(Consider arrangements with no odd numbers together):`


`text{Combinations (clockwise from top)}`

`= 1 × 3 × 2 × 2 × 1 × 1`

`= 12`
 

`:. \ text(Arrangements with at least 2 odds together)`

`= 120 – 12`

`= 108`

Filed Under: Permutations and Combinations (Ext1) Tagged With: Band 3, Band 5, smc-1082-30-Combinations in a Circle

Proof, EXT2 P1 SM-Bank 7

  1. Given  `a + b = 6`  and  `a, b > 0,` show
     
        `(1)/(a) + (1)/(b) >= (2)/(3)`   (2 marks)
      
  2. If  `a + b = c,` show
     
        `(1)/(a^2) + (1)/(b^2) >= (8)/(c^2)`   (2 marks)
Show Answers Only
  1. `text{Proof (See Worked Solutions)}`
  2. `text{Proof (See Worked Solutions)}`
Show Worked Solution

i.   `text(Prove) \ \ (1)/(a) + (1)/(b) >= 2/3 :`

`(a – b)^2` `>= 0`
`(a + b)^2 – 4 ab` `>= 0`
`(a + b)^2` `>= 4ab`
`6 (a + b)` `>= 4 ab\ \ \ (a+b=6)`
`3 (a + b)` `>= 2 ab`
`(a + b)/(ab)` `>= (2)/(3)\ \ \ (a, b > 0\ => \ ab>0)`


ii.   `a + b = c`

`:. \ text(Statement true)`

Filed Under: Uncategorized Tagged With: Band 4, Band 5

Proof, EXT2 P1 SM-Bank 6

If  `x,  y,  z  ∈ R`  and  `x  ≠ y ≠ z`, then   

  1.  Prove  `x^2 + y^2 + z^2 > yz + zx + xy`   (2 marks)

    --- 5 WORK AREA LINES (style=lined) ---

  2.  If  `x + y + z = 1`, show  `yz+zx+xy<1/3`   (2 marks)

    --- 6 WORK AREA LINES (style=lined) ---

Show Answers Only
  1. `text{Proof (See Worked Solutions)}`
  2. `text{Proof (See Worked Solutions)}`
Show Worked Solution

i.   `x^2 + y^2 + z^2 – yz – zx – xy > 0`

`text(Multiply) × 2`

`2x^2 + 2y^2 + 2z^2 – 2yz – 2zx – 2xy > 0`

`(x^2 – 2xy + y^2) + (y^2 – 2yz + z^2) + (z^2 -2xz + x^2) > 0`

`(x – y)^2 + (y – z)^2 + (z – x)^2 > 0`

`text(Square of any rational number) > 0`

`:.\ text(Statement is true.)`


ii.    `(x + y + z)^2` `= x^2 + xy + xz + yx + y^2 + yz + zx + zy + z^2`
  `1` `= x^2 + y^2 + z^2 + 2xy + 2yz + 2xz`

 
`text{Consider statement in part (i):}`

`x^2 + y^2 + z^2 – yz – zx – xy > 0`

`=> (x + y + z)^2 – (x^2 + y^2 + z^2 – yz – zx – xy)<1`

`3xy + 3yz + 3zx` `< 1`
`:. \ yz + zx + xy` `< (1)/(3)`

Filed Under: Proof and Inequalities Tagged With: Band 4, Band 5, smc-1208-20-Proofs using Square > 0, smc-1208-30-Proof using given equation

CORE, FUR2 2019 VCAA 9

Phil would like to purchase a block of land.

He will borrow $350 000 to make this purchase.

Interest on this loan will be charged at the rate of 4.9% per annum, compounding fortnightly.

After three years of equal fortnightly repayments, the balance of Phil’s loan will be $262 332.33.

  1. What is the value of each fortnightly repayment Phil will make?


    Round your answer to the nearest cent.   (1 mark)

    --- 2 WORK AREA LINES (style=lined) ---

  2. What is the total interest Phil will have paid after three years?


    Round your answer to the nearest cent.   (1 mark)

    --- 3 WORK AREA LINES (style=lined) ---

  3. Over the next four years of his loan, Phil will make monthly repayments of $3517.28 and will be charged interest at the rate of 4.8% per annum, compounding monthly.


    Let `B_n` be the balance of the loan `n` months after these changes apply.


    Write down a recurrence relation, in terms of  `B_0, B_(n + 1)` and `B_n`, that could be used to model the balance of the loan over these four years.   (2 marks)

    --- 4 WORK AREA LINES (style=lined) ---

Show Answers Only
  1. `$1704.03`
  2. `$45\ 246.67`
  3. `B_0=262\ 332.33,\ \ \ B_(n+1) = 1.004 B_n – 3517.28`
Show Worked Solution

a.  `text(Find)\ PMT \ text{(by TVM solver)}:`

`N` `= 3 xx 26 = 78`
`I(%)` `= 4.9`
`PV` `= 350\ 000`
`PMT` `= ?`
`FV` `= -262332.33`
`text(P/Y)` `= text(C/Y) = 26`

 
`=> PMT = -1704.030`

`:.\ text(Fortnightly payment) = $1704.03`
  

b.   `text(Total interest)` `= text(Payments) – text(decrease in principal)`
    `= 78 xx 1704.03-(300\ 000-262\ 332.33)`
    `= $45\ 246.67`

  
c.
  `B_0 = 262\ 332.33`

`text(Monthly interest) = 4.8/12 = 0.4%`

`text(Monthly payment) = 3517.28`

`:.\ text(Recurrence relation:)`

`B_0=262\ 332.33,\ \ \ B_(n+1) = 1.004 B_n-3517.28`

Filed Under: Borrowing and Loans, Recursion - Financial Tagged With: Band 5, smc-603-22-Reducible balance loans, smc-603-60-CAS (1 step), smc-603-70-Recurrence relation, smc-717-20-Loans

Financial Maths, GEN2 2019 NHT 8

Phil invests $200 000 in an annuity from which he receives a regular monthly payment.

The balance of the annuity, in dollars, after `n` months, `A_n`, can be modelled by the recurrence relation

`A_0 = 200\ 000, qquad A_(n + 1) = 1.0035\ A_n - 3700`

  1. What monthly payment does Phil receive?   (1 mark)

    --- 1 WORK AREA LINES (style=lined) ---

  2. Show that the annual percentage compound interest rate for this annuity is 4.2%.   (1 mark)

    --- 2 WORK AREA LINES (style=lined) ---

At some point in the future, the annuity will have a balance that is lower than the monthly payment amount.

  1. What is the balance of the annuity when it first falls below the monthly payment amount?


    Round your answer to the nearest cent.   (1 mark)

    --- 2 WORK AREA LINES (style=lined) ---

  2. If the payment received each month by Phil had been a different amount, the investment would act as a simple perpetuity.


    What monthly payment could Phil have received from this perpetuity?   (1 mark)

    --- 2 WORK AREA LINES (style=lined) ---

Show Answers Only
  1. `$3700`
  2. `text(Proof)\ text{(See Worked Solutions)}`
  3. `$92.15`
  4. `$700`
Show Worked Solution

a.  `$3700`

b.   `text(Monthly rate)` `= 0.0035 = 0.35%`
  `text(Annual rate)` `= 12 xx 0.35 = 4.2%`

  
c.
  `text(Find)\ N\ text(when)\ FV = 0\ \ text{(by TVM solver)}:`

`N` `= ?`
`I(%)` `= 4.2`
`PV` `= 200\ 000`
`PMT` `= 3700`
`FV` `= 0`
`text(P/Y)` `= 12`
`text(C/Y)` `= 12`

 
`=> N = 60.024951`

 
`text(Find)\ \ FV\ \ text(when)\ \ N = 60.024951\ \ text{(by TVM solver):}`

`=>FV = $92.15`  

d.  `text(Perpetuity) => text(monthly payment) = text(monthly interest)`

`:.\ text(Perpetuity payment)` `= 200\ 000 xx 4.2/(12 xx 100)`
  `= $700`

Filed Under: Annuities and Perpetuities, Recursion - Financial Tagged With: Band 3, Band 4, Band 5, smc-2512-10-Annuity, smc-2512-20-Perpetuity, smc-2512-50-CAS solver, smc-717-80-Interpret RR

CORE, FUR2 2019 VCAA 7

Phil is a builder who has purchased a large set of tools.

The value of Phil’s tools is depreciated using the reducing balance method.

The value of the tools, in dollars, after `n` years, `V_n` , can be modelled by the recurrence relation shown below.

`V_0 = 60\ 000, qquad V_(n + 1) = 0.9 V_n` 

  1. Use recursion to show that the value of the tools after two years, `V_2` , is $48 600.   (1 mark)

    --- 3 WORK AREA LINES (style=lined) ---

  2. What is the annual percentage rate of depreciation used by Phil?   (1 mark)

    --- 1 WORK AREA LINES (style=lined) ---

  3. Phil plans to replace these tools when their value first falls below $20 000.


    After how many years will Phil replace these tools?   (1 mark)

    --- 4 WORK AREA LINES (style=lined) ---

  4. Phil has another option for depreciation. He depreciates the value of the tools by a flat rate of 8% of the purchase price per annum.


    Let `V_n` be the value of the tools after `n` years, in dollars.


    Write down a recurrence relation, in terms of `V_0, V_(n + 1)` and `V_n`, that could be used to model the value of the tools using this flat rate depreciation.   (1 mark)

    --- 3 WORK AREA LINES (style=lined) ---

Show Answers Only
  1. `text(Proof)\ text{(See Worked Solutions)}`
  2. `text(10%)`
  3. `11\ text(years)`
  4. `V_0=60\ 000,\ \ \ V_(n + 1) = V_n-4800`
Show Worked Solution
a.   `V_0` `= 60\ 000`
  `V_1` `= 0.9 xx 60\ 000 = 54\ 000`
  `V_2` `= 0.9 xx 54\ 000 = $48\ 600`

  
b.
  `text(Depreciation rate) = 0.1 = 10%`

 
c.
  `text(Find)\ \ n\ \ text(such that)`

`60\ 000 xx 0.9^n = 20\ 000`

`=> n = 10.427\ \ \ text{(by CAS)}`

`:.\ text(Phil will replace in the 11th year.)`

 
d.
  `text(Annual depreciation) = 0.08 xx V_0 = 4800`

`:.\ text(Recurrence relation is:)`

`V_0=60\ 000,\ \ \ V_(n + 1) = V_n-4800`

Filed Under: Depreciation Tagged With: Band 3, Band 4, Band 5, smc-602-20-Reducing balance, smc-602-50-Recurrence relation

CORE, FUR2 2019 VCAA 6

The total rainfall, in millimetres, for each of the four seasons in 2015 and 2016 is shown in Table 5 below.

  1. The seasonal index for winter is shown in Table 6 below.


    Use the values in Table 5 to find the seasonal indices for summer, autumn and spring.

  2. Write your answers in Table 6, rounded to two decimal places.   (2 marks)

    --- 4 WORK AREA LINES (style=lined) ---


  3. The total rainfall for each of the four seasons in 2017 is shown in Table 7 below.


    Use the appropriate seasonal index from Table 6 to deseasonalise the total rainfall for winter in 2017.


    Round your answer to the nearest whole number.   (1 mark)

    --- 2 WORK AREA LINES (style=lined) ---

Show Answers Only
  1. `text(See Worked Solutions)`
  2. `186\ text(mm)`
Show Worked Solution
a.  

`text{Average rainfall (2015)}\ = (142 + 156 + 222 + 120)/4 = 160`

`text{Average rainfall (2016)}\ = (135 + 153 + 216 + 96)/4= 150`

`text{SI (Summer)}` `= 1/2 (142/160 + 135/150)=0.89`
`text{SI (Autumn)}` `= 1/2(156/160 + 153/150)=1.00`
`text{SI (Spring)}` `= 1/2 (120/160 + 96/150)=0.70`


b.   `text{Winter (deseasonalised)}` `= 262/1.41`
    `~~ 186\ text(mm)`

Filed Under: Time Series Tagged With: Band 4, Band 5, smc-266-10-Seasonal Index from a Table, smc-266-20-(De)Seasonalising Data

CORE, FUR2 2019 VCAA 5

The scatterplot below shows the atmospheric pressure, in hectopascals (hPa), at 3 pm (pressure 3 pm) plotted against the atmospheric pressure, in hectopascals, at 9 am (pressure 9 am) for 23 days in November 2017 at a particular weather station.
 

A least squares line has been fitted to the scatterplot as shown.

The equation of this line is

pressure 3 pm = 111.4 + 0.8894 × pressure 9 am

  1. Interpret the slope of this least squares line in terms of the atmospheric pressure at this weather station at 9 am and at 3 pm.   (1 mark)

    --- 2 WORK AREA LINES (style=lined) ---

  2. Use the equation of the least squares line to predict the atmospheric pressure at 3 pm when the atmospheric pressure at 9 am is 1025 hPa.
  3. Round your answer to the nearest whole number.   (1 mark)

    --- 2 WORK AREA LINES (style=lined) ---

  4. Is the prediction made in part b. an example of extrapolation or interpolation?   (1 mark)

    --- 1 WORK AREA LINES (style=lined) ---

  5. Determine the residual when the atmospheric pressure at 9 am is 1013 hPa.
  6. Round your answer to the nearest whole number.   (1 mark)

    --- 3 WORK AREA LINES (style=lined) ---

  7. The mean and the standard deviation of pressure 9 am and pressure 3 pm for these 23 days are shown in Table 4 below.

    1. Use the equation of the least squares line and the information in Table 4 to show that the correlation coefficient for this data, rounded to three decimal places, is  `r` = 0.966   (1 mark)

      --- 3 WORK AREA LINES (style=lined) ---

    2. What percentage of the variation in pressure 3 pm is explained by the variation in pressure 9 am?
    3. Round your answer to one decimal place.   (1 mark)

      --- 2 WORK AREA LINES (style=lined) ---

  1. The residual plot associated with the least squares line is shown below.
     

    1. The residual plot above can be used to test one of the assumptions about the nature of the association between the atmospheric pressure at 3 pm and the atmospheric pressure at 9 am.
    2. What is this assumption?   (1 mark)

      --- 2 WORK AREA LINES (style=lined) ---

    3. The residual plot above does not support this assumption.
    4. Explain why.   (1 mark)

      --- 2 WORK AREA LINES (style=lined) ---

Show Answers Only
  1. `text(An increase in 1hPa of pressure at 9 am is associated)`
    `text(with an increase of 0.8894 hPa of pressure at 3 pm.)`
  2. `1023\ text(hPa)`
  3. `text(Interpolation)`
  4. `3\ text(hPa)`
    1. `0.966`
    2. `93.3%`
    1. `text(The assumption is that a linear relationship)`
      `text(exists between the pressure at 9 am and the)`
      `text(pressure at 3 pm.)`
    2. `text(The residual plot does not appear to be random.)`
Show Worked Solution

a.    `text(An increase in 1hPa of pressure at 9 am is associated)`

`text(with an increase of 0.8894 hPa of pressure at 3 pm.)`


b.   `text(pressure 3 pm)` `= 111.4 + 0.8894 xx 1025`
    `= 1023\ text(hPa)`


c.  `text{Interpolation (1025 is within the given data range)}`


d.   `text(Residual)` `= text(actual) – text(predicted)`
    `= 1015 – (111.4 + 0.8894 xx 1013)`
    `= 1015 – 1012.36`
    `= 2.63…`
    `~~ 3\ text(hPa)`


e.i.   `r= b (s_x)/(s_y)`

    `= 0.8894 xx 4.5477/4.1884`
    `= 0.96569…`
    `= 0.966`


e.ii.   `r` `= 0.966`
  `r^2` `= 0.9331`
    `= 93.3%`


f.i.   `text(The assumption is that a linear relationship)`
 

`text(exists between the pressure at 9 am and the)`

`text(pressure at 3 pm.)`


f.ii.  `text(The residual plot does not appear to be random.)`

Filed Under: Correlation and Regression Tagged With: Band 3, Band 4, Band 5, page-break-before-question, smc-265-10-r / r^2 and Association, smc-265-30-LSRL formula, smc-265-40-Interpret Gradient, smc-265-50-Residuals, smc-265-60-Extrapolation / Interpolation

GRAPHS, FUR1 2019 VCAA 8 MC

Jenny and Alan’s house is 900 m from a supermarket.

Jenny is at the house and Alan is at the supermarket.

At 12 noon Jenny leaves the house and walks towards the supermarket.

At the same time, Alan leaves the supermarket and walks towards the house.

Jenny’s planned walk is modelled by the equation
 

`j = {(qquad 120t, qquad qquad 0 < t <= 2), (100t + 40, qquad qquad 2 < t <= 6), (65t + 250, qquad qquad 6 < t <= 10):}`
 

where  `j`  is Jenny’s distance, in metres, from the house after  `t`  minutes.

Alan’s planned walk is modelled by the equation
 

`a= -80t + 900 qquad qquad t > 0`
 

where  `a`  is Alan’s distance, in metres, from the house after  `t`  minutes.

When they meet

  1. Jenny will have walked 359 m, to the nearest metre.
  2. Alan will have walked 360 m, to the nearest metre.
  3. Alan will have walked 382 m, to the nearest metre.
  4. Alan will have walked 518 m, to the nearest metre.
  5. Jenny will have walked 541 m, to the nearest metre.
Show Answers Only

`C`

Show Worked Solution

`text(Sketch Jenny’s path:)`

 
`text(Meet in the period)\ \ =>\ 2 < t <= 6`

`100 t + 40` `= -80t +900`
`180t` `= 860`
`t` `= 4.77…`

 
`text(When)\ \ t = 4.78\ text(minutes,)`

`text(Alan has walked 382 m.)`

`=>  C`

Filed Under: Linear relationships Tagged With: Band 5

GRAPHS, FUR1 2019 VCAA 6 MC

A recipe for a fruit drink lists both pineapple juice and mango juice.

Let  `x`  be the number of millilitres of pineapple juice required to make the fruit drink.

Let  `y`  be the number of millilitres of mango juice required to make the fruit drink.

For every 200 mL of mango juice that is used, at least 300 mL of pineapple juice must be used.

The inequality representing this situation is

  1. `x <= (2y)/3`
  2. `x <= (3y)/2`
  3. `y <= (2x)/3`
  4. `y <= (3x)/2`
  5. `y <= (2x)/5`
Show Answers Only

`C`

Show Worked Solution

`x -> text(pineapple juice)`

`y -> text(mango juice)`

`text(pineapple : mango) >= 300:200`

`x:y` `>= 3:2`
`x/y` `>= 3/2`
`3y` `<= 2x`
`y` `<= (2x)/3`

 
`=>  C`

Filed Under: Linear Programming Tagged With: Band 5

Networks, STD2 N3 SM-Bank 44

A project involves nine activities, `A` to `I`.

The immediate predecessor(s) of each activity is shown in the table below.
 

             Activity            Immediate
     predecessor(s)     
  `A` `-`
  `B` `A`
  `C` `A`
  `D` `B`
  `E` `B, C`
  `F` `D`
  `G` `D`
  `H` `E, F`
  `I` `G, H`

 
A directed network for this project will require a dummy activity.

Sketch the network diagram, clearly identifying the dummy activity.   (3 marks)

Show Answers Only

`B`

Show Worked Solution

`text(Sketch network diagram:)`


`text(The dummy activity needs to be drawn)`

`text(from the end of activity)\ B\ text(to the start)`

`text(of activity)\ E.`

Filed Under: Critical Paths Tagged With: Band 5, smc-916-10-Table to Network, smc-916-50-Dummy Activity

Measurement, STD2 M1 SM-Bank 2 MC

Four identical circles of radius `r` are drawn inside a square, as shown in the diagram below

The region enclosed by the circles has been shaded in the diagram.


The shaded area can be found using

  1. `4 r^2-2 pi r`
  2. `4 r^2-pi r^2`
  3. `4 r-pi r^2`
  4. `2 r^2-pi r^2`
Show Answers Only

`B`

Show Worked Solution

`text(Area of square) = 4r xx 4r = 16r^2`

`text(Area of circles) = 4 pi r^2`

`text(Shaded Area)`

`= 1/4 xx (16r^2-4 pi r^2)`

`= 4 r^2-pi r^2`
 

`=>  B`

Filed Under: Perimeter and Area (Std2-2027), Perimeter, Area and Volume (Std 2) Tagged With: Band 5, smc-6483-50-Area (Circular Measure), smc-798-20-Perimeter and Area (Circular Measure)

GEOMETRY, FUR1 2019 VCAA 8 MC

Four identical circles of radius `r` are drawn inside a square, as shown in the diagram below

The region enclosed by the circles has been shaded in the diagram.


The shaded area can be found using

  1. `4 r^2 - 2 pi r`
  2. `4 r^2 - pi r^2`
  3. `4 r - pi r^2`
  4. `2 r^2 - pi r^2`
  5. `2 r - 2 pi r`
Show Answers Only

`B`

Show Worked Solution

`text(Area of square) = 4r xx 4r = 16r^2`

`text(Area of circles) = 4 pi r^2`

`text(Shaded Area)`

`= 1/4 xx (16r^2 – 4 pi r^2)`

`= 4 r^2 – pi r^2`
 

`=>  B`

Filed Under: Perimeter, Area and Volume Tagged With: Band 5

GEOMETRY, FUR1 2019 VCAA 7 MC

A can of dog food is in the shape of a cylinder. The can has a circumference of 18.85 cm and a volume of 311 cm³.

The height of the can, in centimetres, is closest to

  1.   2.8
  2.   3.0
  3.   6.0
  4. 11.0
  5. 16.5
Show Answers Only

`D`

Show Worked Solution
`2 pi r` `= 18.85`
`r` `= 18.85/(2 pi)`
  `~~ 3.000\ text(cm)`


`pi r^2 h` `= 311`
`h` `= 311/(pi xx 3^2)`
  `~~ 11.0\ text(cm)`

 
`=>  D`

Filed Under: Perimeter, Area and Volume Tagged With: Band 5

Networks, STD2 N3 SM-Bank 41

The directed network below shows the sequence of activities, `A` to `S`, that is required to complete a manufacturing process.

The time taken to complete each activity, in hours, is also shown.
  

  1. Determine the critical path of this network.   (2 marks)
  2. Identify the activities that have a float time of 10 hours.   (2 marks)

    --- 3 WORK AREA LINES (style=lined) ---

Show Answers Only
  1. `ABEJKOQS`
  2. `text(Activity)\ G, N`
Show Worked Solution

i.   `text(Scanning forwards then backwards:)`


`text(Critical Path:)\ \ A-B-E-J-K-O-Q-S`
 

ii.    `text(Using the scanned diagram, activity)\ G and N`

`text(have a float time of 10 hours.)`

Filed Under: Critical Paths Tagged With: Band 5, smc-916-30-Scanning Both Ways

NETWORKS, FUR1 2019 VCAA 8 MC

The directed network below shows the sequence of activities, `A` to `S`, that is required to complete a manufacturing process.

The time taken to complete each activity, in hours, is also shown.
  

The number of activities that have a float time of 10 hours is

  1. 0
  2. 1
  3. 2
  4. 3
  5. 4
Show Answers Only

`B`

Show Worked Solution

`text(Scanning forwards then backwards:)`


`:.\ text(Activities with a float time of 10 hours = 1)`

`=>  B`

Filed Under: Critical Path Analysis Tagged With: Band 5, smc-621-30-Float time/LST

NETWORKS, FUR1 2019 VCAA 7 MC

A project involves nine activities, `A` to `I`.

The immediate predecessor(s) of each activity is shown in the table below.
 

             Activity            Immediate
     predecessor(s)     
  `A` `-`
  `B` `A`
  `C` `A`
  `D` `B`
  `E` `B, C`
  `F` `D`
  `G` `D`
  `H` `E, F`
  `I` `G, H`

 
A directed network for this project will require a dummy activity.

The dummy activity will be drawn from the end of

  1. activity `B` to the start of activity `C`.
  2. activity `B` to the start of activity `E`.
  3. activity `D` to the start of activity `E`.
  4. activity `E` to the start of activity `H`.
  5. activity `E` to the start of activity `F`.
Show Answers Only

`B`

Show Worked Solution

`text(Sketch network diagram:)`


`text(The dummy activity needs to be drawn)`

`text(from the end of activity)\ B\ text(to the start)`

`text(of activity)\ E.`

`=>  B`

Filed Under: Critical Path Analysis Tagged With: Band 5, smc-621-10-Network table, smc-621-50-Dummy activities

NETWORKS, FUR1 2019 STD2 40

A museum is planning an exhibition using five rooms.

The museum manager draws a network to help plan the exhibition. The vertices `A`, `B`, `C`, `D` and `E` represent the five rooms. The number on the edges represent the maximum number of people per hour who can pass through the security checkpoints between the rooms.


  1. What is the capacity of the cut shown?   (1 mark)

    --- 2 WORK AREA LINES (style=lined) ---

  2. The museum manager is planning for a maximum of 240 visitors to pass through the exhibition each hour. By using the 'minimum cut-maximum flow' theorem, the manager determines that the plan does not provide sufficient flow capacity.


    Draw the minimum cut onto the network below and recommend a change that the manager could make to one or more security checkpoints to increase the flow capacity to 240 visitors per hour.   (2 marks)

    --- 4 WORK AREA LINES (style=lined) ---


Show Answers Only
  1. `290`
  2.   

Show Worked Solution
a.    `text(Capacity)` `= 130 + 90 + 70`
    `= 290`

♦♦ Mean mark 32%.
COMMENT: In part (a), edge BC flows from the exit to the entry and is therefore not counted.

b.   `text(Maximum flow capacity:)`
   

`text(Minimum cut = 80 + 40 + 65 + 45 = 230)`

♦♦♦ Mean mark 19%.
COMMENT: In part (b), edge BC now flows from entry to exit in the new “minimum” cut and is counted.

`text(If security is improved to increase the flow)`

`text(between Room C and Room B by 10 visitors)`

`text(per hour, the network’s flow capacity increases)`

`text(to 240.)`

Filed Under: Flow Problems Tagged With: Band 5, Band 6, smc-625-10-Cut Capacity, smc-625-20-Max Flow/Min Cut

MATRICES, FUR1 2019 VCAA 8 MC

An airline parks all of its planes at Sydney airport or Melbourne airport overnight.

The transition diagram below shows the change in the location of the planes from night to night.


There are always `m` planes parked at Melbourne airport.

There are always `s` planes parked at Sydney airport.

Of the planes parked at Melbourne airport on Tuesday night, 12 had been parked at Sydney airport on Monday night.

How many planes does the airline have?

  1. 25
  2. 37
  3. 62
  4. 65
  5. 85
Show Answers Only

`E`

Show Worked Solution

`text(48% of planes parked in Sydney on Monday are parked)`

`text(in Melbourne on Tuesday.)`

`0.48 s` `= 12`
`s` `= 25`

 
`text(S) text(ince there are always)\ m\ text(planes parked in Melbourne)`

`=>\ text(12 from Melbourne must transfer to Sydney.)`

`0.2 m` `= 12`
`m` `= 60`


`:.\ text(Total planes)` `= 25 + 60`
  `= 85`

 
`=>  E`

Filed Under: Transition Matrices - Regular Tagged With: Band 5, smc-618-25-Interpret Diagram

Combinatorics, EXT1 A1 SM-Bank 5

  1. In how many ways can the letters of COOKBOOK be arranged in a line?  (1 mark)

    --- 1 WORK AREA LINES (style=lined) ---

  2. What is the probability that a random rearrangement of the letters has four O's together?  (2 marks)

    --- 5 WORK AREA LINES (style=lined) ---

Show Answers Only
  1. `840`
  2. `1/14`
Show Worked Solution

i.   `text(Combinations) = (8!)/(4!2!) = 840`


ii.   `text(Treat four O’s as one letter)`

`text(Combinations) = 5! = 120`

`text(Adjusting for 2 Ks:)`

`text(Combinations) = (5!)/(2!) = 60`

`:. P(text(4 O’s together))`

`= 60/840`

`= 1/14`

Filed Under: Permutations and Combinations (Ext1) Tagged With: Band 4, Band 5, smc-1082-10-Ordered Combinations

Combinatorics, EXT1 A1 2019 HSC 8 MC

In how many ways can all the letters of the word PARALLEL be placed in a line with the three Ls together?

  1. `(6!)/(2!)`
  2. `(6!)/(2!3!)`
  3. `(8!)/(2!)`
  4. `(8!)/(2!3!)`
Show Answers Only

`A`

Show Worked Solution

`text(Treat 3 L’s as one letter).`

♦ Mean mark 47%.

`text(Combinations of 6 different letters = 6!)`

`text(Adjusting for 2 A’s:)`

`text(Combinations) = (6!)/(2!)`

`=>\ text(A)`

Filed Under: Permutations and Combinations (Ext1) Tagged With: Band 5, smc-1082-10-Ordered Combinations

CORE, FUR1 2019 VCAA 24 MC

Millie invested $20 000 in an account at her bank with interest compounding monthly.

After one year, the balance of Millie’s account was $20 732.

The difference between the rate of interest per annum used by her bank and the effective annual rate of interest for Millie’s investment is closest to

  1. 0.04%
  2. 0.06%
  3. 0.08%
  4. 0.10%
  5. 0.12%
Show Answers Only

`B`

Show Worked Solution

`text(Let)\ \ r = text(bank annual rate)`

`20\ 000 (1 + r/12)^12` `= 20\ 732`
`(1 + r/12)^12` `= (20\ 732)/(20\ 000)`
`1 + r/12` `= 1.003`
`r` `= 0.03600`
  `= 3.6text(%)`


`r_text(effective)` `= [(1 + r/(100 xx 12))^12 – 1] xx 100text(%)`
  `= 3.66text(%)`

 
`:.\ text(Difference) = 0.06text(%)`

`=>  B`

Filed Under: Interest Rates and Investing Tagged With: Band 5, smc-604-25-Effective interest rate

CORE, FUR1 2019 VCAA 23 MC

Joseph borrowed $50 000 to buy a new car.

Interest on this loan is charged at the rate of 7.5% per annum, compounding monthly.

Joseph will fully repay this loan with 60 monthly repayments over five years.

Immediately after the 59th repayment is made, Joseph still owes $995.49

The value of his final repayment, to the nearest cent, will be

  1.    $995.49
  2.    $998.36
  3.  $1001.71
  4.  $1001.90
  5.  $1070.15
Show Answers Only

`C`

Show Worked Solution

`text(Monthly interest rate) = 7.5/12`

`:.\ text(Final payment)` `= 995.49 (1 + 7.5/(12 xx 100))`
  `= $1001.71`

 
`=>  C`

Filed Under: Borrowing and Loans Tagged With: Band 5, smc-603-40-Loans - Other

CORE, FUR1 2019 VCAA 21 MC

The graph below shows the value, in dollars, of a compound interest investment after `n` compounding periods, `V_n`, for a period of four compounding periods.


The coordinates of the point where  `n = 2`  are  `(2, b)`.

The value of  `b`  is

  1. 660.00
  2. 670.00
  3. 672.80
  4. 678.40
  5. 685.60
Show Answers Only

`C`

Show Worked Solution

`text(Let)\ \ r = text(rate of interest)`

`V_0` `= 500`
`V_1` `= V_0 xx (1 + r)^n`
`580` `= 500 (1 + r)^1`
`1 + r` `= 1.16`
`r` `= 16text(%)`


`:. b` `= 500 (1.16)^2`
  `= 672.80`

 
`=>  C`

Filed Under: Interest Rates and Investing Tagged With: Band 5, smc-604-20-Compound interest, smc-604-30-Interest rate graphs

CORE, FUR1 2019 VCAA 15-16 MC

The time series plot below shows the monthly rainfall at a weather station, in millimetres, for each month in 2017.


Part 1

The median monthly rainfall for 2017 was closest to

  1.  53 mm
  2.  82 mm
  3.  96 mm
  4. 103 mm
  5. 111 mm

 
Part 2

If seven-mean smoothing is used to smooth this time series plot, the number of smoothed data points would be

  1.  3
  2.  5
  3.  6
  4.  8
  5. 10
Show Answers Only

`text(Part 1:)\ D`

`text(Part 2:)\ C`

Show Worked Solution

`text(Part 1)`

`text(12 data points)`

`text(Median)` `= text{(6th + 7th)}/2`
  `~~ (97 + 109)/2`
  `~~ 103\ text(mm)`

`=>  D`
 

`text(Part 2)`

`text(January – July)\ =>\ text(First data point)`

`text(February – August)\ =>\ text(S)text(econd data point)`

`qquad vdots`

`text(June – December)\ =>\ text(Sixth data point)`

`=>  C`

Filed Under: Time Series Tagged With: Band 4, Band 5, smc-266-60-MEAN Smoothing

CORE, FUR1 2019 VCAA 13-14 MC

The time, in minutes, that Liv ran each day was recorded for nine days.

These times are shown in the table below.


The time series plot below was generated from this data.
  

Part 1

Both three-median smoothing and five-median smoothing are being considered for this data.

Both of these methods result in the same smoothed value on day number

  1. 3
  2. 4
  3. 5
  4. 6
  5. 7

 
Part 2

A least squares line is to be fitted to the time series plot shown above.

The equation of this least squares line, with day number as the explanatory variable, is closest to

  1. day number = 23.8 + 2.29 × time
  2. day number = 28.5 + 1.77 × time
  3. time = 23.8 + 1.77 × day number
  4. time = 23.8 + 2.29 × day number
  5. time = 28.5 + 1.77 × day number
Show Answers Only

`text(Part 1:)\ E`

`text(Part 2:)\ E`

Show Worked Solution

`text(Part 1)`

`text{Add 3-median (dots) and 5-median (Δ) smoothing to the plot:}`
 

`=>  E`
 

`text(Part 2)`

`text(time) = 28.5 + 1.77 xx text(day number)\ \ \ text{(by CAS)}`

`=>  E`

Filed Under: Correlation and Regression, Time Series Tagged With: Band 4, Band 5, smc-265-20-Find LSRL Equation/Gradient, smc-266-70-MEDIAN Smoothing

CORE, FUR1 2019 VCAA 12 MC

The table below shows the values of two variables  `x`  and  `y`.

The associated scatterplot is also shown.

The explanatory variable is  `x`.


The scatterplot is non-linear.

A squared transformation applied to the variable  `x`  can be used to linearise the scatterplot.

The equation of the least squares line fitted to the linearised data is closest to

  1.  `y = – 1.34 + 0.546x`
  2.  `y = – 1.34 + 0.546x^2`
  3.  `y = 3.93 - 0.00864x^2`
  4.  `y = 34.6 - 10.5x`
  5.  `y = 34.6 - 10.5x^2`
Show Answers Only

`B`

Show Worked Solution

`y = -1.34 + 0.546x^2\ \ \ text{(by CAS)}`

`=>  B`

Filed Under: Correlation and Regression Tagged With: Band 5, smc-265-71-Linearise - Squared/Inverse

CORE, FUR1 2019 VCAA 11 MC

A study was conducted to investigate the effect of drinking coffee on sleep.

In this study, the amount of sleep, in hours, and the amount of coffee drunk, in cups, on a given day were recorded for a group of adults.

The following summary statistics were generated.

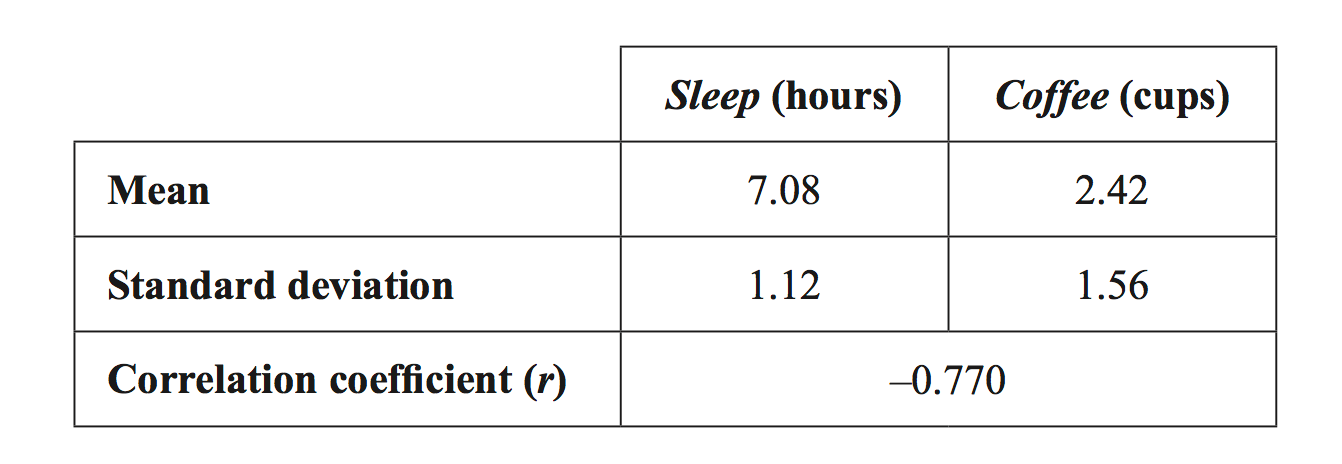
On average, for each additional cup of coffee drunk, the amount of sleep

  1. decreased by 0.55 hours.
  2. decreased by 0.77 hours.
  3. decreased by 1.1 hours.
  4. increased by 1.1 hours.
  5. increased by 2.3 hours.
Show Answers Only

`A`

Show Worked Solution
`b` `= r xx (s_y)/(s_x)`
  `= -0.770 xx 1.12/1.56`
  `= -0.55\ text(hours)`

 
`:.\ text(Sleep decreased by 0.55 hours for each)`

`text(additional cup of coffee.)`

`=>  A`

Filed Under: Correlation and Regression Tagged With: Band 5, smc-265-30-LSRL formula, smc-265-40-Interpret Gradient

Statistics, EXT1 S1 SM-Bank 8

A laptop's battery is considered faulty if its battery life is less than 3 hours.

The laptop supplier knows that the chance of a faulty battery in any laptop is 6.5%.

A random sample of 70 laptops is selected from the supplier and the battery life of each laptop is tested.

Assuming the sample proportion is normally distributed, what is the probability that the percentage of laptops with faulty batteries lies between 5% and 10%?

Give your answer to the nearest percentage.   (3 marks)

--- 8 WORK AREA LINES (style=lined) ---

Show Answers Only

`58 text(%)`

Show Worked Solution

`E(hat p)=p=0.065`

`text(Var)(hat p)` ` = (p(1-p))/n`  
`sigma^2(hat p)` `=(0.065(1-0.065))/70`  
  `=0.0008682…`  
`sigma(hat p)` `=0.029465…`  
     

`hatp\ ~\ N(mu, sigma)\ ~\ N(0.065, 0.029465)`

`ztext{-score (5%)}` `~~(0.05 – 0.065)/0.029465`  
  `~~-0.509`  
     
`ztext{-score (10%)}` `~~(0.10 – 0.065)/0.029465`  
  `~~1.187`  

 
`text{Using probability tables (attached)}:`

`:.P(5 text(%)<=hat p<=10text(%))` `~~P(-0.51<=z<=1.19)`  
  `~~0.8830-0.3050`  
  `~~0.5780`  
  `~~58text(%)`  

Filed Under: Normal Approximations of Sample Proportions (Ext1) Tagged With: Band 5, smc-1085-20-z-score intervals

Statistics, EXT1 S1 SM-Bank 11

Within a particular population, it is known that the percentage of left-handers is 17%.

A research project randomly selects 200 people from this population.

Assuming this sample proportion is normally distributed, what is the probability that the percentage of people that are left-handed in this sample is

  1. greater than 20%   (2 marks)

    --- 6 WORK AREA LINES (style=lined) ---

  2. less than 10%   (2 marks)

    --- 3 WORK AREA LINES (style=lined) ---

Show Answers Only
  1. `0.1292`
  2. `0.0041`
Show Worked Solution

i.   `E(hat p)=p=0.17`

`text(Var)(hat p)` ` = (p(1-p))/n`  
`sigma^2(hat p)` `=(0.17(1-0.17))/200`  
  `=0.0007055…`  
`sigma(hat p)` `=0.02656…`  
     

`hatp\ ~\ N(mu,sigma)\ ~\ N(0.17, 0.02656)`

`ztext{-score (20%)}` `=(x-mu)/sigma`  
  `~~(0.20 – 0.17)/0.02656`  
  `~~1.13`  

 
`text{Using the probability table (attached):}`

`:.P(hat p>20text(%))` `=P(z>1.13)`  
  `=1-0.8708`  
  `=0.1292`  


ii.    `ztext{-score (10%)}` `~~(0.10-0.17)/0.02656`
    `~~-2.64`

 
`text{Using the probability table (attached):}`

`:.P(hatp<10text(%))` `=P(z<-2.64)`  
  `=0.0041`  

Filed Under: Normal Approximations of Sample Proportions (Ext1) Tagged With: Band 4, Band 5, smc-1085-10-Single z-score

Functions, EXT1 F2 SM-Bank 5

The polynomial  `P(x) = x^3 + px^2 + qx + r`  has roots  `sqrtk`, `−sqrtk`  and  `alpha`.

  1.  Explain why  `alpha + p = 0`.  (1 mark)

    --- 2 WORK AREA LINES (style=lined) ---

  2.  Show that  `kalpha = r`.  (1 mark)

    --- 2 WORK AREA LINES (style=lined) ---

  3.  Show that  `pq = r`.  (2 marks)

    --- 5 WORK AREA LINES (style=lined) ---

Show Answers Only
  1. `text(See Worked Solutions)`
  2. `text(See Worked Solutions)`
  3. `text(See Worked Solutions)`
Show Worked Solution

i.   `text(Sum of roots:)`

`sqrtk – sqrtk + alpha` `= −b/a`
`alpha` `= −p`
`alpha + p` `= 0`


ii.   `text(Product of roots:)`

`sqrtk xx −sqrtk xx alpha` `= −d/a`
`−kalpha` `= −r`
`:.kalpha` `= r`


iii.    `sqrtk(−sqrtk) + sqrtk alpha – sqrtk alpha` `= c/d`
  `−k` `= q`

 
`text(Substitute)\ \ k = −q\ \ text(into part (ii)):`

`−qalpha` `= r`
`−q xx – p` `= r\ \ \ text{(using part(i))}`
`:. pq` `= r`

Filed Under: Sum, Products and Multiplicity of Roots (Ext1) Tagged With: Band 4, Band 5, smc-1205-10-Sum and Product

Functions, EXT1 F1 SM-Bank 1

The diagram shows the graph of the function  `f(x) = x/(x - 1)`.


If  `g(x)=x`, draw a separate half-page graph of  `y = f(x) + g(x)`  (2 marks)

Show Answers Only

Show Worked Solution
  `y` `= x + x/(x – 1)`
    `= x + ((x – 1) + 1)/(x – 1)`
    `= x + 1 + 1/(x – 1)`

 
`text(As)\ x -> ∞, \ y -> x + 1`

♦ Mean mark part (iii) 49%.

`text(As)\ x -> – ∞, \ y -> x + 1`


Filed Under: Addition / Multiplication of 2 Graphs (Ext1) Tagged With: Band 5, smc-1073-30-Other

Statistics, SPEC2 2019 VCAA 6

A company produces packets of noodles. It is known from past experience that the mass of a packet of noodles produced by one of the company's machines is normally distributed with a mean of 375 grams and a standard deviation of 15 grams.

To check the operation of the machine after some repairs, the company's quality control employees select two independent random samples of 50 packets and calculate the mean mass of the 50 packets for each random sample.

  1. Assume that the machine is working properly. Find the probability that at least one random sample will have a mean mass between 370 grams and 375 grams. Give your answer correct to three decimal places.   (2 marks)

    --- 5 WORK AREA LINES (style=lined) ---

  2. Assume that the machine is working properly. Find the probability that the means of the two random samples differ by less than 2 grams. Give your answer correct to three decimal places.   (3 marks)

    --- 5 WORK AREA LINES (style=lined) ---

To test whether the machine is working properly after the repairs and is still producing packets with a mean mass of 375 grams, the two random samples are combined and the mean mass of the 100 packets is found to be 372 grams. Assume that the standard deviation of the mass of the packets produced is still 15 grams. A two-tailed test at the 5% level of significance is to be carried out.

  1. Write down suitable hypotheses `H_0` and `H_1` for this test.   (1 mark)

    --- 1 WORK AREA LINES (style=lined) ---

  2. Find the  `p`  value for the test, correct to three decimal places.   (1 mark)

    --- 2 WORK AREA LINES (style=lined) ---

  3. Does the mean mass of the sample of 100 packets suggest that the machine is working properly at the 5% level of significance for a two-tailed test? Justify your answer.   (1 mark)

    --- 2 WORK AREA LINES (style=lined) ---

  4. What is the smallest value of the mean mass of the sample of 100 packets for `H_0` to be not rejected? Give your answer correct to one decimal place.   (1 mark)

    --- 3 WORK AREA LINES (style=lined) ---

Show Answers Only
  1. `0.741`
  2. `0.495`
  3. `H_0: mu = 375`
    `H_1: mu != 375`
  4. `0.046`
  5. `text(See Worked Solutions)`
  6. `372.1`
Show Worked Solution

a.   `barX\ ~\ N(375, (15/sqrt50)^2)`

`text(Pr)(370 <= barX <= 375)`

`= 0.490788…`
 

`text(Pr)(text(not in range)) ~~ 1-0.490788 ~~ 0.509212`

`text(Pr)(text(Samples within range) >= 1)`

`= 1-text(Pr)(text(0 samples in range))`

`~~ 1-(0.509212)^2`

`~~ 0.741`
 

b.   `text(Let)\ \ Y = barX_1-barX_2`

`Y\ ~\ N (0, 2 xx (15^2)/50)`

`text(Pr)(−2 < Y < 2)\ \ (text(by CAS))`

`= text(norm cdf)\ (−2,2,0, sqrt(2 xx (15^2)/50))`

`~~ 0.495`
 

c.   `H_0: \ mu = 375`

`H_1: \ mu != 375`
 

d.   `text(By CAS:)\ \ mu_0 = 375, \ barx = 372, \ sigma = 15, \ n = 100`

`p ~~ 0.046`
 

e.   `p < 0.05 \ => \ text(reject)\ H_0`

`=>\ text(The machine is NOT working properly.)`
 

f.   `text(Pr)(barx <= a) = 0.025\ \ (text(2 sided test))`

`a_text(min)` `= text(inv norm)\ (0.025, 375, 15/sqrt100)`
  `= 372.06…`
  `=372.1`

Filed Under: Confidence Intervals and Hypothesis Testing (SM) Tagged With: Band 4, Band 5, Band 6, smc-1162-20-Other CI (sample), smc-1162-50-Null/Alternative hypothesis

Mechanics, SPEC2 2019 VCAA 5

A mass of  `m_1`  kilograms is initially held at rest near the bottom of a smooth plane inclined at `theta` degrees to the horizontal. It is connected to a mass of  `m_2`  kilograms by a light inextensible string parallel to the plane, which passes over a smooth pulley at the end of the plane. The mass  `m_2`  is 2 m above the horizontal floor.

The situation is shown in the diagram below.


  1. After the mass  `m_1`  is released, the following forces, measured in newtons, act on the system:


    • weight forces  `W_1`  and  `W_2`
    •  the normal reaction force  `N`
    •  the tension in the string  `T`


    On the diagram above, show and clearly label the forces acting on each of the masses.  (1 mark) 

  2. If the system remains in equilibrium after the mass  `m_1`  is released, show that  `sin(theta) = (m_2)/(m_1)`.  (1 mark)
  3. After the mass  `m_1`  is released, the mass  `m_2`  falls to the floor.


    1. For what values of  `theta`  will this occur? Express your answer as an inequality in terms of  `m_1`  and  `m_2`.  (1 mark)
    2. Find the magnitude of acceleration, in ms−2, of the system after the mass  `m_1`  is released and before the mass  `m_2`  hits the floor. Express your answer in terms of  `m_1, \ m_2`  and  `theta`.  (2 marks)
  4. After the mass  `m_1`  is released, it moves up the plane.
    Find the maximum distance, in metres, that the mass  `m_1`  will move up the plane if  `m_1 = 2m_2`  and  `sin(theta) = 1/4`.  (5 marks)
Show Answers Only
  1.   
  2. `text(See Worked Solutions)`
    1. `theta < sin^(−1)\ ((m_2)/(m_1)), theta ∈ (0, pi/2)`
    2. `a = (g(m_2 – m_1 · sin(theta)))/(m_1 + m_2)`
  3. `10/3 \ text(m)`
Show Worked Solution
a.   


b.   `T = m_2g\ \ … \ (1)`

`T = m_1sin(theta)\ \ … \ (2)`

`text{Solve:  (1) = (2)}`

`m_1g sin(theta)` `= m_2g`
`sin(theta)` `= (m_2)/(m_1)`


c.i.   `m_2g > m_1gsin(theta)`

`sin(theta) < (m_2)/(m_1)`

`theta < sin^(−1)\ ((m_2)/(m_1)), \ \ theta ∈ (0, pi/2)`


c.ii.   `text(Net force)\ (F) = m_2g – m_1gsin(theta)`

`(m_1 + m_2) · a` `= g(m_2 – m_1 sin(theta))`
`:. a` `= (g(m_2 – m_1 sin(theta)))/(m_1 + m_2)`


d.   `text(Motion:)\ m_1\ text(will accelerate up the plane for 2 m.)`

 `m_1\ text(will then decelerate up plane until)\ v = 0.`

`text(Find)\ v_(m_1)\ \ text(given)\ \ s_(m_1) = 2, \ u = 0, \ m_1=2m_2`

`a = (g(m_2 – m_1  sintheta))/(m_1 + m_2) = (g(m_2 – 2m_2 · 1/4))/(2m_2 + m_2) = g/6`
 

`text(Using)\ \ v^2 = u^2 + 2as,`

`v_(m_1)^2 = 0 + 2 · g/6 · 2 = (2g)/3`

`text(Find distance)\ (s_2)\ text(for)\ m_1\ text(to decelerate until)\ v = 0:`

`a = −gsintheta = −g/4, \ u = sqrt((2g)/3)`

`0` `= (2g)/3 – 2 · g/4 · s_2`
`s_2` `= (2g)/3 xx 2/g`
  `= 4/3`


`:.\ text(Maximum distance)` `= 2 + 4/3`
  `= 10/3\ text(m)`

Filed Under: Pulleys, Planes and Equilibrium (SM) Tagged With: Band 3, Band 4, Band 5, Band 6

Vectors, SPEC2 2019 VCAA 4

The base of a pyramid is the parallelogram  `ABCD`  with vertices at points  `A(2,−1,3),  B(4,−2,1),  C(a,b,c)`  and  `D(4,3,−1)`. The apex (top) of the pyramid is located at  `P(4,−4,9)`.

  1. Find the values of  `a, b`  and  `c`.  (2 marks)

    --- 5 WORK AREA LINES (style=lined) ---

  2. Find the cosine of the angle between the vectors  `overset(->)(AB)`  and  `overset(->)(AD)`.  (2 marks)

    --- 5 WORK AREA LINES (style=lined) ---

  3. Find the area of the base of the pyramid.  (2 marks)

    --- 5 WORK AREA LINES (style=lined) ---

  4. Show that  `6underset~i + 2underset~j + 5underset~k`  is perpendicular to both  `overset(->)(AB)`  and  `overset(->)(AD)`, and hence find a unit vector that is perpendicular to the base of the pyramid.  (3 marks)

    --- 6 WORK AREA LINES (style=lined) ---

  5. Find the volume of the pyramid.  (2 marks)

    --- 5 WORK AREA LINES (style=lined) ---

Show Answers Only

  1. `a = 6, b = 2, c = −3`
  2. `4/9`
  3. `2sqrt65 u^2`
  4. `text(See Worked Solutions)`
  5. `24\ text(u³)`

Show Worked Solution

a.    `overset(->)(AB)` `= (4-2)underset~i + (−2 + 1)underset~j + (1-3)underset~k`
    `= 2underset~i-underset~j-2underset~k`

 
`text(S)text(ince)\ ABCD\ text(is a parallelogram)\ => \ overset(->)(AB)= overset(->)(DC)`

`overset(->)(DC) = (a-4)underset~i + (b-3)underset~j + (c + 1)underset~k`

`a-4 = 2 \ => \ a = 6`

`b-3 = −1 \ => \ b = 2`

`c + 1 = −2 \ => \ c = −3`


b.   `overset(->)(AB) = 2underset~i-underset~j-2underset~k`

`overset(->)(AD) = 2underset~i + 4underset~j-4underset~k`

`cos angleBAD` `= (overset(->)(AB) · overset(->)(AD))/(|overset(->)(AB)| · |overset(->)(AD)|)`
  `= (4-4 + 8)/(sqrt(4 + 1 + 4) · sqrt(4 + 16 + 16))`
  `= 4/9`


c.    `1/2 xx text(Area)_(ABCD)` `= 1/2 ab sin c`
  `text(Area)_(ABCD)` `= |overset(->)(AB)| · |overset(->)(AD)| *sin(cos^(−1)\ 4/9)`


`:. text(Area)_(ABCD)` `= 3 · 6 · sqrt65/9`
  `= 2sqrt65\ text(u²)`


d.   `text(Let)\ \ underset~r = 6underset~i + 2underset~j + 5underset~k`

`underset~r · overset(->)(AB)` `= 6 xx 2 + 2 xx −1 + 5 xx −2 = 0`
`underset~r · overset(->)(AD)` `= 6 xx 2 + 2 xx 4 + 5 xx −2 = 0`

 
`:. underset~r\ \ text(is ⊥ to)\ \ overset(->)(AB)\ \ text(and)\ \ overset(->)(AD)`

`text(Let)\ \ hatr\ = text(unit vector ⊥ to pyramid base)`

`underset~overset^r = 1/sqrt(6^2 + 2^2 + 5^2) *underset~r = 1/sqrt65(6underset~i + 2underset~j + 5underset~k)`


e.   `text(Find height)\ (h)\ text(of pyramid:)`

`overset(->)(AP)` `= (4-2)underset~i + (−4 + 1)underset~j + (9-3)underset~k`
  `= 2underset~i-3underset~j + 6underset~k`


`h` `= overset(->)(AP) · underset~overset^r`
  `= (2 xx 6/sqrt65)-(3 xx 2/sqrt65) + (6 xx 5/sqrt65)`
  `= 36/sqrt65`


`:. V` `= 1/3 b xx h`
  `= 1/3 xx 2sqrt65 xx 36/sqrt65`
  `= 24\ text(u³)`

Filed Under: Vector Lines, Planes and Geometry Tagged With: Band 3, Band 4, Band 5, smc-1177-20-Pyramids, smc-1177-60-3D problems

Calculus, SPEC2 2019 VCAA 3

  1. The growth and decay of a quantity `P` with respect to time `t` is modelled by the differential equation
     
    `qquad qquad(dP)/(dt) = kP`
     
    where `t >= 0`.

    1. Given that  `P(a) = r`  and  `P(b) = s`, where `P` is a function of `t`,


      show that  `k = 1/(a-b)log_e(r/s)`.   (2 marks)

      --- 6 WORK AREA LINES (style=lined) ---

    2. Specify the condition(s) for which  `k >0`.   (2 marks)

      --- 5 WORK AREA LINES (style=lined) ---

  2. The growth of another quantity `Q` with respect to time `t` is modelled by the differential equation
     
       `qquad qquad (dQ)/(dt) = e^(t-Q)`
      
    where  `t >= 0`  and  `Q = 1`  when  `t = 0`.

    1. Express this differential equation in the form  `int f(Q)\ dQ = int h(t)\ dt`.   (1 mark)

      --- 2 WORK AREA LINES (style=lined) ---

    2. Hence, show that  `Q = log_e(e^t + e-1)`.   (2 marks)

      --- 5 WORK AREA LINES (style=lined) ---

    3. Show that the graph of `Q` as a function of `t` does not have a point of inflection.   (2 marks)

      --- 5 WORK AREA LINES (style=lined) ---

Show Answers Only
    1. `text(See Worked Solutions)`
    2. `a-b\ text(and)\ s > r > 0`
    1. `int e^Q\ dQ =  int e^t\ dt`
    2. `text(See Worked Solutions)`
    3. `text(See Worked Solutions)`
Show Worked Solution
a.i.    `(dP)/(dt)` `= kP`
  `(dt)/(dP)` `= 1/(kP)`

`t = 1/k int 1/P\ dP = 1/k log_e P + c`

`P(a) = r`

`a = 1/k · log_e r + c`

`P(b) = r`

`b = 1/k · log_e s + c`

`a-b` `= 1/k(log_e r + c-log_e s + c)`
`:.k` `= 1/(a-b)log_e (r/s)`


a.ii.   `text(Conditions for)\ \ k > 0,`

`text(Scenario 1:)`

`a-b > 0\ \ text(and)\ \ log_e(r/s) > 0`

`=> a > b\ \ text(and)\ \ r > s > 0`
 

`text(Scenario 2:)`

`a-b < 0\ \ text(and)\ \ log_e(r/s) < 0`

`=> a < b\ \ text(and)\ \ s > r > 0`
 

b.i.    `(dQ)/(dt)` `= (e^t)/(e^Q)`
  `int e^Q dQ` `= int e^t\ dt`


b.ii.    `int e^Q dQ` `= int e^t dt`
  `e^Q` `= e^t + c`

 
`text(When)\ \ Q = 1,  t = 0`

`e` `= e^0 + c`
`c` `= e-1`
`e^Q` `= e^t + e-1`

 
`:. Q = log_e(e^t + e-1)`


b.iii.   `Q = log_e(e^t + e-1)`

`(dQ)/(dt)` `= (e^t)/(e^t + e-1)`
`(d^2Q)/(dt^2)` `= (e^t(e-1))/((e^t + e-1)^2)`

 
`(d^2Q)/(dt^2) > 0\ text(for)\ t >= 0`

`:.\ text(No POI)`

Filed Under: Applied Contexts Tagged With: Band 4, Band 5, smc-1184-60-Growth and decay

Complex Numbers, SPEC2 2019 VCAA 2

  1. Show that the solutions of  `2z^2 + 4z + 5 = 0`, where  `z ∈ C`, are  `z = −1 ± sqrt6/2 i`.   (1 mark)

    --- 3 WORK AREA LINES (style=lined) ---

  2. Plot the solutions of  `2z^2 + 4z + 5 = 0`  on the Argand diagram below.   (1 mark)

    --- 0 WORK AREA LINES (style=lined) ---


Let  `|z + m| = n`, where  `m, n ∈ R`, represent the circle of minimum radius that passes through the solutions of  `2z^2 + 4z + 5 = 0`.

    1. Find  `m`  and  `n`.   (2 marks)

      --- 3 WORK AREA LINES (style=lined) ---

    2. Find the cartesian equation of the circle  `|z + m| = n`.   (1 mark)

      --- 2 WORK AREA LINES (style=lined) ---

    3. Sketch the circle on the Argand diagram in part a.ii. Intercepts with the coordinate axes do not need to be calculated or labelled.   (1 mark)

      --- 0 WORK AREA LINES (style=lined) ---

  1. Find all values of  `d`, where  `d ∈ R`, for which the solutions of  `2z^2 + 4z + d = 0`  satisfy the relation  `|z + m| <= n`.   (2 marks)

    --- 4 WORK AREA LINES (style=lined) ---

  2. All complex solutions of  `az^2 + bz + c = 0`  have non-zero real and imaginary parts.


    Let  `|z + p| = q`  represent the circle of minimum radius in the complex plane that passes through these solutions, where  `a, b, c, p, q ∈ R`.


    Find  `p`  and  `q`  in terms of  `a, b`  and  `c`.   (2 marks)

    --- 4 WORK AREA LINES (style=lined) ---

Show Answers Only
  1. `text(See Worked Solutions)`
  2.   
  3. `m = 1, n = sqrt6/2`
  4. `(x + 1)^2 + y^2 = 3/2`
  5. `−1 <= d <= 5\ \ (text(by CAS))`
  6. `p = b/(2a), \ q = |sqrt(b^2-4ac)/(2a)|`
Show Worked Solution
a.i.    `z` `= (−b ± sqrt(b^2-4ac))/(2a)`
    `= (−4 ± sqrt(16-4 · 2 · 5))/(4)`
    `= (−4 ± 2sqrt6 i)/(4)`
    `= −1 ± sqrt6/2 i\ \ …\ text(as required)`


a.ii.   


b.i.   `text(Radius of circle = )sqrt6/2`

 `text(Centre) = (0, −1)`

`:. m = 1, \ n = sqrt6/2`


b.ii.    `|z + 1|` `= sqrt6/2`
  `|x + iy + 1|` `= sqrt6/2`
  `(x + 1)^2 + y^2` `= 3/2`


b.iii.   


c.   `text(Solve:)\ 2z^2 + 4z + d = 0`

`z = −1 ± sqrt(4-2d)/2 = −1 ± sqrt((2-d)/2)`

`z + 1 = ± sqrt((2-d)/2)`
 

`text(Solve for)\ d\ text(such that:)`

`|sqrt((2-d)/2)| <= sqrt6/2`

`−1 <= d <= 5\ \ (text(by CAS))`


d.   `z = (−b ± sqrt(b^2-4ac))/(2a) = (−b)/(2a) ± sqrt(b^2-4ac)/(2a)`

`z + b/(2a)` `= ± sqrt(b^2-4ac)/(2a)`
`|z + b/(2a)|` `= |sqrt(b^2-4ac)/(2a)|`

 
`:. p = b/(2a), \ q = |sqrt(b^2-4ac)/(2a)|`

Filed Under: Factors and Roots (SM), Geometry and Complex Numbers (SM) Tagged With: Band 3, Band 4, Band 5, Band 6, smc-1172-10-Quadratic roots, smc-1172-60-Sketch solutions, smc-1173-10-Circles

Calculus, SPEC2 2019 VCAA 1

A curve is defined parametrically by  `x = sec(t) + 1, \ y = tan(t)`, where  `t ∈ [0, pi/2)`.

  1. Show that the curve can be represent in cartesian form by the rule  `y = sqrt(x^2-2x)`.   (2 marks)

    --- 5 WORK AREA LINES (style=lined) ---

  2. State the domain and range of the relation given by  `y = sqrt(x^2-2x)`.  (2 marks)

    --- 4 WORK AREA LINES (style=lined) ---

  3.  i. Express  `(dy)/(dx)`  in terms of  `sin(t)`.   (2 marks)

    --- 4 WORK AREA LINES (style=lined) ---

  4. ii. State the limiting value of  `(dy)/(dx)`  as  `t`  approaches  `pi/2`.   (1 mark)

    --- 4 WORK AREA LINES (style=lined) ---

  1. Sketch the curve  `y = sqrt(x^2-2x)`  on the axes below for  `x ∈ [2, 4]`, labelling the endpoints with their coordinates.   (2 marks)

    --- 0 WORK AREA LINES (style=lined) ---


  2. The portion of the curve given by  `y = sqrt(x^2-2x)`  for  `x ∈ [2, 4]`  is rotated about the `y`-axis to form a solid of revolution.
  3. Write down, but do not evaluate, a definite integral in terms of  `t`  that gives the volume of the solid formed.   (2 marks)

    --- 6 WORK AREA LINES (style=lined) ---

Show Answers Only
  1. `text(See Worked Solutions)`
  2. `text(Domain:)\ x ∈ [2, ∞)`


    `text(Range:)\ y ∈ [0, ∞)`

    1. `(dy)/(dx) = ((dy)/(dt))/((dt)/(dx)) = (sec^2(t))/(sin(t)sec^2(t)) = 1/(sin(t))`
    2. `(dy)/(dx) -> 1`
  3.  
  4. ` V = pi int_0^(tan^(−1)(2sqrt2)) (sec(t) + 1)^2sec^2(t)dt`
Show Worked Solution

a.   `x = sec(t) + 1 \ => \ sec(t) = x-1`

`y = tan(t)`

`text(Using)\ \ tan^2(t) + 1 = sec^2(t):`

`y^2 + 1` `= (x-1)^2`
`y^2 + 1` `= x^2-2x + 1`
`y^2` `= x^2-2x`
`y` `= sqrt(x^2-2x), \ y >= 0\ \ text(as)\ \ t ∈ [0, pi/2)`


b.   `text(Sketch:)\ \ x = sec(t) + 1, \ y = tan(t)\ \ text(for)\ \ t ∈ [0, pi/2)`

`text(Domain:)\ \ x ∈ [2, ∞)`

`text(Range:)\ \ y ∈ [0, ∞)`


c.i.   `(dy)/(dt) = sec^2(t), \ (dx)/(dt) = sin(t)sec^2(t)\ \ \ (text(by CAS))`

`(dy)/(dx) = ((dy)/(dt))/((dx)/(dt)) = (sec^2(t))/(sin(t)sec^2(t)) = 1/(sin(t))`


c.ii.   `text(As)\ \ t -> pi/2:`

`(dy)/(dx) -> 1`


d.   


e.   `V = pi int_0^(2sqrt2) x^2\ dy`

`x^2 = (sec(t) + 1)^2`

`(dy)/(dt) = sec^2(t) \ => \ dy = sec^2(t)\ dt`

`text(When)\ y = 0, t = 0`

`text(When)\ y = 2sqrt2, t = tan^(−1)(2sqrt2)`
 

`:. V = pi int_0^(tan^(−1)(2sqrt2)) (sec(t) + 1)^2sec^2(t)\ dt`

Filed Under: Solids of Revolution, Trigonometry (SM) Tagged With: Band 3, Band 4, Band 5, smc-1150-20-Parametric, smc-1180-30-Square root, smc-1180-60-y-axis rotation

Statistics, SPEC2 2019 VCAA 20 MC

The random number function of a calculator is designed to generate random numbers that are uniformly distributed from 0 to 1. When working properly, a calculator generates random numbers from a population where  `mu = 0.5`  and  `sigma = 0.2887`

When checking the random number function of a particular calculator, a sample of 100 random numbers was generated and was found to have a mean of  `barx = 0.4725`.

Assuming  `H_0: mu = 0.5`  and  `H_1: mu < 0.5`, and  `sigma = 0.2887`, the  `p`  value for a one-sided test is

  1. 0.0953
  2. 0.1704
  3. 0.4621
  4. 0.8296
  5. 0.9525
Show Answers Only

`B`

Show Worked Solution

`text(Standard Deviation)\ (barx) = 0.2887/sqrt100 = 0.02887`

`p` `= text(Pr)(barx <= 0.4725 | mu = 0.5)`
  `~~ 0.1704\ \ \ text{(by CAS)}`

 
`=>B`

Filed Under: Confidence Intervals and Hypothesis Testing (SM) Tagged With: Band 5, smc-1162-30-One-tail test, smc-1162-50-Null/Alternative hypothesis

Vectors, SPEC2 2019 VCAA 15 MC

A particle is moving along the `x`-axis with velocity  `underset~v = u underset~i`, where  `u`  is a real constant.

At time  `t = 0`, a force acts on the particle, causing it to accelerate with acceleration  `underset~a = alpha underset~j`, where  `alpha`  is a negative real constant.

Which one of the following statements correctly describes the motion of the particle for  `t > 0`?

  1. The particle show down, stops momentarily and then begins to move in the opposite direction to its original motion.
  2. The particle continues to travel along the `x`-axis with decreasing speed.
  3. The particle travels parallel to the `y`-axis.
  4. The particle moves along a circular arc.
  5. The particle moves along a parabola.
Show Answers Only

`E`

Show Worked Solution

`underset~a = alpha underset~j`

`text(Once force acts on particle:)`

`underset~v = u underset~i + alphat underset~j,\ \ \ (text(let)\ c_1 = 0)`

`underset~r = utunderset~i + alpha/2 t^2 underset~j,\ \ \ (text(let)\ c_2 = 0)`

`underset~r\ \ text(describes a parabola.)`

`=>E`

Filed Under: Forces and Motion Along a Curve Tagged With: Band 5, smc-1179-50-Motion and integration

Vectors, SPEC2 2019 VCAA 12 MC

The vector resolute of  `underset~i + underset~j - underset~k`  in the direction of  `m underset~i + n underset~j + p underset~k`  is  `2underset~i - 3underset~j + underset~k`,  where  `m, n`  and  `p`  are real constants.

The values of  `m, n`  and  `p`  can be found by solving the equations.

  1. `(m(m + n - p))/(m^2 + n^2 + p^2) = 2, \ (n(m + n - p))/(m^2 + n^2 + p^2) = −3 and (p(m + n - p))/(m^2 + n^2 + p^2) = 1`
  2. `(m(m + n - p))/(m^2 + n^2 + p^2) = 1, \ (n(m + n - p))/(m^2 + n^2 + p^2) = 1 and (p(m + n - p))/(m^2 + n^2 + p^2) = −1`
  3. `m + n - p = 6, \ m + n - p = −9 and m + n - p = −3`
  4. `m + n - p = 3m, \ m + n - p = 3n and m + n - p = −3p`
  5. `m + n - p = 2sqrt3, \ m + n - p = −3sqrt3 and m + n - p = sqrt3`
Show Answers Only

`A`

Show Worked Solution

`underset~a = underset~i + underset~j – underset~k`

`underset~b = m underset~i + n underset~j + p underset~k`

`overset^b = (m underset~i + n underset~j + p underset~k)/sqrt(m^2 + n^2 + p^2)`

`text(Vector resolute)`

`= (underset~a · overset^b)overset^b`

`= (m + n – p)/(m^2 + n^2 + p^2) (m underset~i + n underset~j + p underset~k)`

`= 2underset~i – 3underset~j + underset~k`

`=>A`

Filed Under: Basic Concepts and Calculations Tagged With: Band 5, smc-1176-40-Vector resolute

Calculus, MET2 2019 VCAA 5

Let  `f: R -> R, \ f(x) = 1-x^3`. The tangent to the graph of `f` at  `x = a`, where  `0 < a < 1`, intersects the graph of `f` again at `P` and intersects the horizontal axis at `Q`. The shaded regions shown in the diagram below are bounded by the graph of `f`, its tangent at  `x = a`  and the horizontal axis.
 

  1. Find the equation of the tangent to the graph of `f` at  `x = a`, in terms of `a`.   (1 mark)

    --- 3 WORK AREA LINES (style=lined) ---

  2. Find the `x`-coordinate of `Q`, in terms of `a`.   (1 mark)

    --- 3 WORK AREA LINES (style=lined) ---

  3. Find the `x`-coordinate of `P`, in terms of `a`.   (2 marks)

    --- 4 WORK AREA LINES (style=lined) ---

Let  `A`  be the function that determines the total area of the shaded regions.

  1. Find the rule of `A`, in terms of `a`.   (3 marks)

    --- 5 WORK AREA LINES (style=lined) ---

  2. Find the value of `a` for which `A` is a minimum.   (2 marks)

    --- 3 WORK AREA LINES (style=lined) ---

Consider the regions bounded by the graph of `f^(-1)`, the tangent to the graph of `f^(-1)` at  `x = b`, where  `0 < b < 1`, and the vertical axis.

  1. Find the value of `b` for which the total area of these regions is a minimum.   (2 marks)

    --- 4 WORK AREA LINES (style=lined) ---

  2. Find the value of the acute angle between the tangent to the graph of `f` and the tangent to the graph of `f^(-1)` at  `x = 1`.   (1 mark)

    --- 4 WORK AREA LINES (style=lined) ---

Show Answers Only
  1. `y = 2a^3-3a^2x + 1`
  2. `(2a^3 + 1)/(3a^2)`
  3. `-2a`
  4. `(80a^6 + 8a^3-9a^2 + 2)/(12a^2)`
  5. `10^(-1/3)`
  6. `9/10`
  7. `tan^(-1)(1/3)`
Show Worked Solution

a.   `f(x) = 1-x^3,\ \ f^{\prime}(x) = -3x^2`

`m_text(tang) = -3a^2\ \ text(through)\ \ (a, 1-a^3)`

`y = 2a^3-3a^2x + 1`
 

b.   `text(Solve for)\ \x:`

`2a^3-3a^2x + 1 = 0`

`x = (2a^3 + 1)/(3a^2)`
 

c.   `text(Solve for)\ \ x:`

`2a^3-3a^2x + 1 = 1-x^3`

`x=-2a`

`:. x text(-coordinate of)\ P = -2a`
 

d.   `P(-2a, 8a^3 + 1),\ \ Q((2a^3 + 1)/(3a^2), 0)`

`A` `= text(Area of triangle)-int_(-2a)^1 f(x)\ dx`
  `= 1/2((2a^3 + 1)/(3a^2) + 2a)(8a^3 + 1)-int_(-2a)^1 1-x^3\ dx`
  `= (80a^6 + 8a^3-9a^2 + 2)/(12a^2)\ \ text{(by CAS)}`


e.   `text(Solve for)\ a: \ (dA)/(da) = 0\ \ text{(by CAS)}`

`a = 10^(-1/3)`
 

f.   `text(Consider)\ f(x):\ \ f(10^(-1/3)) = 9/10`

`A_text(min)\ text(for)\ \ f(x)\ \ text(occurs at)\ \ (10^(-1/3), 9/10)`

`=> A_text(min)\ text(for)\ \ f^(-1)(x)\ \ text(occurs when)\ \ x=9/10`

`:. b = 9/10`
 

g.   `f^{\prime} (1)  = -3`

`text(Gradient of)\ \  f^(-1)(x)\ \ text(at)\ \ x = 1\ \ text(is vertical line.)`

`tan theta` `= 1/3`
`theta` `= tan^(-1)(1/3)`
  `=18.4°\ \ text{(to 1 d.p.)}`

Filed Under: Area Under Curves, Maxima and Minima, Tangents and Normals Tagged With: Band 4, Band 5, Band 6, smc-634-10-Polynomial, smc-634-50-Find tangent given curve, smc-641-10-Area, smc-723-20-Cubic, smc-723-80-Area between graphs

Statistics, 2ADV S3 SM-Bank 18

The Lorenz birdwing is the largest butterfly in a habitat.

The probability density function that describes its life span, \(X\), in weeks, is given by
 

\(f(x)= \begin{cases}
\dfrac{4}{625}\left(5 x^3-x^4\right) & 0 \leq x \leq 5 \\
\\
0 & \text {elsewhere }\end{cases}\)
 

In a sample of 80 Lorenz birdwing butterflies, how many butterflies are expected to live longer than two weeks, correct to the nearest integer?  (2 marks)

--- 6 WORK AREA LINES (style=lined) ---

Show Answers Only

\(73\)

Show Worked Solution

\(\begin{aligned} \operatorname{Pr}(X>2) & =\dfrac{4}{625} \int_2^5 5 x^3-x^4 \, dx \\
& =\dfrac{4}{625}\left[\dfrac{5}{4} x^4-\dfrac{x^5}{5}\right]_2^5 \\
& =\dfrac{4}{625}\left[\left(\dfrac{5^5}{4}-\dfrac{5^5}{5}\right)-\left(\dfrac{5}{4} \times 2^4-\dfrac{2^5}{5}\right)\right] \\
& =\dfrac{4}{625}\left[\dfrac{625}{4}-\dfrac{68}{5}\right] \\
& =0.9129 \ldots\end{aligned}\)


\(\begin{aligned} \therefore \text { Expected number } & =80 \times 0.9129 \ldots \\ & \approx 73.03 \\ & \approx 73\end{aligned}\)

Filed Under: Probability Density Functions (Y12) Tagged With: Band 5, smc-994-30-Other Probability, smc-994-60-Polynomial PDF

Statistics, MET2 2019 VCAA 4

The Lorenz birdwing is the largest butterfly in Town A.

The probability density function that describes its life span, `X`, in weeks, is given by
 

`f(x) = {(4/625 (5x^3-x^4), quad 0 <= x <= 5),(0, quad text(elsewhere)):}`
 

  1. Find the mean life span of the Lorenz birdwing butterfly.  (2 marks)

    --- 3 WORK AREA LINES (style=lined) ---

  2. In a sample of 80 Lorenz birdwing butterflies, how many butterflies are expected to live longer than two weeks, correct to the nearest integer?  (2 marks)

    --- 3 WORK AREA LINES (style=lined) ---

  3. What is the probability that a Lorenz birdwing butterfly lives for at least four weeks, given that it lives for at least two weeks, correct to four decimal places?  (2 marks)

    --- 3 WORK AREA LINES (style=lined) ---

The wingspans of Lorenz birdwing butterflies in Town A are normally distributed with a mean of 14.1 cm and a standard deviation of 2.1 cm.

  1. Find the probability that a randomly selected Lorenz birdwing butterfly in Town A has a wingspan between 16 cm and 18 cm, correct to four decimal places.  (1 mark)

    --- 2 WORK AREA LINES (style=lined) ---

  2. A Lorenz birdwing butterfly is considered to be very small if its wingspan is in the smallest 5% of all the Lorenz birdwing butterflies in Town A.


    Find the greatest possible wingspan, in centimetres, for a very small Lorenz birdwing butterfly in Town A, correct to one decimal place.  (1 mark)

    --- 4 WORK AREA LINES (style=lined) ---

Each year, a detailed study is conducted on a random sample of 36 Lorenz birdwing butterflies in Town A.

A Lorenz birdwing butterfly is considered to be very large if its wingspan is greater than 17.5 cm. The probability that the wingspan of any Lorenz birdwing butterfly in Town A is greater than 17.5 cm is 0.0527, correct to four decimal places.

    1. Find the probability that three or more of the butterflies, in a random sample of 36 Lorenz birdwing butterflies from Town A, are very large, correct to four decimal places.  (1 mark)

      --- 2 WORK AREA LINES (style=lined) ---

    2. The probability that `n` or more butterflies, in a random sample of 36 Lorenz birdwing butterflies from Town A, are very large is less than 1%.


      Find the smallest value of `n`, where `n` is an integer.  (2 marks)

      --- 5 WORK AREA LINES (style=lined) ---

    3. For random samples of 36 Lorenz birdwing butterflies in Town A, `hat p` is the random variable that represents the proportion of butterflies that are very large.
    4. Find the expected value and the standard deviation of `hat p`, correct to four decimal places.  (2 marks)

      --- 2 WORK AREA LINES (style=lined) ---

    5. What is the probability that a sample proportion of butterflies that are very large lies within one standard deviation of 0.0527, correct to four decimal places? Do not use a normal approximation.  (2 marks)

      --- 5 WORK AREA LINES (style=lined) ---

  1. The Lorenz birdwing butterfly also lives in Town B.


    In a particular sample of Lorenz birdwing butterflies from Town B, an approximate 95% confidence interval for the proportion of butterflies that are very large was calculated to be (0.0234, 0.0866), correct to four decimal places.


    Determine the sample size used in the calculation of this confidence interval.  (2 marks)

    --- 5 WORK AREA LINES (style=lined) ---

Show Answers Only

  1. `10/3`
  2. `73`
  3. `0.2878`
  4. `0.1512`
  5. `10.6\ text(cm)`
    1. `0.2947`
    2. `7`
    3. `0.0372`
    4. `0.7380`
  6. `200`

Show Worked Solution

a.    `mu` `= 4/625 int_0^5 x(5x^3-x^4)\ dx`
    `= 4/625[x^5-1/6 x^6]_0^5`
    `= 10/3\ \ \ text{(by CAS)}`


b.    `text(Pr)(X > 2)` `= 4/625 int_2^5 5x^3-x^4\ dx`
    `= 4/625[5/4x^4-x^5/5]_2^5`
    `= 0.9129…`


`:.\ text(Expected number)` `= 80 xx 0.9129…`
  `~~ 73.03`
  `~~ 73`


c.    `text(Pr)(X = 4|X> 2)` `= (text(Pr)(X >= 4))/(text(Pr)(X >= 2))`
    `= 0.26272/0.91296`
    `= 0.2878`


d.   `W\ ~\ N (14.1, 2.1^2)`

`text(Pr)(16 < W < 18) = 0.1512\ \ \ text{(by CAS)}`


e.   `text(Solution 1:)`

`text(Pr)(W < w) = 0.05`

`text(Pr)(Z < z) = 0.05\ \ =>\ \ z = -1.6449\ \ text{(by CAS)}`

`(w-14.1)/2.1` `= -1.6449`
`w` `= 10.6\ text(cm)`

 
`text(Solution 2:)`

`text(invNorm)`

`text(Tail setting: left)`

`text(prob: 0.05)`

`sigma: 2.1`

`mu: 14.1`

`=> 10.6\ \ \ text{cm (by CAS)}`


f.i.   `L\ ~\ text(Bi)(n, p)\ ~\ text(Bi) (36, 0.0527)`

`text(Pr)(L >= 3) ~~ 0.2947`


f.ii.    `text(Pr)(L >= n) < 0.01`
 

`text(CAS: binomialCdf) (x, 36, 36, 0.0527)`

`text(Pr)(L >= 0) = 0.011 > 0.01`

`text(Pr)(L >= 7) = 0.002 < 0.01`

`:.\ text(Smallest)\ n = 7`


f.iii.    `E(hat p)` `= p = 0.0527`
  `sigma(hat p)` `= sqrt((p(1-p))/n) = sqrt((0.0527(1-0.0527))/36) ~~ 0.0372`


f.iv.        `hat p +- 1 sigma: (0.0527-0.0372, 0.0527 + 0.0372) = (0.0155, 0.0899)`

`text(Pr)(0.0155 < hat p < 0.0899)`

`= text(Pr)(36 xx 0.0155 < L < 36 xx 0.0899)`

`= text(Pr)(0.56 < L < 3.24)`

`= text(Pr)(1 <= L <= 3)`

`~~ 0.7380`


g.   `0.0234 = hat p-1.96 sqrt((hat p(1-hat p))/n) qquad text{… (1)}`

`0.0866 = hat p + 1.96 sqrt((hat p(1-hat p))/n) qquad text{… (2)}`

`text(Solve simultaneous equations:)`

`hat p ~~ 0.055, quad n ~~ 199.96`

`:.\ text(Sample size) = 200`

Filed Under: Binomial, Normal Distribution, Probability density functions Tagged With: Band 3, Band 4, Band 5, Band 6, smc-637-10-E(X), smc-637-40-Conditional probability, smc-637-45-Other probability, smc-638-20-binomCdf (CAS), smc-638-32-Find E(X)/var(X) given n p, smc-719-10-Single z-score, smc-719-20-95% confidence intervals

Calculus, SPEC1 2019 VCAA 10 MC


Sand falls from a chute to form a pile in the shape of a right circular cone with semi-vertex angle 60°. Sand is added to the pile at a rate of 1.5 m³ per minute.

The rate at which the height  `h`  metres of the pile is increasing, in metres per minute, when the height of the pile is 0.5 m, correct to two decimal places, is

  1. 0.21
  2. 0.31
  3. 0.64
  4. 3.82
  5. 3.53
Show Answers Only

`C`

Show Worked Solution

`V = 1/3 pir^2h`

`tan 60° = r/h\ =>\ r = sqrt3 h`

`V = 1/3 pi(sqrt3 h)^2h = pi h^3`

`(dV)/(dh)` `= 3pih^2`
`(dV)/(dt)` `= 3/2`
`(dh)/(dt)` `= (dh)/(dV) · (dV)/(dt)`
  `= 1/(3pih^2) · 3/2`
  `= 1/(2pih^2)`

 
`text(When)\ \ h = 0.5`

`(dh)/(dt) = 1/(2pi(0.5)^2) = 0.636…`

`=>C`

Filed Under: Related Rates of Change Tagged With: Band 5, smc-1185-10-Volume

Calculus, MET2 2019 VCAA 3

During a telephone call, a phone uses a dual-tone frequency electrical signal to communicate with the telephone exchange.

The strength, `f`, of a simple dual-tone frequency signal is given by the function  `f(t) = sin((pi t)/3) + sin ((pi t)/6)`, where  `t`  is a measure of time and  `t >= 0`.

Part of the graph of `y = f(t)`  is shown below

  1. State the period of the function.   (1 mark)

    --- 5 WORK AREA LINES (style=lined) ---

  2. Find the values of  `t`  where  `f(t) = 0`  for the interval  `t in [0, 6]`.   (1 mark)

    --- 5 WORK AREA LINES (style=lined) ---

  3. Find the maximum strength of the dual-tone frequency signal, correct to two decimal places.   (1 mark)

    --- 5 WORK AREA LINES (style=lined) ---

  4. Find the area between the graph of  `f`  and the horizontal axis for  `t in [0, 6]`.   (2 marks)

    --- 5 WORK AREA LINES (style=lined) ---

Let  `g`  be the function obtained by applying the transformation  `T`  to the function  `f`, where
 

`T([(x), (y)]) = [(a, 0), (0, b)] [(x), (y)] + [(c), (d)]`
 

and `a, b, c` and `d` are real numbers.

  1. Find the values of `a, b, c` and `d` given that  `int_2^0 g(t)\ dt + int_2^6 g(t)\ dt`  has the same area calculated in part d.   (2 marks)

    --- 5 WORK AREA LINES (style=lined) ---

  2. The rectangle bounded by the line  `y = k, \ k in R^+`, the horizontal axis, and the lines  `x = 0`  and  `x = 12`  has the same area as the area between the graph of  `f`  and the horizontal axis for one period of the dual-tone frequency signal.


    Find the value of  `k`.   (2 marks)

    --- 5 WORK AREA LINES (style=lined) ---

Show Answers Only
  1. `12`
  2. `0, 4, 6`
  3. `1.760`
  4. `15/pi\ text(u²)`
  5. `a = 1,\ b =-1,\ c =-6,\ d = 0`
  6. `5/(2pi)`
Show Worked Solution

a.   `text(Period) = 12`
  

b.   `t = 0, 4, 6`
  

c.   `f(t) = sin ((pi t)/3) + sin ((pi t)/6)`

`f(t)_max ~~ 1.76\ \ text{(by CAS)}`


d.    `text(Area)` `= int_0^4 sin((pi t)/3) + sin ((pi t)/6) dt-int_4^6 sin ((pi t)/3) + sin ((pi t)/6) dt`
    `= 15/pi\ text(u²)`


e.   `text(Same area) => f(t)\ text(is reflected in the)\ x text(-axis and)`

`text(translated 6 units to the left.)`

`x′=ax+c`

`y′=by+d`

`text(Reflection in)\ xtext(-axis) \ => \ b=-1, \ d=0`

`text(Translate 6 units to the left) \ => \ a=1, \ c=-6`

`:. a = 1,\ b = -1,\ c = -6,\ d = 0`
  

f.    `text(Area of rectangle)` `= 2 xx text(Area between)\ f(t) and x text(-axis)\ \ t in [0, 6]`
  `12k` `= 2 xx 15/pi`
  `:. k` `=5/(2pi)`

Filed Under: Area Under Curves, Trig Graphing Tagged With: Band 3, Band 4, Band 5, Band 6, smc-2757-10-Sin, smc-2757-30-Find period, smc-2757-85-Max/min (non-calc), smc-723-60-Trig

Complex Numbers, SPEC2 2019 VCAA 4 MC

The expression  `i^(1!) + i^(2!) + i^(3!) + …+ i^(100!)`  is equal to

  1. `0`
  2. `96`
  3. `95 + i`
  4. `94 + 2i`
  5. `98 + 2i`
Show Answers Only

`C`

Show Worked Solution

`i^(1!) =i^1 =  i`

`i^(2!) =i^2= −1`

`i^(3!) = i^6=-1`

`i^(4!) = i^24 = 1`

`i^(5!) = i^(24 xx 5)= 1^5 = 1`

`=> i^(n!) = 1\ \ text(for)\ \ n >= 4`

`:.\ text(Sum)` `= i – 1 – 1 + 97`
  `= 95 + i`

 
`=>C`

Filed Under: Basic Calculations (SM) Tagged With: Band 5, smc-1171-30-Other

Trigonometry, 2ADV T2 SM-Bank 44 MC

The domain of the function with rule  `f(x) = 1 - sec(x + pi/4)`  is

  1. `text(all real)\ x`
  2. `{((4k - 1)pi)/4}, (text{for}\ k\ text{integer}) `
  3. `{((4k + 1)pi)/4}, (text{for}\ k\ text{integer}) `
  4. `{((2k - 1)pi)/4}, (text{for}\ k\ text{integer}) `
Show Answers Only

`C`

Show Worked Solution

`y = sec (x)=1/cos(x)\ \ text(has asymptotes when)`

`x = −pi/2, pi/2, (3pi)/2, …`

`=> y = sec (x + pi/4)\ \ text(has asymptotes at when)`

`x = (−3pi)/4, pi/4, (5pi)/4, …`
 

`:.\ text(Domain:)\ {((4k + 1)pi)/4}, (text{for}\ k\ text{integer}) `

`=>C`

Filed Under: Trig Identities and Harder Equations (Adv-2027), Trig Identities and Harder Equations (Y11) Tagged With: Band 5, smc-1189-10-Solve Equation, smc-6412-10-Solve Equation

Calculus, SPEC1 2019 VCAA 10

Find  `(dy)/(dx)`  at the point  `((sqrtpi)/sqrt6,(sqrtpi)/sqrt3)` for the curve defined by the relation  `sin(x^2) + cos(y^2) = (3sqrt2)/pi\ xy`.

Give your answer in the form  `(pi - asqrtb)/(sqrta(pi + sqrtb))`, where  `a`, `b ∈ ZZ^+`.  (5 marks)

Show Answers Only

`(pi – 2sqrt3)/(sqrt2(pi + sqrt3))`

Show Worked Solution

`2x · cos(x^2) – 2y · sin(y^2) · (dy)/(dx) = (3sqrt2)/pi(y + x · (dy)/(dx))`

`text(Substitute)\ (sqrtpi/sqrt6, sqrtpi/sqrt3)\ text(into equation:)`

`(2sqrtpi)/sqrt6 cos(pi/6) – (2sqrtpi)/sqrt3 sin(pi/3) · (dy)/(dx)` `= (3sqrt2)/pi (sqrtpi/sqrt3 + sqrtpi/sqrt6 · (dy)/(dx))`
`(2sqrtpi)/sqrt6 · sqrt3/2 – (2sqrtpi)/sqrt3 · sqrt3/2 · (dy)/(dx)` `= sqrt18/pi (sqrtpi/sqrt3 + sqrtpi/sqrt6 · (dy)/(dx))`
`sqrtpi/sqrt2 – sqrtpi · (dy)/(dx)` `= sqrt6/sqrtpi + sqrt3/sqrtpi · (dy)/(dx)`
`(dy)/(dx)(sqrt3/sqrtpi + sqrtpi)` `= sqrtpi/sqrt2 – sqrt6/sqrtpi`
`(dy)/(dx)((sqrt3 + pi)/sqrtpi)` `= (pi – sqrt12)/(sqrt2 sqrtpi)`
`(dy)/(dx)` `= (pi – sqrt12)/(sqrt2 sqrtpi) xx sqrtpi/(sqrt3 + pi)`
  `= (pi – 2sqrt3)/(sqrt2(pi + sqrt3))`

Filed Under: Applied Contexts Tagged With: Band 5, smc-1184-70-Curve problems

Mechanics, SPEC1 2019 VCAA 9

  1. A light inextensible string is connected at each end to a horizontal ceiling. A mass of `m` kilograms hangs in equilibrium from a smooth ring on the string, as shown in the diagram below. The string makes an angle `alpha` with the ceiling.
      
    `qquad qquad`
     
    Express the tension, `T` newtons, in the string in terms of `m`, `g` and `alpha`.  (1 mark)
  2. A different light inextensible sting is connected at each end to a horizontal ceiling. A mass of `m` kilograms hangs from a smooth ring on the string. A horizontal force of `F` newtons is applied to the ring. The tension in the sting has a constant magnitude and the system is in equilibrium. At one end the string makes an angle `beta` with the ceiling and at the other end the string makes an angle `2beta` with the ceiling, as shown in the diagram below.


    Show that  `F = mg((1 - cos(beta))/(sin(beta)))`.  (3 marks)
Show Answers Only
  1. `T = (mg)/(2sinalpha)`
  2. `text(See Worked Solutions)`
Show Worked Solution
a.   
`2 xx Tsinalpha` `= mg`
`:.T` `= (mg)/(2sinalpha)`


b.   

 
`text(Resolving forces vertically:)`

`Tsin(beta) + Tsin(2beta)` `= mg`
`T` `= (mg)/(sin(beta) + sin(2beta))`

 
`text(Resolving forces horizontally:)`

`F + Tcos(2beta)` `= Tcos(beta)`
`F` `= Tcos(beta) – Tcos(2beta)`
  `= T(cos(beta) – cos(2beta))`
  `= T[cos(beta) – (2cos^2beta – 1)]`
  `= T(−2cos^2(beta) + cos(beta) + 1)`
  `= T(−2cos(beta) – 1)(cos(beta) – 1)`
  `= (mg(1 -cos(beta))(2cosbeta + 1))/(sin(beta) + 2sin(beta)cos(beta))`
  `= (mg(1 – cos(beta))(2cos(beta) + 1))/(sin(beta)(1+2cos(beta)))`
  `= mg((1 – cos(beta))/(sin(beta)))`

Filed Under: Pulleys, Planes and Equilibrium (SM) Tagged With: Band 4, Band 5, smc-1175-40-Equilibrium

Complex Numbers, SPEC1 2019 VCAA 7

  1. Show that  `3-sqrt3 i = 2sqrt3 text(cis)(-pi/6)`.   (1 mark)

    --- 3 WORK AREA LINES (style=lined) ---

  2. Find  `(3-sqrt3 i)^3`, expressing your answer in the form  `x + iy`, where  `x`,  `y ∈ R`.   (2 marks)

    --- 5 WORK AREA LINES (style=lined) ---

  3. Find the integer values of  `n`  for which  `(3-sqrt3 i)^n`  is real.   (1 mark)

    --- 3 WORK AREA LINES (style=lined) ---

  4. Find the integer values of  `n`  for which  `(3-sqrt3 i)^n = ai`, where  `a`  is a real number.   (1 mark)

    --- 3 WORK AREA LINES (style=lined) ---

Show Answers Only
  1. `text(See Worked Solutions)`
  2. `0-i 24sqrt3`
  3. `n = 6k\ \ (k ∈ ZZ)`
  4. `n = 3 + 6k\ \ (k ∈ ZZ)`
Show Worked Solution

a.  `|3-sqrt3 i|= sqrt(3^2 + (-sqrt3)^2)= sqrt12= 2sqrt3`

`text(Arg)(3-sqrt3 i)` `= tan^(-1)(-(sqrt3)/3)= -pi/6`
   

`:. 3-sqrt3 i = 2sqrt3\ text(cis)(-pi/6)`

b.    `(3-sqrt3 i)^3` `= (2sqrt3)^3\ text(cis)(3 xx-pi/6)`
    `= 24sqrt3\ text(cis)(-pi/2)`
    `= 24sqrt3(cos(-pi/2) + isin(-pi/2))`
    `= 0-i 24sqrt3`


c.   `(3-sqrt3 i)^n = (2sqrt3)^n\ text(cis)((-npi)/6)`

`text(Real when)\ \ sin(-(npi)/6) = -sin((npi)/6) = 0`

`(npi)/6 = 0, pi, 2pi, …, kpi\ \ (k ∈ ZZ)`

`:. n = 6k\ \ (k ∈ ZZ)`


d.  `(3-sqrt3 i)^n = ai\ \ text(when)\ \ cos(-(npi)/6) = cos((npi)/6) = 0`

`(npi)/6 = pi/2, (3pi)/2, …, pi/2 + kpi\ \ (k ∈ ZZ)`

`:. n = 3 + 6k\ \ (k ∈ ZZ)`

Filed Under: Mod/Arg Form and Argand Diagrams (SM) Tagged With: Band 3, Band 4, Band 5, smc-2597-20-Cartesian to Mod/Arg

Calculus, MET2 2019 VCAA 1

Let  `f: R -> R,\ \ f(x) = x^2e^(-x^2)`.

  1. Find `f^{\prime}(x)`.  (1 mark)

    --- 2 WORK AREA LINES (style=lined) ---

  2. i.  State the nature of the stationary point on the graph of  `f`  at the origin.  (1 mark)

    --- 2 WORK AREA LINES (style=lined) ---

  3. ii.  Find the maximum value of the function  `f`  and the values of  `x`  for which the maximum occurs.  (2 marks)

    --- 2 WORK AREA LINES (style=lined) ---

  4. iii. Find the values of  `d in R`  for which  `f(x) + d`  is always negative.  (1 mark)

    --- 2 WORK AREA LINES (style=lined) ---

  5. i.  Find the equation of the tangent to the graph of  `f`  at  `x = –1`.  (1 mark)

    --- 2 WORK AREA LINES (style=lined) ---

  6. ii. Find the area enclosed by the graph of  `f`  and the tangent to the graph of  `f`  at  `x = –1`, correct to four decimal places.  (2 marks)

    --- 2 WORK AREA LINES (style=lined) ---

  7. Let  `M(m, n)`  be a point on the graph of  `f`, where  `m in [0, 1]`.
  8. Find the minimum distance between  `M`  and the point  `(0, e)`, and the value of  `m`  for which this occurs, correct to three decimal places.  (3 marks)

    --- 6 WORK AREA LINES (style=lined) ---

Show Answers Only

  1. `2x e^(-x^2)(1-x^2)`
  2. i.  `text(Local minimum)`
  3. ii. `f(x)_max= 1/e\ \ text(when) \ x = -1 and 1`
  4. iii. `d<1/e`
  5. i.  `y = 1/e` 
  6. ii. `0.3568\ text{(to 4 d.p.)}`
  7. `D_(min) = 2.511\ \ text(when)\ \ m ~~ 0.783`

Show Worked Solution

a.    `f^{\prime}(x)` `= x^2 ⋅ -2x ⋅ e^(-x^2) + e^(-x^2) ⋅ 2x`
    `= 2x e^(-x^2) (1-x^2)`

​

b.i.    `f ^{″}(0) = 2 > 0\ \ \ text{(by CAS)}`
  `:.\ text(Local minimum)`


b.ii.    `text(SP’s occur when)\ \ x = –1, 0, 1`
  `f(x)_max = 1/e\ \ text(when)\ \ x = –1  and  1`


b.iii.    `f(x)_max + d` `< 0`
  `d` `< 1/e`


c.i.    `text(At)\ \ x = –1, \ f(x)\ text(has a max turning point).`
  `:.\ text(T)text(angent:)\ \ y = 1/e`


c.ii.    `text(Area)` `= int_(_1)^1 1/e-x^2e^(-x^2) dx`
    `~~ 0.3568\ text{(to 4 d.p.)}`


d.   `text(When)\ x = m,\ \ n = m^2 e^(-m^2)`

`text(Find distance between)\ \ M(m, m^2 e^(-m^2)) and P(0, e):`

`D = sqrt((m-0)^2 + (m^2 e^(-m^2)-e)^2)`

`=>\ text(MIN distance when)\ \ (dD)/(dm) = 0`

`D_(min) = 2.511\ \ text(when)\ \ m ~~ 0.783\ \ \ text{(by CAS)}`

Filed Under: Arc Lengths, Areas and Other, Tangents and Curve Sketching Tagged With: Band 3, Band 4, Band 5, smc-1181-20-Area Under Curves

Probability, 2ADV S1 SM-Bank 6 MC

A box contains  `n`  marbles that are identical in every way except colour, of which  `k`  marbles are coloured red and the remainder of the marbles are coloured green. Two marbles are drawn randomly from the box.

If the first marble is not replaced into the box before the second marble is drawn, then the probability that the two marbles drawn are the same colour is

  1. `(k^2 + (n - k)^2)/n^2`
  2. `(k^2 + (n - k - 1)^2)/n^2`
  3. `(2k(n - k - 1))/(n(n - 1))`
  4. `(k(k - 1) + (n - k)(n - k - 1))/(n(n - 1))`
Show Answers Only

`D`

Show Worked Solution

`n\ text(marbles) \ => \ k\ text(red), \ (n – k)\ \ text(green)`
 

`:.\ P(text{same colour})` `= k/n ⋅ ((k – 1))/((n – 1)) + ((n – k))/n ⋅ ((n – k – 1))/((n – 1))`
  `= (k(k – 1) + (n – k)(n – k – 1))/(n(n – 1))`

 
`=>   D`

Filed Under: Multi-Stage Events (Adv-2027), Multi-Stage Events (Y11) Tagged With: Band 5, smc-6469-10-Probability Trees, smc-989-10-Probability Trees

  • « Previous Page
  • 1
  • …
  • 50
  • 51
  • 52
  • 53
  • 54
  • …
  • 81
  • Next Page »

Copyright © 2014–2025 SmarterEd.com.au · Log in