SmarterEd

Aussie Maths & Science Teachers: Save your time with SmarterEd

  • Login
  • Get Help
  • About

Statistics, STD2 S1 2021 HSC 7 MC

The number of downloads of a song on each of twenty consecutive days is shown in the following graph.
 

Which of the following graphs best shows the cumulative number of downloads up to and including each day?

Show Answers Only

`C`

Show Worked Solution

`text{The gradient of the cumulative frequency histogram}`

♦ Mean mark 50%.

`text{will increase gradually, be steepest at day 10 then}`

`text{decrease gradually.}`

`=> C`

Filed Under: Bar Charts and Histograms (Std 2), Bar Charts and Histograms (Std2-2027) Tagged With: 2adv-std2-common, Band 5, common-content, smc-6310-30-Cumulative Frequency Histograms, smc-821-20-Cumulative Frequency Histograms

Statistics, STD2 S1 2021 HSC 3 MC

The stem-and-leaf plot shows the number of goals scored by a team in each of ten netball games.
  

What is the mode of this dataset?

  1.  5
  2.  18
  3.  25
  4.  29
Show Answers Only

`C`

Show Worked Solution

`\text{Mode}  -> \text{data point with highest frequency}`

`\text{Mode}  = 25`

`=> C`

Filed Under: Bar Charts, Histograms and Other Graphs (Std 1), Data Analysis, Other Charts (Std 2), Other Charts (Std2-2027) Tagged With: Band 3, common-content, num-title-ct-core, num-title-qs-hsc, smc-1128-24-Stem and Leaf, smc-4224-15-Mode, smc-4224-40-Stem and Leaf, smc-6311-10-Stem-and-Leaf, smc-822-20-Stem and Leaf

Algebra, STD2 A1 2021 HSC 29

Solve  `x+(x-1)/2 = 9`  (2 marks)

Show Answers Only

`19/3`

Show Worked Solution

♦ Mean mark 40%.
`x+(x-1)/2` `=9`  
`2x + x-1` `=18`  
`3x` `=19`  
`x` `=19/3`  

Filed Under: Substitution and Other Equations (Std 2), Substitution and Other Equations (Std2-2027) Tagged With: 2adv-std2-common, Band 5, common-content, smc-6234-30-Algebraic Fractions, smc-789-30-Algebraic Fractions

Statistics, STD2 S5 2021 HSC 8 MC

On a test, Zac's mark corresponded to a `z`-score of 2. The test scores had a mean of 63 and a standard deviation of 8.

What was Zac's actual mark on the test?

  1. 65
  2. 67
  3. 73
  4. 79
Show Answers Only

`D`

Show Worked Solution

`text{Method 1 (quicker)}`

`text(Actual mark)` `= mu + 2 xx sigma`
  `= 63 + 2 xx 8`
  `= 79`


`text(Method 2)`

`ztext(-score)` `= (x – mu)/sigma`
`2` `= (x-63)/8`
`16` `=x-63`
`x` `=79`

 
`=>D`

Filed Under: Normal Distribution (Y12), S5 The Normal Distribution (Y12) Tagged With: Band 4, common-content, smc-819-10-Single z-score, smc-995-10-Single z-score

Financial Maths, STD2 F2 2021 HSC 5 MC

Peter currently earns $21.50 per hour. His hourly wage will increase by 2.1% compounded each year for the next four years.

What will his hourly wage be after four years?

  1. `21.50(1.21)^4`
  2. `21.50(1.021)^4`
  3. `21.50 + 21.50 xx 0.21 xx 4`
  4. `21.50 + 21.50 xx 0.021 xx 4`
Show Answers Only

`B`

Show Worked Solution

`text(Wage after 1 year) = 21.50 xx 1.021`

`text(Wage after 2 years) = 21.50 xx 1.021 xx 1.021 = 21.50(1.021)^2`

`vdots`

`text(Wage after 4 years) = 21.50(1.021)^4`

`=>  B`

Filed Under: Compound Interest and Shares (Std2), F2 Investment (Y12), Modelling Investments and Loans (Y12) Tagged With: Band 4, common-content, smc-1002-20-FV Formula, smc-1108-20-FV Formula, smc-817-20-FV Formula

Financial Maths, STD2 F5 2020 HSC 37

Wilma deposited a lump sum into a new bank account which earns 2% per annum compound interest.

Present value interest factors for an annuity of $1 for various interest rates (`r`) and numbers of periods (`N`) are given in the table.


Wilma was able to make the following withdrawals from this account.

  • $1000 at the end of each year for twenty years (starting one year after the account is opened)
  • $3000 each year for ten years starting 21 years after the account is opened.

Calculate the minimum lump sum Wilma must have deposited when she opened the new account.   (3 marks)

--- 6 WORK AREA LINES (style=lined) ---

Show Answers Only

`$ 34 \ 486`

Show Worked Solution

`text{Annuity 1:}\ PV\ text{of $1000 annuity for 20 years at} \ \ r = 0.02`

♦♦♦ Mean mark 23%.

`PV\ text{factor} = 16.351`

`therefore \ PV\ text{Annuity 1}` `= 16.351 xx 1000`
  `= $16 \ 351`

 
`text{Annuity 2:}\ PV\ text{of $3000 annuity for years 21-30 at} \ \ r = 0.02`

`PV\ text{Annuity 2}` `= PVtext{(30 years)} – PVtext{(20 years)}`
  `= 3000 xx 22.396 – 3000 xx 16.351`
  `= $ 18 \ 135`


`:.\ text{Lump sum required}` `= 16 \ 351 + 18\ 135`
  `= $ 34 \ 486`

Filed Under: F5 Annuities (Y12) Tagged With: Band 6, common-content, smc-816-20-PV of $1 Annuity Table

Statistics, STD2 S5 2020 HSC 35

The intelligence Quotient (IQ) scores for adults in City A are normally distributed with a mean of 108 and a standard deviation of 10.

The IQ score for adults in City B are normally distributed with a mean of 112 and a standard deviation of 16.

  1. Yin is an adult who lives in City A and has an IQ score of 128.
    What percentage of the adults in this city have an IQ score higher than Yin's?   (2 marks) 

    --- 4 WORK AREA LINES (style=lined) ---

  2. There are 1 000 000 adults living in City B.
    Calculate the number of adults in City B that would be expected to have an IQ score lower than Yin's.  (2 marks)

    --- 4 WORK AREA LINES (style=lined) ---

  3. Simon, an adult who lives in City A, moves to City B. The  `z` -score corresponding to his IQ score in City A is the same as the `z`-score corresponding to his IQ score in City B.
    By first forming an equation, calculate Simon's IQ score. Give your answer correct to one decimal place.   (3 marks)

    --- 6 WORK AREA LINES (style=lined) ---

Show Answers Only
  1. `text(2.5%)`
  2. `840 \ 000`
  3. `101.3`
Show Worked Solution

a.    `text{In City A:}`

♦ Mean mark 50%.

`z text{-score}\ (128) = frac {x -mu}{sigma} = frac{128 – 108}{10} = 2`


`therefore\ text{2.5% have a higher IQ in City} \ A.`
 

b.    `text{In City B:}`

♦ Mean mark 44%.

`z text{-score}\ (128) = frac{128 – 112}{16} = 1`


`therefore \ text{Adults in City} \ B \ text{with an IQ}\ <  128`

`= 84text(%) xx 1 \ 000 \ 000`

`= 840 \ 000`
 

c.    `z text{-score in City A}\ = z text{-score in City B}`

♦♦♦ Mean mark 17%.
`frac{x – 108}{10} ` `= frac{x -112}{16} \ \ text{(multiply b.s.} \ xx 160 text{)}`
`16 (x – 108)` `= 10 (x – 112)`
`16 x – 1728` `= 10 x – 1120`
`6x` `= 608`
`x` `= 101.3`

  
`therefore \ text{Simon’s IQ} = 101.3 \ text{(to 1 d.p.)}`

Filed Under: S5 The Normal Distribution (Y12) Tagged With: Band 5, Band 6, common-content, smc-819-10-Single z-score, smc-819-30-Comparisons of Data Sets

Statistics, STD2 S4 2020 HSC 36

A cricket is an insect. The male cricket produces a chirping sound.

A scientist wants to explore the relationship between the temperature in degrees Celsius and the number of cricket chirps heard in a 15-second time interval.

Once a day for 20 days, the scientist collects data. Based on the 20 data points, the scientist provides the information below.

  • A box-plot of the temperature data is shown.
     
       
  • The mean temperature in the dataset is 0.525°C below the median temperature in the dataset.
  • A total of 684 chirps was counted when collecting the 20 data points.

The scientist fits a least-squares regression line using the data `(x, y)`, where `x` is the temperature in degrees Celsius and `y` is the number of chirps heard in a 15-second time interval. The equation of this line is

`y = −10.6063 + bx`,

where `b` is the slope of the regression line.

The least-squares regression line passes through the point  `(barx, bary)`, where  `barx`  is the sample mean of the temperature data and  `bary`  is the sample mean of the chirp data.

Calculate the number of chirps expected in a 15-second interval when the temperature is 19° Celsius. Give your answer correct to the nearest whole number.  (5 marks)

Show Answers Only

`29\ text(chirps)`

Show Worked Solution

`y = −10.6063 + bx`

♦♦♦ Mean mark 18%.

`text(Find)\ b:`

`text(Line passes through)\ \ (barx, bary)`

`barx` `= 22 – 0.525`
  `= 21.475`
`bary` `= text(total chirps)/text(number of data points)`
  `= 684/20`
  `= 34.2`


`34.2` `= −10.6063 + b(21.475)`
`:.b` `= 44.8063/21.475`
  `~~ 2.0864`

 
`text(If)\ \ x = 19,`

`y` `= −10.6063 + 2.0864 xx 19`
  `= 29.03`
  `= 29\ text(chirps)`

Filed Under: S4 Bivariate Data Analysis (Y12) Tagged With: 2adv-std2-common, Band 6, common-content, smc-785-20-Least-Squares Regression Line

Statistics, STD2 S2 2020 HSC 28

Consider the following dataset.

`1        5        9         10        15`

Suppose a new value, `x`, is added to this dataset, giving the following.

      `1        5        9         10        15        x`

It is known that  `x`  is greater than 15. It is also known that the difference between the means of the two datasets is equal to ten times the difference between the medians of the two datasets.

Calculate the value of `x`.    (4 marks)

--- 8 WORK AREA LINES (style=lined) ---

Show Answers Only

`38`

Show Worked Solution

`text{Dataset 1 : Median} = 9`

Mean mark 53%.

`text{Dataset 2 : Median} = frac{9 + 10}{2} = 9.5`

`:.\ text{Difference between means}`

`= 10 xx (9.5 – 9)`

`= 5`
 

`overset_ x_1 = frac{1 + 5 + 9 + 10 + 15}{5} = 8`
  
`therefore overset_ x_2 = 8 + 5 = 13`
 

`text{Sum of all data points in Dataset 2}`

`= 6 xx 13`

`= 78`
 

`78` `= 1 + 5 + 9 + 10 + 15 + x`
`therefore \ x` `= 78 – 40`
  `= 38`

Filed Under: Measures of Centre and Spread (Std2-2027), Summary Statistics - No Graph (Std 2) Tagged With: Band 5, common-content, smc-6312-10-Mean, smc-6312-20-Median and Mode, smc-824-10-Mean, smc-824-20-Median and Mode

Functions, 2ADV F1 2020 HSC 11

There are two tanks on a property, Tank `A` and Tank `B`. Initially, Tank `A` holds 1000 litres of water and Tank B is empty.

  1.  Tank `A` begins to lose water at a constant rate of 20 litres per minute. The volume of water in Tank `A` is modelled by  `V = 1000 - 20t`  where  `V`  is the volume in litres and  `t`  is the time in minutes from when the tank begins to lose water.   (1 mark)
     
    On the grid below, draw the graph of this model and label it as Tank `A`.


  2. Tank `B` remains empty until  `t=15`  when water is added to it at a constant rate of 30 litres per minute.


    By drawing a line on the grid (above), or otherwise, find the value of  `t`  when the two tanks contain the same volume of water.  (2 marks)

  3. Using the graphs drawn, or otherwise, find the value of  `t`  (where  `t > 0`) when the total volume of water in the two tanks is 1000 litres.  (1 mark)

    --- 2 WORK AREA LINES (style=lined) ---

Show Answers Only
  1.  `text{T} text{ank} \ A \ text{will pass trough (0, 1000) and (50, 0)}` 
      
  2. `29 \ text{minutes}`
  3. `45 \ text{minutes}`
Show Worked Solution

a.     `text{T} text{ank} \ A \ text{will pass trough (0, 1000) and (50, 0)}` 


b.   `text{T} text{ank} \ B \ text{will pass through (15, 0) and (45, 900)}`  


`text{By inspection, the two graphs intersect at} \ \ t = 29 \ text{minutes}`

 
c.   `text{Strategy 1}`

`text{By inspection of the graph, consider} \ \ t = 45`

`text{T} text{ank A} = 100 \ text{L} , \ text{T} text{ank B} =900 \ text{L} `

`:.\ text(Total volume = 1000 L when  t = 45)`
  

`text{Strategy 2}`

`text{Total Volume}` `=text{T} text{ank A} + text{T} text{ank B}`
`1000` `= 1000 – 20t + (t – 15) xx 30`
`1000` `= 1000 – 20t + 30t – 450 `
`10t` `= 450`
`t` `= 45 \ text{minutes}`

Filed Under: Linear Functions (Adv-2027), Linear Functions (Y11) Tagged With: 2adv-std2-common, Band 2, Band 3, Band 4, common-content, smc-6214-50-Simultaneous Equations, smc-985-40-Simultaneous Equations

Algebra, STD2 A4 2020 HSC 24

There are two tanks on a property, Tank A and Tank B. Initially, Tank A holds 1000 litres of water and Tank B is empty.

  1. Tank A begins to lose water at a constant rate of 20 litres per minute.


    The volume of water in Tank A is modelled by  `V = 1000 - 20t`  where `V` is the volume in litres and  `t`  is the time in minutes from when the tank begins to lose water.


    On the grid below, draw the graph of this model and label it as Tank A.   (1 mark)


  2. Tank B remains empty until  `t=15`  when water is added to it at a constant rate of 30 litres per minute.
    By drawing a line on the grid (above), or otherwise, find the value of  `t`  when the two tanks contain the same volume of water.  (2 marks)

    --- 2 WORK AREA LINES (style=lined) ---

  3. Using the graphs drawn, or otherwise, find the value of  `t`  (where  `t > 0`) when the total volume of water in the two tanks is 1000 litres.  (1 mark)

    --- 1 WORK AREA LINES (style=lined) ---

Show Answers Only
  1.  `text{T} text{ank} \ A \ text{will pass trough (0, 1000) and (50, 0)}` 
      
  2. `29 \ text{minutes}`
  3. `45 \ text{minutes}`
Show Worked Solution

a.     `text{T} text{ank} \ A \ text{will pass trough (0, 1000) and (50, 0)}` 


b.   `text{T} text{ank} \ B \ text{will pass through (15, 0) and (45, 900)}`  


`text{By inspection, the two graphs intersect at} \ \ t = 29 \ text{minutes}`

 
c.   `text{Strategy 1}`

♦♦ Mean mark part (c) 22%.

`text{By inspection of the graph, consider} \ \ t = 45`

`text{T} text{ank A} = 100 \ text{L} , \ text{T} text{ank B} =900 \ text{L} `

`:.\ text(Total volume = 1000 L when  t = 45)`
  

`text{Strategy 2}`

`text{Total Volume}` `=text{T} text{ank A} + text{T} text{ank B}`
`1000` `= 1000 – 20t + (t – 15) xx 30`
`1000` `= 1000 – 20t + 30t – 450 `
`10t` `= 450`
`t` `= 45 \ text{minutes}`

Filed Under: Simultaneous Equations and Applications (Std 2) Tagged With: 2adv-std2-common, Band 3, Band 4, Band 5, common-content, smc-794-15-Other SE Applications, smc-794-20-Find Intersection, smc-794-30-Sketch Linear Equations

Statistics, 2ADV S2 2020 HSC 27

A cricket is an insect. The male cricket produces a chirping sound.

A scientist wants to explore the relationship between the temperature in degrees Celsius and the number of cricket chirps heard in a 15-second time interval.

Once a day for 20 days, the scientist collects data. Based on the 20 data points, the scientist provides the information below.

  • A box-plot of the temperature data is shown.
     
       
  • The mean temperature in the dataset is 0.525°C below the median temperature in the dataset.
  • A total of 684 chirps was counted when collecting the 20 data points.

The scientist fits a least-squares regression line using the data `(x, y)`, where `x` is the temperature in degrees Celsius and `y` is the number of chirps heard in a 15-second time interval. The equation of this line is

`y = −10.6063 + bx`,

where `b` is the slope of the regression,

The least-squares regression line passes through the point  `(barx, bary)`, where  `barx`  is the sample mean of the temperature data and  `bary`  is the sample mean of the chirp data.

Calculate the number of chirps expected in a 15-second interval when the temperature is 19° Celsius. Give your answer correct to the nearest whole number.  (5 marks)

Show Answers Only

`29\ text(chirps)`

Show Worked Solution

`y = −10.6063 + bx`

♦ Mean mark 46%.

`text(Find)\ b:`

`text(Line passes through)\ \ (barx, bary)`

`barx` `= 22 – 0.525`
  `= 21.475`


`bary` `= text(total chirps)/text(number of data points)`
  `= 684/20`
  `= 34.2`


`34.2` `= −10.6063 + b(21.475)`
`:.b` `= 44.8063/21.475`
  `~~ 2.0864`


`text(If)\ \ x = 19,`

`y` `= −10.6063 + 2.0864 xx 19`
  `= 29.03`
  `= 29\ text(chirps)`

Filed Under: Bivariate Data Analysis (Y12) Tagged With: 2adv-std2-common, Band 5, common-content, smc-1001-20-Least-Squares Regression Line

Financial Maths, STD2 F5 2020 HSC 34

Tina inherits $60 000 and invests it in an account earning interest at a rate of 0.5% per month. Each month, immediately after the interest has been paid, Tina withdraws $800.

The amount in the account immediately after the `n`th withdrawal can be determined using the recurrence relation

`A_n = A_(n - 1)(1.005) - 800`,

where `n = 1, 2, 3, …`  and  `A_0 = 60\ 000`

  1. Use the recurrence relation to find the amount of money in the account immediately after the third withdrawal.  (2 marks)

    --- 4 WORK AREA LINES (style=lined) ---

  2. Calculate the amount of interest earned in the first three months.  (2 marks)

    --- 4 WORK AREA LINES (style=lined) ---

Show Answers Only
  1. `$58\ 492.49`
  2. `$892.49`
Show Worked Solution

♦ Mean mark part (a) 41%.
a.    `A_1` `= 60\ 000(1.005) – 800 = $59\ 500`
  `A_2` `= 59\ 500(1.005) – 800 = $58\ 997.50`
  `A_3` `= 58\ 997.50(1.005) – 800 = $58\ 492.49`


b.   `text{Amount (not interest)}`

♦♦ Mean mark part (b) 33%.

`= 60\ 000 – (3 xx 800)`

`= $57\ 600`
 

`:.\ text(Interest earned in 3 months)`

`= A_3 – 57\ 600`

`= 58\ 492.49 – 57\ 600`

`= $892.49`

Filed Under: F5 Annuities (Y12) Tagged With: 2adv-std2-common, Band 4, Band 5, common-content, smc-816-50-Recurrence Relation

Trigonometry, 2ADV T1 2020 HSC 15

Mr Ali, Ms Brown and a group of students were camping at the site located at `P`. Mr Ali walked with some of the students on a bearing of 035° for 7 km to location `A`. Ms Brown, with the rest of the students, walked on a bearing of 100° for 9 km to location `B`.


  1. Show that the angle `APB` is 65°.  (1 mark)

    --- 1 WORK AREA LINES (style=lined) ---

  2. Find the distance `AB`.  (2 marks)

    --- 5 WORK AREA LINES (style=lined) ---

  3. Find the bearing of Ms Brown's group from Mr Ali's group. Give your answer correct to the nearest degree.  (2 marks)

    --- 5 WORK AREA LINES (style=lined) ---

Show Answers Only
  1. `text(See Worked Solutions)`
  2. `8.76\ text{km  (to 2 d.p.)}`
  3. `146^@`
Show Worked Solution
a.    `angle APB` `= 100-35`
    `= 65^@`


b.   `text(Using cosine rule:)`

`AB^2` `= AP^2 + PB^2-2 xx AP xx PB cos 65^@`
  `= 49 + 81-2 xx 7 xx 9 cos 65^@`
  `= 76.750…`
`:.AB` `= 8.760…`
  `= 8.76\ text{km  (to 2 d.p.)}`

 
c.

`anglePAC = 35^@\ (text(alternate))`

`text(Using cosine rule, find)\ anglePAB:`

`cos anglePAB` `= (7^2 + 8.76-9^2)/(2 xx 7 xx 8.76)`  
  `= 0.3647…`  
`:. angle PAB` `= 68.61…^@`  
  `= 69^@\ \ (text(nearest degree))`  


`:. text(Bearing of)\ B\ text(from)\ A\ (theta)` 

`= 180-(69-35)`

`= 146^@`

Filed Under: Bearings (Adv-2027), Bearings (Y11) Tagged With: 2adv-std2-common, Band 2, Band 3, Band 4, common-content, smc-6395-10-Bearings, smc-981-10-Bearings

Financial Maths, STD2 F5 2020 HSC 14 MC

An annuity consists of ten payments, each equal to $1000. Each payment is made on 30 June each year from 2021 through to 2030 inclusive.

The rate of compound interest is 5% per annum.

The present value of the annuity is calculated at 30 June 2020.

The future value of the annuity is calculated at 30 June 2030.

Without performing any calculations, which of the following statements is true?

  1. Present value of the annuity  <  $10 000  <  future value of the annuity
  2. $10 000  <  present value of the annuity  <  future value of the annuity
  3. Future value of the annuity  <  $10 000  <  present value of the annuity
  4. $10 000  <  future value of the annuity  <  present value of the annuity
Show Answers Only

`A`

Show Worked Solution

Mean mark 53%.

`PV\ text{(30 June 2020)}  < $10\ 000\ \ text{(each payment discounted to 30-Jun-20 value)}`

`FV\ text{(30 June 2030)}  => text{annuity has received}\ \  10 xx $1000`

`text{payments plus interest}`

`therefore \ FV\ text{(30 June 2030)} \ > \ $10\ 000 `
 

`=> \ A`

Filed Under: F5 Annuities (Y12) Tagged With: Band 5, common-content, smc-816-40-No Table

Statistics, 2ADV S3 2020 HSC 9 MC

Suppose the weight of melons is normally distributed with a mean of `mu` and a standard deviation of `sigma`.

A melon has a weight below the lower quartile of the distribution but NOT in the bottom 10% of the distribution.

Which of the following most accurately represents the region in which the weight of this melon lies?
 

A. B.
C. D.
Show Answers Only

`C`

Show Worked Solution

`text(Distributions using)\ mu and sigma:`


`text(Adjusting the above to identify the interval  10% < weight < 25%)`

  
`=>C`

Filed Under: Normal Distribution (Y12) Tagged With: Band 4, common-content, smc-995-20-z-score Intervals, smc-995-40-Graphs

Statistics, STD2 S4 2020 HSC 12 MC

For a set of bivariate data, Pearson's correlation coefficient is  –1.

Which graph could best represent this set of bivariate data?


Show Answers Only

`D`

Show Worked Solution

`text(Negative correlation coefficient:)`

`text(Line of Best Fit will go from top left to bottom right)`

`text(Correlation coefficient of magnitude 1:)`

`text(Data will be in a straight line.)`

`=> \ D`

Filed Under: S4 Bivariate Data Analysis (Y12) Tagged With: Band 4, common-content, smc-785-40-Pearson's

Statistics, 2ADV S3 2020 HSC 3 MC

John recently did a class test in each of three subjects. The class scores on each test were normally distributed.

The table shows the subjects and John's scores as well as the mean and standard deviation of the class scores on each test.


Relative to the rest of class, which row of the table below shows John's strongest subject and his weakest subject?
 

Show Answers Only

`A`

Show Worked Solution

`text(Calculate the)\ ztext(-score of each subject:)`

`ztext{-score (French)} = frac(82 – 70)(8) = 1.5`

`ztext{-score (Commerce)} = frac(80 – 65)(5) = 3.0`

`ztext{-score (Music)} = frac(74 – 50)(12) = 2.0`

 
`therefore \ text{Commerce is strongest, French is weakest}`

`=> \ A`

Filed Under: Normal Distribution (Y12) Tagged With: 2adv-std2-common, Band 4, common-content, smc-995-30-Comparisons of Data Sets

Statistics, STD2 S5 2020 HSC 8 MC

John recently did a class test in each of three subjects. The class scores on each test were normally distributed.

The table shows the subjects and John's scores as well as the mean and standard deviation of the class scores on each test.

Relative to the rest of class, which row of the table below shows John's strongest subject and his weakest subject?

Show Answers Only

`A`

Show Worked Solution

`text(Calculate the)\ ztext(-score of each subject:)`

`ztext{-score (French)} = frac(82-70)(8) = 1.5`

`ztext{-score (Commerce)} = frac(80-65)(5) = 3.0`

`ztext{-score (Music)} = frac(74-50)(12) = 2.0`

 
`therefore \ text{Commerce is strongest, French is weakest}`

`=> \ A`

Filed Under: S5 The Normal Distribution (Y12) Tagged With: 2adv-std2-common, Band 4, common-content, smc-819-30-Comparisons of Data Sets

Statistics, STD2 S1 2020 HSC 7 MC

Which histogram best represents a dataset that is positively skewed?


Show Answers Only

`A`

Show Worked Solution

♦♦ Mean mark 32%.

`text(Positive skew occurs when the tail on the)`

`text{histogram is longer on the right-hand}`

`text{(positive) side.}`

`=> \ A`

Filed Under: Bar Charts and Histograms (Std 2), Bar Charts and Histograms (Std2-2027), Bar Charts and Histograms (Y12), Bar Charts, Histograms and Other Graphs (Std 1), Data Analysis Tagged With: Band 5, common-content, num-title-ct-core, num-title-qs-hsc, smc-1128-15-Histograms, smc-4224-35-Describing datasets, smc-6310-20-Histograms, smc-821-15-Histograms, smc-997-15-Histograms

Statistics, STD2 S4 EQ-Bank 4

Ten high school students have their height and the length of their right foot measured.

The results are recorded in the table below.


  1. Using technology, calculate Pearson's correlation coefficient for the data. Give your answer to 3 decimal places.  (1 mark)

    --- 1 WORK AREA LINES (style=lined) ---

  2. Describe the strength of the association between height and length of right foot for these students.  (1 mark)

    --- 2 WORK AREA LINES (style=lined) ---

  3. Using technology, determine the least squares regression line that allows height to be predicted from right foot length.  (1 mark)

    --- 1 WORK AREA LINES (style=lined) ---

Show Answers Only
  1. `0.941\ \ (text(to 3 d.p.))`
  2. `text(The association is positive and strong.)`
  3. `text(Height) =47.4 + 4.7 xx text(foot length)`
Show Worked Solution

i.   `text(By calculator,)`

COMMENT: Issues here? YouTube has short and excellent help videos – search your calculator model and topic – eg. “fx-82 correlation” .

`r` `= 0.94095…`
  `= 0.941\ \ (text(to 3 d.p.))`


ii.   `text(The association is positive and strong.)`


iii.   `x\ text(value ⇒ foot length (independent variables))`

`y\ text(value ⇒ height.)`

`text(By calculator:)`

`text(Height) = 47.4 + 4.7 xx text(foot length)`

Filed Under: Bivariate Data Analysis (Y12), S4 Bivariate Data Analysis (Y12) Tagged With: Band 4, common-content, smc-1001-20-Least-Squares Regression Line, smc-1001-30-Correlation, smc-1001-40-Pearson's, smc-1001-70-Calculator (Stats Mode), smc-785-20-Least-Squares Regression Line, smc-785-30-Correlation, smc-785-40-Pearson's, smc-785-70-Calculator (Stats Mode)

Statistics, 2ADV S2 EQ-Bank 3

The table below lists the average life span (in years) and average sleeping time (in hours/day) of 9 animal species.


  1. Using sleeping time as the independent variable, calculate the least squares regression line. (1 mark)

    --- 1 WORK AREA LINES (style=lined) ---

  2. A wallaby species sleeps for 4.5 hours, on average, each day.


    Use your equation from part i to predict its expected life span, to the nearest year.   (1 mark)

    --- 1 WORK AREA LINES (style=lined) ---

Show Answers Only
  1. `text(life span) = 42.89 – 2.85 xx text(sleeping time)`
  2. `30\ text(years)`
Show Worked Solution

i.    `text(By calculator:)`

COMMENT: Issues here? YouTube has short and excellent help videos – search your calculator model and topic – eg. “fx-82 regression line” .

`text(life span) = 42.89 – 2.85 xx text(sleeping time)`
 

ii.   `text(Predicted life span of wallaby)`

`= 42.89 – 2.85 xx 4.5` 

`= 30.06…`

`= 30\ text(years)`

Filed Under: Bivariate Data Analysis (Y12), S4 Bivariate Data Analysis (Y12) Tagged With: Band 3, Band 4, common-content, smc-1001-20-Least-Squares Regression Line, smc-1001-70-Calculator (Stats Mode), smc-785-20-Least-Squares Regression Line, smc-785-70-Calculator (Stats Mode)

Financial Maths, 2ADV M1 EQ-Bank 1

Ralph opens an annuity account and makes a contribution of $12 000 at the end of each year for 9 years.

For the first 8 years, the interest rate is 4% per annum, compounded annually.

For the 9th year, the interest rate decreases to 3% per annum, compounded annually.


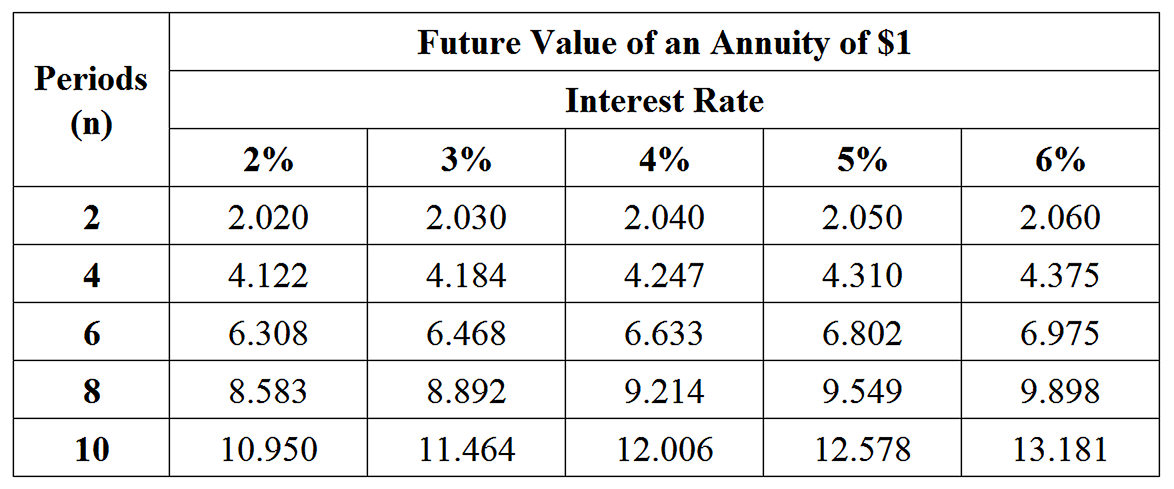
Use the Future Value of an Annuity table to calculate the amount in the account immediately after the 9th contribution is made.  (3 marks)

Show Answers Only

`$125\ 885.04`

Show Worked Solution

`text(After 8 years:)`

`text(Total)` `= 9.214 xx $12\ 000`
  `= $110\ 568`

 
`text{After 9 years (9th contribution made year end):}`

`text(Total)` `= 110\ 568 xx 1.03 + 12\ 000`
  `= $125\ 885.04`

Filed Under: F5 Annuities (Y12), Modelling Investments and Loans (Y12) Tagged With: Band 4, common-content, smc-1002-40-FV Annuity Table, smc-816-10-FV of $1 Annuity Table

Statistics, 2ADV S2 EQ-Bank 2

The table below lists the average body weight (in kilograms) and average brain weight (in grams) of nine animal species.


A least squares regression line is fitted to the data using body weight as the independent variable.

  1. Calculate the equation of the least squares regression line. (1 mark)

    --- 2 WORK AREA LINES (style=lined) ---

  2. If dingos have an average body weight of 22.3 kilograms, calculate the predicted average brain weight of a dingo using your answer to part i.   (1 mark)

    --- 1 WORK AREA LINES (style=lined) ---

Show Answers Only
  1. `text(brain weight) = 49.4 + 2.68 xx text(body weight)`
  2. `109\ text(grams)`
Show Worked Solution

i.   `text(By calculator:)`

COMMENT: Know this critical calculator skill!.

`text(brain weight) = 49.4 + 2.68 xx text(body weight)`


ii.   `text(Predicted brain weight of a dingo)`

`= 49.4 + 2.68 xx 22.3` 

`=109.164`

`= 109\ text(grams)`

Filed Under: Bivariate Data Analysis (Y12), S4 Bivariate Data Analysis (Y12) Tagged With: Band 3, Band 4, common-content, smc-1001-20-Least-Squares Regression Line, smc-1001-70-Calculator (Stats Mode), smc-785-20-Least-Squares Regression Line, smc-785-70-Calculator (Stats Mode)

Statistics, 2ADV S2 EQ-Bank 1

The arm spans (in cm) and heights (in cm) for a group of 13 boys have been measured. The results are displayed in the table below.
 

CORE, FUR2 2008 VCAA 4

The aim is to find a linear equation that allows arm span to be predicted from height.

  1. What will be the independent variable in the equation?  (1 mark)

    --- 1 WORK AREA LINES (style=lined) ---

  2. Assuming a linear association, determine the equation of the least squares regression line that enables arm span to be predicted from height. Write this equation in terms of the variables arm span and height. Give the coefficients correct to two decimal places.  (2 marks)

    --- 4 WORK AREA LINES (style=lined) ---

  3. Using the equation that you have determined in part b., interpret the slope of the least squares regression line in terms of the variables height and arm span.  (1 mark)

    --- 2 WORK AREA LINES (style=lined) ---

Show Answers Only
  1. `text(Height)`
  2. `text(Arm span)\ = 1.09 xx text(height) – 15.63`
  3. `text(On average, arm span increases by 1.09 cm)`
    `text(for each 1 cm increase in height.)`
Show Worked Solution

a.   `text(Height)`

COMMENT: Calculator skills for finding the least squares regression line were required in NESA sample exam – know this critical skill well!


b.   `text(By calculator,)`

`text(Arm span)\ = 1.09 xx text(height) – 15.63`


c.   `text(On average, arm span increases by 1.09 cm)`

`text(for each 1 cm increase in height.)`

Filed Under: Bivariate Data Analysis (Y12), S4 Bivariate Data Analysis (Y12) Tagged With: Band 3, Band 4, common-content, smc-1001-20-Least-Squares Regression Line, smc-1001-50-Gradient Interpretation, smc-1001-70-Calculator (Stats Mode), smc-785-20-Least-Squares Regression Line, smc-785-50-Gradient Interpretation, smc-785-70-Calculator (Stats Mode)

Trigonometry, 2ADV* T1 2011 HSC 24c

A ship sails 6 km from `A` to `B` on a bearing of 121°. It then sails 9 km to `C`.  The
size of angle `ABC` is 114°.
 

2UG 2011 24c

Copy the diagram into your writing booklet and show all the information on it.

  1. What is the bearing of `C` from `B`?   (1 mark)

    --- 2 WORK AREA LINES (style=lined) ---

  2. Find the distance `AC`. Give your answer correct to the nearest kilometre.   (2 marks)

    --- 5 WORK AREA LINES (style=lined) ---

  3. What is the bearing of `A` from `C`? Give your answer correct to the nearest degree.   (3 marks)

    --- 6 WORK AREA LINES (style=lined) ---

Show Answers Only
  1.  `055^@`
  2.  `13\ text(km)`
  3.  `261^@`
Show Worked Solution
STRATEGY: This deserves repeating again: Draw North-South parallel lines through major points to make the angle calculations easier!
i.     2011 HSC 24c

 `text(Let point)\ D\ text(be due North of point)\ B`

`/_ABD` `=180-121\ text{(cointerior with}\ \ /_A text{)}`
  `=59^@`
`/_DBC` `=114-59`
  `=55^@`

   
`:. text(Bearing of)\ \ C\ \ text(from)\ \ B\ \ text(is)\ 055^@`


ii.    `text(Using cosine rule:)`

`AC^2` `=AB^2+BC^2-2xxABxxBCxxcos/_ABC`
  `=6^2+9^2-2xx6xx9xxcos114^@`
  `=160.9275…`
`:.AC` `=12.685…\ \ \ text{(Noting}\ AC>0 text{)}`
  `=13\ text(km)\ text{(nearest km)}`


iii.    `text(Need to find)\ /_ACB\ \ \ text{(see diagram)}`

MARKER’S COMMENT: The best responses showed clear working on the diagram.
`cos/_ACB` `=(AC^2+BC^2-AB^2)/(2xxACxxBC)`
  `=((12.685…)^2+9^2-6^2)/(2xx(12.685..)xx9)`
  `=0.9018…`
`/_ACB` `=25.6^@\ text{(to 1 d.p.)}`


`text(From diagram,)`

`/_BCE=55^@\ text{(alternate angle,}\ DB\ text(||)\ CE text{)}`

`:.\ text(Bearing of)\ A\ text(from)\ C`

  `=180+55+25.6`
  `=260.6`
  `=261^@\ text{(nearest degree)}`

Filed Under: Bearings (Adv-2027), Bearings (Y11) Tagged With: Band 4, Band 5, Band 6, common-content, smc-6395-10-Bearings, smc-981-10-Bearings

Trigonometry, 2ADV* T1 2017 HSC 30c

The diagram shows the location of three schools. School `A` is 5 km due north of school `B`, school `C` is 13 km from school `B` and `angleABC` is 135°.


  1. Calculate the shortest distance from school `A` to school `C`, to the nearest kilometre.  (2 marks)

    --- 4 WORK AREA LINES (style=lined) ---

  2. Determine the bearing of school `C` from school `A`, to the nearest degree.  (3 marks)

    --- 6 WORK AREA LINES (style=lined) ---

Show Answers Only
  1. `17\ text{km  (nearest km)}`
  2. `213^@`
Show Worked Solution

(i)   `text(Using cosine rule:)`

`AC^2` `= AB^2 + BC^2 – 2 xx AB xx BC xx cos135^@`
  `= 5^2 + 13^2 – 2 xx 5 xx 13 xx cos135^@`
  `= 285.923…`
`:. AC` `= 16.909…`
  `= 17\ text{km  (nearest km)}`


(ii)   

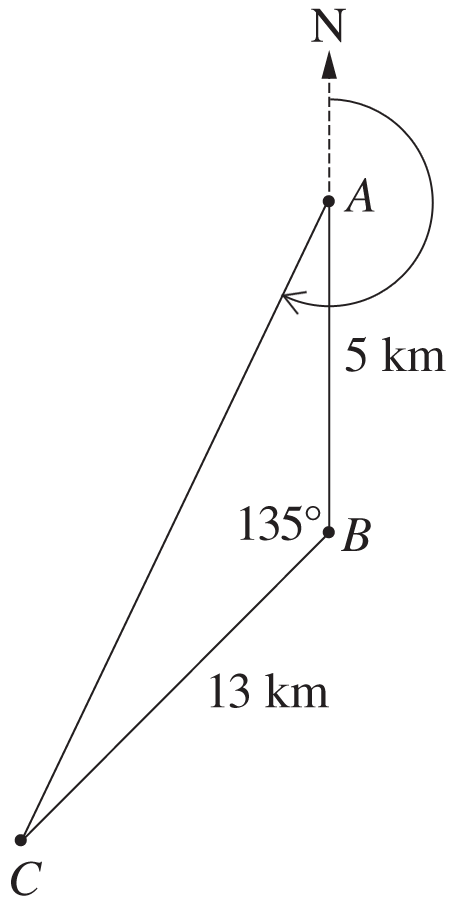
`text(Using sine rule, find)\ angleBAC:`

♦♦ Mean mark part (ii) 31%.
`(sin angleBAC)/13` `= (sin 135^@)/17`
`sin angleBAC` `= (13 xx sin 135^@)/17`
  `= 0.5407…`
`angleBAC` `= 32.7^@`


`:. text(Bearing of)\ C\ text(from)\ A`

`= 180 + 32.7`

`= 212.7^@`

`= 213^@`

Filed Under: Bearings (Adv-2027), Bearings (Y11) Tagged With: Band 5, common-content, smc-6395-10-Bearings, smc-981-10-Bearings

Trigonometry, 2ADV* T1 2005 HSC 27c

2UG-2005-27c
 

The bearing of `C` from `A` is 250° and the distance of `C` from `A` is 36 km.

  1. Explain why  `theta`  is  `110^@`.   (1 mark)

    --- 2 WORK AREA LINES (style=lined) ---

  2. If  `B`  is 15 km due north of  `A`, calculate the distance of  `C`  from  `B`, correct to the nearest kilometre.   (3 marks)

    --- 7 WORK AREA LINES (style=lined) ---

Show Answers Only
  1. `110^@`
  2. `text{43 km (nearest km)}`
Show Worked Solution

i.  `text(There is 360)^@\ text(about point)\ A`

`:.theta + 250^@` `= 360^@`
`theta` `= 110^@`


ii.   
`a^2` `= b^2 + c^2 − 2ab\ cos\ A`
`CB^2` `= 36^2 + 15^2 − 2 xx 36 xx 15 xx cos\ 110^@`
  `= 1296 + 225 −(text(−369.38…))`
  `= 1890.38…`
`:.CB` `= 43.47…`
  `= 43\ text{km  (nearest km)}`

Filed Under: Bearings (Adv-2027), Bearings (Y11) Tagged With: Band 4, common-content, smc-6395-10-Bearings, smc-981-10-Bearings

Trigonometry, 2ADV* T1 2007 26a

The diagram shows information about the locations of towns  `A`,  `B`  and  `Q`.


  1. It takes Elina 2 hours and 48 minutes to walk directly from Town  `A`  to Town  `Q`.


    Calculate her walking speed correct to the nearest km/h.    (1 mark)

    --- 2 WORK AREA LINES (style=lined) ---

  2. Elina decides, instead, to walk to Town  `B`  from Town  `A`  and then to Town  `Q`.


    Find the distance from Town  `A`  to Town  `B`. Give your answer to the nearest km.   (2 marks)

    --- 4 WORK AREA LINES (style=lined) ---

  3. Calculate the bearing of Town  `Q`  from Town  `B`.   (1 mark)

    --- 2 WORK AREA LINES (style=lined) ---

Show Answers Only
  1. `5\ text(km/hr)\ text{(nearest km/hr)}`
  2. `18\ text(km)\ text{(nearest km)}`
  3. `236^@`
Show Worked Solution

i.  `text(2 hrs 48 mins) = 168\ text(mins)`

`text(Speed)\ text{(} A\ text(to)\ Q text{)}` `= 15/168`
  `= 0.0892…\ text(km/min)`


`text(Speed)\ text{(in km/hr)}` `= 0.0892… xx 60`
  `= 5.357…\ text(km/hr)`
  `= 5\ text(km/hr)\ text{(nearest km/hr)}`


ii.  

`text(Using cosine rule)`

`AB^2` `= 15^2 + 10^2 – 2 xx 15 xx 10 xx cos 87^@`
  `= 309.299…`
`AB` `= 17.586…`
  `= 18\ text(km)\ text{(nearest km)}`


`:.\ text(The distance from Town)\ A\ text(to Town)\ B\ text(is 18 km.)`


iii.  
`/_CAQ` `= 31^@\ \ \ text{(} text(straight angle at)\ A text{)}`
`/_AQD` `= 31^@\ \ \ text{(} text(alternate angle)\ AC\ text(||)\ DQ text{)}`
`/_DQB` `= 87 – 31 = 56^@`
`/_QBE` `= 56^@\ \ \ text{(} text(alternate angle)\ DQ \ text(||)\ BE text{)}`


`:.\ text(Bearing of)\ Q\ text(from)\ B`

`= 180 + 56`

`= 236^@`

Filed Under: Bearings (Adv-2027), Bearings (Y11) Tagged With: Band 4, Band 5, common-content, smc-6395-10-Bearings, smc-981-10-Bearings

Functions, 2ADV F1 SM-Bank 56

Simplify  `(9x^2)/(x+3) -: (3x)/(x^2-9)`.   (2 marks)

--- 4 WORK AREA LINES (style=lined) ---

Show Answers Only

`3x(x-3)`

Show Worked Solution
`(9x^2)/(x+3) -: (3x)/(x^2-9)` `=(9x^2)/(x+3) xx  (x^2-9)/(3x)`  
  `=(9x^2)/(x+3) xx  ((x-3)(x+3))/(3x)`  
  `=3x(x-3)`  

Filed Under: Algebraic Techniques (Adv-2027), Algebraic Techniques (Y11) Tagged With: Band 3, common-content, smc-6213-10-Algebraic Fractions, smc-983-40-Algebraic Fractions

Functions, 2ADV F1 SM-Bank 55

Simplify  `(4p-12p^2)/3 xx (6p)/(3p^2-p)`.  (2 marks)

Show Answers Only

`-8p`

Show Worked Solution
`(4p-12p^2)/3 xx (6p)/(3p^2-p)` `= (4p(1-3p))/3 xx (6p)/(p(3p-1))`  
  `= (8p(1-3p))/(3p-1)`  
  `=-8p`  

Filed Under: Algebraic Techniques (Adv-2027), Algebraic Techniques (Y11) Tagged With: Band 3, common-content, smc-6213-10-Algebraic Fractions, smc-983-40-Algebraic Fractions

Functions, 2ADV F1 SM-Bank 54

Find the reciprocal of   `1/a + 1/b -c/(ab)`.   (2 marks)

Show Answers Only

`(ab)/(a+b-c)`

Show Worked Solution
`1/a + 1/b -c/(ab)` `=b/(ab)+a/(ab)-c/(ab)`
  `=(b+a-c)/(ab)`

 
`text(Reciprocal of)\ \ x = x^(-1)`

`:.\ text(Reciprocal of)\ \ (b+a-c)/(ab)=((b+a-c)/(ab))^(-1)=(ab)/(a+b-c)`

Filed Under: Algebraic Techniques (Adv-2027), Algebraic Techniques (Y11) Tagged With: Band 3, common-content, smc-6213-10-Algebraic Fractions, smc-983-40-Algebraic Fractions

Statistics, STD2 S1 EQ-Bank 4

A high school conducted a survey asking students what their favourite Summer sport was.

The Pareto chart shows the data collected.


  1. What percentage of students chose Hockey as their favourite Summer sport?  (1 mark)

    --- 2 WORK AREA LINES (style=lined) ---

  2. What percentage of students chose Touch Football as their favourite Summer sport?  (1 mark)

    --- 2 WORK AREA LINES (style=lined) ---

Show Answers Only
  1. `text(2%)`
  2. `text(22%)`
Show Worked Solution

i.   `text(Method 1)`

`text(Percentage who chose hockey)`

`=\ text{cum freq (at hockey column) – cum freq (at tennis column)}` 

`=100-98`

`=2 text(%)`
 

`text(Method 2)`

`text(Column 1 → 180 people = 30%)`

`text(Total surveyed) = 180 -: 0.3 = 600`

`:.\ text(Hockey %)` `=12/600 xx 100`  
  `=2\text(%)`  


ii.   `text(Percentage who chose touch football)`

`=\ text{cum freq (at touch football column) – cum freq (at cricket column)}` 

`=76-54`

`=22 text(%)`

Filed Under: Bar Charts, Histograms and Other Graphs (Std 1), Other Chart Types (Y12), Other Charts (Std 2) Tagged With: Band 4, Band 5, common-content, smc-1128-22-Pareto, smc-822-10-Pareto Charts, smc-998-10-Pareto Charts

Statistics, STD2 S1 EQ-Bank 6

The Pareto chart below shows the data collected from a survey where people were asked to choose their favourite overseas holiday destination.

Using the chart, how many people were surveyed?  (2 marks)
 

--- 5 WORK AREA LINES (style=lined) ---

Show Answers Only

`500`

Show Worked Solution

`text(Percentage of people whose chose NZ)`

`= 80 – 60`

`= 20text(%)`
 

`text(Number of people who chose NZ)`

`= 100`
 

`text(20%)\ xx\ text(Total surveyed = 100)`

`:.\ text(Total surveyed = 500)`

Filed Under: Other Chart Types (Y12), Other Charts (Std 2) Tagged With: Band 5, common-content, smc-822-10-Pareto Charts, smc-998-10-Pareto Charts

Statistics, STD2 S1 EQ-Bank 5

An island resort surveyed 400 guests by asking them on which continent they lived.

The table below shows the data collected.


Complete the Pareto chart below to show the data collected.  (3 marks)
 

--- 0 WORK AREA LINES (style=lined) ---

Show Answers Only

Show Worked Solution

`text(% Asia)\ = 168/400=42 text(%)`

`text(% North America)\ = 120/400=30 text(%)`

`text(% Australia)\ = 88/400=22 text(%)`

`text(% Europe)\ = 24/400=6 text(%)`
 

Filed Under: Bar Charts, Histograms and Other Graphs (Std 1), Other Chart Types (Y12), Other Charts (Std 2) Tagged With: Band 5, common-content, smc-1128-22-Pareto, smc-822-10-Pareto Charts, smc-998-10-Pareto Charts

Statistics, STD2 S1 SM-Bank 2

A survey question is shown.

Give TWO reasons why this survey may be considered to be poorly designed.  (2 marks)

Show Answers Only

`text(Only 3 choices of many colours are given.)`

Show Worked Solution

`text(Poor design reason:)`

`text(- only 3 choices of many colours are given.)`

`text(- two colours might be someone’s equal favourite colours.)`

Filed Under: Classifying Data (Std 2), Data Classification, Investigation and Sampling Methods (Std2-2027) Tagged With: Band 4, common-content, smc-6309-30-Other, smc-820-30-Other

Financial Maths, STD2 F5 2019 HSC 42

The table shows the future values of an annuity of $1 for different interest rates for 4, 5 and 6 years. The contributions are made at the end of each year.


An annuity account is opened and contributions of $2000 are made at the end of each year for 7 years.

For the first 6 years, the interest rate is 4% per annum, compounding annually.

For the 7th year, the interest rate increases to 5% per annum, compounding annually.

Calculate the amount in the account immediately after the 7th contribution is made.  (3 marks)

--- 6 WORK AREA LINES (style=lined) ---

Show Answers Only

`$15\ 929.30`

Show Worked Solution

`text{Annuity compounding factor (4% for 6 years)} = 6.633`

♦♦ Mean mark 27%.

`:.\ text(Value after 6 years)` `= 2000 xx 6.633`
  `= $13\ 266.00`

 
`text(At the end of 7th year:)`

`text(Value)` `= 13\ 266 xx 1.05 + 2000`
  `= 13\ 929.30 + 2000`
  `= $15\ 929.30`

Filed Under: F5 Annuities (Y12), Modelling Investments and Loans (Y12) Tagged With: Band 5, common-content, smc-1002-40-FV Annuity Table, smc-816-10-FV of $1 Annuity Table

Statistics, STD2 S1 2019 HSC 39

Two netball teams, Team A and Team B, each played 15 games in a tournament. For each team, the number of goals scored in each game was recorded.

The frequency table shows the data for Team A.


The data for Team B was analysed to create the box-plot shown.


Compare the distributions of the number of goals scored by the two teams. Support your answer with the construction of a box-plot for the data for Team A.  (5 marks)

--- 8 WORK AREA LINES (style=lined) ---

Show Answers Only

`text(See Worked Solution)`

Show Worked Solution

`text(Team A: High = 28, Low = 19,)\ Q_1 = 23, Q_3 = 27,\ text{Median = 26}`
 

`text(Team A’s distribution is negatively skewed while)`

♦♦ Mean mark 28%.

`text(Team B’s distribution is slightly positively skewed.)`

`text(The standard deviation of Team A’s distribution is)`

`text(smaller than Team B, as both its IQR and range is)`

`text(smaller.)`

`text(Team B is a more successful team at scoring goals)`

`text(as each value in its 5-point summary is higher than)`

`text(Team A’s equivalent value.)`

Filed Under: Summary Statistics - Box Plots (Std 2), Summary Statistics - Box Plots (Std2-2027), Summary Statistics - Box Plots (Y12) Tagged With: Band 5, common-content, smc-1000-20-Parallel Box-Plots, smc-1000-30-Draw Box-Plots, smc-6313-20-Parallel Box Plots, smc-6313-30-Draw Box Plots, smc-825-20-Parallel Box-Plots, smc-825-30-Draw Box-Plots

Statistics, STD2 S5 2019 HSC 38

In a particular country, the birth weight of babies is normally distributed with a mean of 3000 grams. It is known that 95% of these babies have a birth weight between 1600 grams and 4400 grams.

One of these babies has a birth weight of 3497 grams. What is the `z`-score of this baby's birth weight?  (2 marks)

--- 4 WORK AREA LINES (style=lined) ---

Show Answers Only

`0.71`

Show Worked Solution

`text(95% babies within)\ 1600 – 4400`

♦ Mean mark 44%.

`text(i.e.)\ \ 3000 +- \ 2\ text(σ = 1600 – 4400)`

`2sigma` `= 4400-3000`
  `= 1400`
`sigma` `= 700`
`:. ztext(-score)\ (3497)` `= (x-mu)/σ`
  `= (3497 – 3000)/700`
  `= 0.71`

Filed Under: Normal Distribution (Y12), S5 The Normal Distribution (Y12) Tagged With: Band 5, common-content, smc-819-10-Single z-score, smc-995-10-Single z-score

Algebra, STD2 A2 2019 HSC 34

The relationship between British pounds `(p)` and Australian dollars `(d)` on a particular day is shown in the graph.
 

  1. Write the direct variation equation relating British pounds to Australian dollars in the form  `p = md`. Leave `m` as a fraction.  (1 mark)

    --- 2 WORK AREA LINES (style=lined) ---

  2. The relationship between Japanese yen `(y)` and Australian dollars `(d)` on the same day is given by the equation  `y = 76d`.


    Convert 93 100 Japanese yen to British pounds.  (2 marks)

    --- 4 WORK AREA LINES (style=lined) ---

Show Answers Only
  1. `p = 4/7 d`
  2. `93\ 100\ text(Yen = 700 pounds)`
Show Worked Solution

a.   `m = text(rise)/text(run) = 4/7`

♦ Mean mark 42%.

`p = 4/7 d`


b.   `text(Yen to Australian dollars:)`

`y` `=76d`
`93\ 100` `= 76d`
`d` `= (93\ 100)/76`
  `= 1225`

 
`text(Aust dollars to pounds:)`

`p` `= 4/7 xx 1225`
  `= 700\ text(pounds)`

 
`:. 93\ 100\ text(Yen = 700 pounds)`

Filed Under: Applications: Currency, Fuel and Other Problems (Std 2), Applications: Currency, Fuel and Other Problems (Std2-2027), Linear Functions (Adv-2027), Linear Functions (Y11), Variation and Rates of Change Tagged With: Band 4, Band 5, common-content, num-title-ct-patha, num-title-qs-hsc, smc-4239-70-Currency convert, smc-6214-20-Other Real World Applications, smc-6249-40-Graphical Solutions, smc-6256-10-Currency Conversion, smc-793-10-Currency Conversion, smc-985-20-Other Linear Applications

Statistics, STD2 S5 2019 HSC 15 MC

The scores on an examination are normally distributed with a mean of 70 and a standard deviation of 6. Michael received a score on the examination between the lower quartile and the upper quartile of the scores.

Which shaded region most accurately represents where Michael's score lies?
 

A. B.
C. D.
Show Answers Only

`A`

Show Worked Solution

`text{68% of marks lie between 64 and 76 (mean ± 1 σ).}`

♦♦♦ Mean mark 17%.

`text(50% of marks lie between)\ Q_1\ text(and)\ Q_3.`

`=> A`

Filed Under: Normal Distribution (Y12), S5 The Normal Distribution (Y12) Tagged With: Band 6, common-content, smc-819-20-z-score Intervals, smc-819-40-Graphs, smc-995-20-z-score Intervals, smc-995-40-Graphs

Algebra, STD2 A2 2019 HSC 14 MC

Last Saturday, Luke had 165 followers on social media. Rhys had 537 followers. On average, Luke gains another 3 followers per day and Rhys loses 2 followers per day.

If  `x`  represents the number of days since last Saturday and  `y`  represents the number of followers, which pair of equations model this situation?

A.  `text(Luke:)\ \ y = 165x + 3`


`text(Rhys:)\ \ y = 537x - 2`

B. `text(Luke:)\ \ y = 165 + 3x`


`text(Rhys:)\ \ y = 537 - 2x`

C. `text(Luke:)\ \ y = 3x + 165`


`text(Rhys:)\ \ y = 2x - 537`

D. `text(Luke:)\ \ y = 3 + 165x`


`text(Rhys:)\ \ y = 2 - 537x`

Show Answers Only

`B`

Show Worked Solution

`text(Luke starts with 165 and adds 3 per day:)`

`y = 165 + 3x`

`text(Rhys starts with 537 and loses 2 per day:)`

`y = 537 – 2x`

`=> B`

Filed Under: Applications: Currency, Fuel and Other Problems (Std 2), Linear Applications, Linear Functions (Adv-2027), Linear Functions (Y11) Tagged With: Band 4, common-content, num-title-ct-coreb, num-title-qs-hsc, smc-6214-50-Simultaneous Equations, smc-793-30-Other Linear Applications, smc-985-40-Simultaneous Equations

Financial Maths, STD2 F4 2019 HSC 13 MC

The graph show the future values over time of  `$P`, invested at three different rates of compound interest.


Which of the following correctly identifies each graph?

A. B.
C. D.
Show Answers Only

`C`

Show Worked Solution

`text(Values increase quicker)`

`text(- higher compounding interest rate)`

`text(- same rate but more frequent compounding period)`

`:. W = 10text(% quarterly)`

`X = 10text(% annually)`

`Y = 5text(% annually)`

 
`=> C`

Filed Under: Compound Interest, Compound Interest and Shares (Std2), Modelling Investments and Loans (Y12) Tagged With: Band 4, common-content, num-title-ct-coreb, num-title-qs-hsc, smc-1002-30-Interest Rate Graph Comparison, smc-4334-40-Find r, smc-4334-60-Graphs, smc-817-30-i/r comparisons (incl. graphs)

Statistics, STD2 S1 2019 HSC 10 MC

A school collected data related to the reasons given by students for arriving late. The Pareto chart shows the data collected.
 

What percentage of students gave the reason 'Train or bus delay'?

  1. `text(6%)`
  2. `text(15%)`
  3. `text(30%)`
  4. `text(92%)`
Show Answers Only

`A`

Show Worked Solution

`text(Train or bus delay (%))`

♦♦♦ Mean mark 18%.

`= 92 – 86`

`= 6text(%)`

`=> A`

Filed Under: Other Chart Types (Y12), Other Charts (Std 2) Tagged With: Band 6, common-content, smc-822-10-Pareto Charts, smc-998-10-Pareto Charts

Measurement, STD2 M6 2019 HSC 4 MC

Which compass bearing is the same as a true bearing of 110°?

  1. `text(S20°E)`
  2. `text(S20°W)`
  3. `text(S70°E)`
  4. `text(S70°W)`
Show Answers Only

`C`

Show Worked Solution

♦ Mean mark 47%.

`110° = text(S70°E)`

`=> C`

Filed Under: Bearings and Radial Surveys (Std2), Right-Angled Trig Tagged With: Band 5, common-content, num-title-ct-coreb, num-title-qs-hsc, smc-4552-70-Bearings, smc-803-30-Compass vs True Bearings

Financial Maths, STD2 F4 2019 HSC 3 MC

Chris opens a bank account and deposits $1000 into it. Interest is paid at 3.5% per annum, compounding annually.

Assuming no further deposits or withdrawals are made, what will be the balance in the account at the end of two years?

  1. $1070.00
  2. $1071.23
  3. $1822.50
  4. $2070.00
Show Answers Only

`=> B`

Show Worked Solution
`FV` `= PV(1 + r)^n`
  `= 1000(1 + 0.035)^2`
  `= $1071.23`

 
`=> B`

Filed Under: Compound Interest, Compound Interest and Shares (Std2), Modelling Investments and Loans (Y12) Tagged With: Band 4, common-content, num-title-ct-coreb, num-title-qs-hsc, smc-1002-20-FV Formula, smc-4334-10-Find FV, smc-817-20-FV Formula

Statistics, STD2 S4 2019 HSC 23

A set of bivariate data is collected by measuring the height and arm span of seven children. The graph shows a scatterplot of these measurements.


  1. Calculate Pearson's correlation coefficient for the data, correct to two decimal places.  (1 mark)

    --- 1 WORK AREA LINES (style=lined) ---

  2. Identify the direction and the strength of the linear association between height and arm span.  (1 mark)

    --- 2 WORK AREA LINES (style=lined) ---

  3. The equation of the least-squares regression line is shown.
     
               Height = 0.866 × (arm span) + 23.7
     
    A child has an arm span of 143 cm.


    Calculate the predicted height for this child using the equation of the least-squares regression line.  (1 mark)

    --- 1 WORK AREA LINES (style=lined) ---

Show Answers Only
  1. `0.98\ \ (text(2 d.p.))`
  2. `text(Direction: positive)`
    `text(Strength: strong)`
  3. `147.538\ text(cm)`
Show Worked Solution

a.   `text{Use  “A + Bx”  function (fx-82 calc):}`

♦ Mean mark 40%.
COMMENT: Issues here? YouTube has short and excellent help videos – search your calculator model and topic – eg. “fx-82 correlation” .

`r` `= 0.9811…`
  `= 0.98\ \ (text(2 d.p.))`


b.   `text(Direction: positive)`

`text(Strength: strong)`


c.    `text(Height)` `= 0.866 xx 143 + 23.7`
    `= 147.538\ text(cm)`

Filed Under: Bivariate Data Analysis (Y12), S4 Bivariate Data Analysis (Y12) Tagged With: Band 3, Band 4, Band 5, common-content, smc-1001-30-Correlation, smc-1001-40-Pearson's, smc-1001-70-Calculator (Stats Mode), smc-785-30-Correlation, smc-785-40-Pearson's, smc-785-70-Calculator (Stats Mode)

Probability, STD2 S2 2019 HSC 20

A roulette wheel has the numbers 0, 1, 2, …, 36 where each of the 37 numbers is equally likely to be spun.


If the wheel is spun 18 500 times, calculate the expected frequency of spinning the number 8.  (2 marks)

--- 4 WORK AREA LINES (style=lined) ---

Show Answers Only

`500`

Show Worked Solution

`P(8) = 1/37`

`:.\ text(Expected Frequency (8))`

`= 1/37 xx 18\ 500`

`= 500`

Filed Under: Probability, Relative Frequency (Std 1), Relative Frequency (Std 2), Relative Frequency (Y11) Tagged With: Band 4, common-content, num-title-ct-core, num-title-qs-hsc, smc-1133-20-Games of Chance, smc-4225-35-Relative frequency, smc-827-20-Games of Chance, smc-827-40-Expected Frequency (np), smc-990-20-Games of Chance, smc-990-40-Expected Frequency (np)

Statistics, STD2 S1 2019 HSC 19

The heights, in centimetres, of 10 players on a basketball team are shown.

170, 180, 185, 188, 192, 193, 193, 194, 196, 202

Is the height of the shortest player on the team considered an outlier? Justify your answer with calculations. (3 marks)

Show Answers Only

`text(See Worked Solutions)`

Show Worked Solution

`Q_1 = 185, \ Q_3 = 194`

Mean mark 51%.
COMMENT: The last statement must be made to achieve full marks here!

`IQR = 194 – 185 = 9`

`text(Shortest player = 170)`

`text(Outlier height:)`

`Q_1 – 1.5 xx IQR ` `= 185 – 1.5 xx 9`
  `= 171.5`

 
`:.\ text(S)text(ince 170 < 171.5, 170 is an outlier.)`

Filed Under: Measures of Centre and Spread (Std2-2027), Summary Statistics - No Graph (Std 2), Summary Statistics - No graph (Y12) Tagged With: Band 4, common-content, smc-6312-30-IQR and Outliers, smc-824-30-IQR and Outliers, smc-999-30-IQR and Outliers

Algebra, STD2 A4 SM-Bank 1 MC

The graph below represents  `y = a^x`.


What is the approximate value of  `2(a^5)`?

  1.   4
  2.   8
  3.  32
  4.  64
Show Answers Only

`B`

Show Worked Solution

`text(From graph:)`

`a^5` `=4`
`:. 2(a^5)` `= 2 xx 4`
  `= 8`

 
`=>\ text(B)`

Filed Under: Graphs and Applications (Y11), Non-Linear: Exponential/Quadratics (Std 2) Tagged With: Band 4, common-content, smc-830-10-Identify Graphs, smc-966-10-Exponential graphs

Measurement, STD2 M6 SM-Bank 4

The diagram shows three checkpoints A, B and C. Checkpoint C is due east of Checkpoint A. The bearing of Checkpoint B from Checkpoint A is N22°E and the bearing of Checkpoint C from Checkpoint B is S68°E. The distance between Checkpoint A and Checkpoint B is 42 kilometres.


  1. Mark the given information on the diagram and explain why `angleABC` is 90°.  (2 marks)

    --- 4 WORK AREA LINES (style=lined) ---

  2. Find the distance, to the nearest kilometre, between Checkpoint A and Checkpoint C.  (2 marks)

    --- 4 WORK AREA LINES (style=lined) ---

  3. If a runner is travelling 12.6 km/h, how long does it take her to travel between Checkpoint A and Checkpoint B, in hours and minutes?  (2 marks)

    --- 4 WORK AREA LINES (style=lined) ---

Show Answers Only
  1. `text(See Worked Solutions)`
  2. `112\ text{km}`
  3. `3text(h 20 mins)`
Show Worked Solution
i.   
`angle ABC` `= 22 + 68`
  `= 90°`


ii.  `text(In)\ \ DeltaABC,`

`cosangleBAC` `= (AB)/(AC)`
`cos68°` `= 42/(AC)`
`AC` `= 42/(cos68°)`
  `= 112.11…`
  `= 112\ text{km  (nearest km)}`


iii.    `text(Travel time)` `= text(dist)/text(speed)`
    `= 42/12.6`
    `= 3.333…`
    `= 3text(h 20 mins)`

Filed Under: Bearings and Radial Surveys (Std2), M3 Right-Angled Triangles (Y12) Tagged With: Band 4, common-content, smc-1103-20-Right-angled Trig, smc-1103-60-Bearings, smc-803-10-Bearings

Statistics, STD2 S1 SM-Bank 2 MC

The dot plots show the height of students in Year 9 and Year 12 in a school. They are drawn on the same scale.


Which statement about the change in heights when comparing Y9 to Y12 is correct?

  1. The mean increased and the standard deviation decreased.
  2. The mean decreased and the standard deviation decreased.
  3. The mean increased and the standard deviation increased.
  4. The mean decreased and the standard deviation increased.
Show Answers Only

`A`

Show Worked Solution

`text{Mean has increased (Y9 to Y12)}`

`text(The Year 12 data is more tightly distributed)`

`text(around the mean.)`

`:.\ text{Standard deviation has decreased (Y9 to Y12)}`

`=> A`

Filed Under: Bar Charts, Histograms and Other Graphs (Std 1), Other Chart Types (Y12), Other Charts (Std 2), Other Charts (Std2-2027), S4 Bivariate Data Analysis (Y12) Tagged With: Band 5, common-content, smc-1128-28-Other Charts, smc-6311-30-Other Charts, smc-822-40-Other Charts, smc-998-40-Other Charts

Statistics, STD2 S1 SM-Bank 1

Write down the five-number summary for the dataset 

`3, \ 7, \ 8, \ 11, \ 13, \ 18.`  (2 marks)

--- 5 WORK AREA LINES (style=lined) ---

Show Answers Only
`text(Minimum value:)`   `3`
`text(First quartile:)`   `7`
`text(Median:)`   `(11 + 8)/2 = 9.5`
`text(Third quartile:)`   `13`
`text(Maximum value:)`   `18`
Show Worked Solution
`text(Minimum value:)`   `3`
`text(First quartile:)`   `7`
`text(Median:)`   `(11 + 8)/2 = 9.5`
`text(Third quartile:)`   `13`
`text(Maximum value:)`   `18`

Filed Under: Box Plots and 5-Number Summary, Summary Statistics - Box Plots (Std 2), Summary Statistics - Box Plots (Std2-2027), Summary Statistics - Box Plots (Y12) Tagged With: Band 4, common-content, num-title-ct-corea, smc-1000-10-Single Box-Plots, smc-1131-35-Box Plots, smc-5021-15-5 number (even values), smc-6313-10-Single Box Plots, smc-825-10-Single Box-Plots

Statistics, STD2 S1 SM-Bank 1 MC

A survey asked the following question for students born in Australia:

"Which State or Territory were you born in?"

How would the responses be classified?

  1. Categorical, ordinal
  2. Categorical, nominal
  3. Numerical, discrete
  4. Numerical, continuous
Show Answers Only

`B`

Show Worked Solution

`text{The data is categorical (not numerical) since}`

`text(the name of a State is required.)`

`text(This data cannot be ordered.)`

`=> B`

Filed Under: Classifying Data, Classifying Data (Std 1), Classifying Data (Std 2), Classifying Data (Y12), Data Classification, Investigation and Sampling Methods (Std2-2027) Tagged With: Band 3, common-content, num-title-ct-core, num-title-qs-hsc, smc-1127-20-Classifying Data, smc-5075-10-Categorical, smc-6309-20-Data Classification, smc-820-20-Classifying Data

Statistics, STD2 S4 EQ-Bank 2

Pedro is planning a statistical investigation.

List the steps that Pedro must follow to execute the statistical investigation correctly.  (2 marks)

Show Answers Only

`text(- Identify a problem and pose a statistical question)`

`text(- Collect or obtain data)`

`text(- Represent and analyse the data collected or obtained)`

`text(- Communicate and interpret findings.)`

Show Worked Solution

`text(Steps are:)`

`text(- Identify a problem and pose a statistical question)`

`text(- Collect or obtain data)`

`text(- Represent and analyse the data collected or obtained)`

`text(- Communicate and interpret findings.)`

Filed Under: Bivariate Data Analysis (Y12), S3 Further Statistical Analysis (Y12), S4 Bivariate Data Analysis (Y12) Tagged With: Band 3, common-content, smc-1001-80-Investigation Process, smc-1113-80-Investigation Process, smc-785-80-Investigation Process

Statistics, STD2 S5 SM-Bank 5

The diastolic measurement for blood pressure in 30-year-old people is normally distributed, with a mean of 82 and standard deviation of 16.

  1.   A person is considered to have low blood pressure if the diastolic measurement is 66 or less.


      What percentage of 30-year-old people have low blood pressure?  (1 mark)

    --- 1 WORK AREA LINES (style=lined) ---

  2.   Calculate the `z`-score for a diastolic measurement of 70.  (1 mark)

    --- 1 WORK AREA LINES (style=lined) ---

Show Answers Only
  1. `16text(%)`
  2. `−0.75`
Show Worked Solution
a.    `ztext(-score)\ (66)` `= (66 – 82)/16`
    `= −1`


`:.\ text(Percentage)` `= 100 – (50+34)`
  `= 16text(%)`


b.    `ztext(-score)\ (70)` `= (70 – 82)/16`
    `= −0.75`

Filed Under: S5 The Normal Distribution (Y12) Tagged With: Band 4, common-content, smc-819-10-Single z-score

Statistics, STD2 S4 SM-Bank 1

A student claimed that as time spent swimming training increases, the time to run a 1 kilometre time trial decreases.

After collecting and analysing some data, the student found the correlation coefficient, `r`, to be – 0.73.

What does this correlation indicate about the relationship between the time a student spends swimming training and their 1 kilometre run time trial times.  (1 mark)

Show Answers Only

`text(– 0.73 indicates a strong negative relationship exists.)`

`text(In this case, it means the more time spent swimming)`

`text(training is associated with a quicker time of running a)`

`text(1 kilometre time trial.)`

Show Worked Solution

`text(– 0.73 indicates a strong negative relationship exists.)`

`text(In this case, it means the more time spent swimming)`

`text(training is associated with a quicker time of running a)`

`text(1 kilometre time trial.)`

Filed Under: Bivariate Data Analysis (Y12), S4 Bivariate Data Analysis (Y12) Tagged With: Band 3, common-content, smc-1001-30-Correlation, smc-785-30-Correlation

Measurement, STD2 M6 SM-Bank 7 MC

Jeet walks 5 km from his home on a bearing of 153°. He then walks due north until he arrives a point which is due east of his home.

How far east, to the nearest 0.1 km, is Jeet from home?

  1.  2.3 km
  2.  2.5 km
  3.  4.9 km
  4.  9.8 km
Show Answers Only

`A`

Show Worked Solution

`text(Jeet finishes at)\ P`

`text(Find)\ \ OP:`

`cos 63°` `= (OP)/5`
`:. OP` `= 5 xx cos 63°`
  `= 2.26…`

 
`=> A`

Filed Under: Bearings and Radial Surveys (Std2), M3 Right-Angled Triangles (Y12) Tagged With: Band 4, common-content, smc-1103-60-Bearings, smc-803-Bearings

Measurement, STD2 M6 SM-Bank 3 MC

Which of the following expresses S65°W as a true bearing?

  1. 065°
  2. 155°
  3. 245°
  4. 295°
Show Answers Only

`C`

Show Worked Solution

`text(True bearing)` `= 180 + 65`
  `= 245°`

`=> C`

Filed Under: Bearings (Adv-2027), Bearings (Y11), Bearings and Radial Surveys (Std2), M3 Right-Angled Triangles (Y12) Tagged With: Band 4, common-content, smc-1103-70-Compass vs True Bearings, smc-6395-30-Compass vs True Bearings, smc-803-30-Compass vs True Bearings, smc-981-20-Compass vs True Bearings

Algebra, STD2 A4 SM-Bank 6 MC

A computer application was used to draw the graphs of the equations

`x - y = 4`  and  `x + y = 4`

Part of the screen is shown.

What is the solution when the equations are solved simultaneously?

  1. `x = 4, y = 4`
  2. `x = 4, y = 0`
  3. `x = 0, y = 4`
  4. `x = 0, y = −4`
Show Answers Only

`B`

Show Worked Solution

`text(Solution occurs at the intersection of the two lines.)`

`=> B`

Filed Under: A3 Types of Relationships (Y12), Linear Functions (Adv-2027), Linear Functions (Y11), Simultaneous Equations and Applications (Std 2) Tagged With: Band 3, common-content, smc-1099-30-Find intersection, smc-6214-05-Coordinate Geometry, smc-6214-50-Simultaneous Equations, smc-794-20-Find Intersection, smc-985-30-Coordinate Geometry, smc-985-40-Simultaneous Equations

  • « Previous Page
  • 1
  • 2
  • 3
  • 4
  • …
  • 6
  • Next Page »

Copyright © 2014–2025 SmarterEd.com.au · Log in