If `(y-3)/3 =5`, find `y`. (2 marks)
Algebra, STD2 A1 EQ-Bank 16
Find the value of `r` given `r/7-4 = 3`. (1 mark)
Financial Maths, STD2 F5 2015 HSC 30c
The table gives the present value interest factors for an annuity of $1 per period, for various interest rates `(r)` and numbers of periods `(N)`.

- Oscar plans to invest $200 each month for 74 months. His investment will earn interest at the rate of 0.0080 (as a decimal) per month.
Use the information in the table to calculate the present value of this annuity. (1 mark)
--- 2 WORK AREA LINES (style=lined) ---
- Lucy is using the same table to calculate the loan repayment for her car loan. Her loan is `$21\ 500` and will be repaid in equal monthly repayments over 6 years. The interest rate on her loan is 10.8% per annum.
Calculate the amount of each monthly repayment, correct to the nearest dollar. (2 marks)
--- 4 WORK AREA LINES (style=lined) ---
Statistics, STD2 S1 2015 HSC 29d
Data from 200 recent house sales are grouped into class intervals and a cumulative frequency histogram is drawn.

- Use the graph to estimate the median house price. (1 mark)
--- 1 WORK AREA LINES (style=lined) ---
- By completing the table, calculate the mean house price. (3 marks)
\begin{array} {|c|c|}
\hline
\rule{0pt}{2.5ex} \text{Class Centre} \rule[-1ex]{0pt}{0pt} & \text{Frequency} \\ \text{(\$'000)} & \\
\hline
\rule{0pt}{2.5ex} \rule[-1ex]{0pt}{0pt} & \\
\hline
\rule{0pt}{2.5ex} \rule[-1ex]{0pt}{0pt} & \\
\hline
\rule{0pt}{2.5ex} \rule[-1ex]{0pt}{0pt} & \\
\hline
\rule{0pt}{2.5ex} \rule[-1ex]{0pt}{0pt} & \\
\hline
\end{array}
--- 2 WORK AREA LINES (style=lined) ---
Show Worked Solution
| a. |
|

`text(From the graph, the estimated median)`
`text(house price = $392 500)`
♦♦♦ Mean marks of 9% for part (i) and 34% for part (ii)!
b.
\begin{array} {|c|c|}
\hline
\rule{0pt}{2.5ex} \text{Class Centre} \rule[-1ex]{0pt}{0pt} & \text{Frequency} \\ \text{(\$’000)} & \\
\hline
\rule{0pt}{2.5ex} 375 \rule[-1ex]{0pt}{0pt} & 30\\
\hline
\rule{0pt}{2.5ex} 385 \rule[-1ex]{0pt}{0pt} & 50 \\
\hline
\rule{0pt}{2.5ex} 395 \rule[-1ex]{0pt}{0pt} & 70 \\
\hline
\rule{0pt}{2.5ex} 405 \rule[-1ex]{0pt}{0pt} & 50 \\
\hline
\end{array}
`text(Mean house price ($’000))`
`= (375xx30 + 385xx50 + 395xx70 + 405xx50)/200`
`=$392`
`:. text(Mean house price is)\ $392\ 000`
Statistics, STD2 S4 2015 HSC 28e
The shoe size and height of ten students were recorded.
\begin{array} {|l|c|c|}
\hline \rule{0pt}{2.5ex} \text{Shoe size} \rule[-1ex]{0pt}{0pt} & \text{6} & \text{7} & \text{7} & \text{8} & \text{8.5} & \text{9.5} & \text{10} & \text{11} & \text{12} & \text{12} \\
\hline \rule{0pt}{2.5ex} \text{Height} \rule[-1ex]{0pt}{0pt} & \text{155} & \text{150} & \text{165} & \text{175} & \text{170} & \text{170} & \text{190} & \text{185} & \text{200} & \text{195} \\
\hline
\end{array}
- Complete the scatter plot AND draw a line of fit by eye. (2 marks)
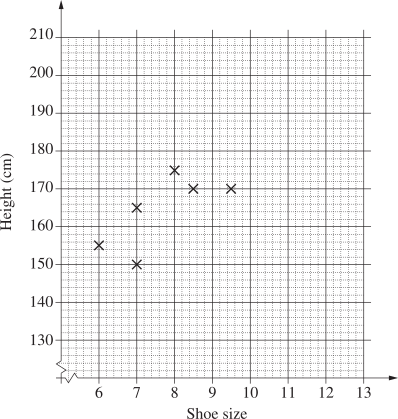
- Use the line of fit to estimate the height difference between a student who wears a size 7.5 shoe and one who wears a size 9 shoe. (1 mark)
--- 1 WORK AREA LINES (style=lined) ---
- A student calculated the correlation coefficient to be 1 for this set of data. Explain why this cannot be correct. (1 mark)
--- 2 WORK AREA LINES (style=lined) ---
Show Worked Solution
a.

b. `text{Shoe size 7½ gives a height estimate of 162 cm (see graph).}`
`text{Shoe size 9 gives a height estimate of 175 cm (see graph).}`
`text(Height difference)= 175-162= 13\ text{cm (or close given LOBF)}`
c. `text(A correlation co-efficient of 1 would mean that all data points)`
♦ Mean mark (c) 39%.
`text(points occur on the line of best fit which clearly isn’t the case.)`
Statistics, STD2 S5 2015 HSC 28b
The results of two tests are normally distributed. The mean and standard deviation for each test are displayed in the table.
\begin{array} {|l|c|c|}
\hline
\rule{0pt}{2.5ex} \rule[-1ex]{0pt}{0pt} & \text{Mathematics} & \quad \text{English} \quad \\
\hline
\rule{0pt}{2.5ex} \quad \mu \quad \rule[-1ex]{0pt}{0pt} & 70 & 75 \\
\hline
\rule{0pt}{2.5ex} \quad \sigma \rule[-1ex]{0pt}{0pt} & 6.5 & 8 \\
\hline
\end{array}
Kristoff scored 74 in Mathematics and 80 in English. He claims that he has performed better in English.
Is Kristoff correct? Justify your answer using appropriate calculations. (2 marks)
--- 4 WORK AREA LINES (style=lined) ---
Statistics, STD2 S1 2015 HSC 27d
In a small business, the seven employees earn the following wages per week:
\(\$300, \ \$490, \ \$520, \ \$590, \ \$660, \ \$680, \ \$970\)
- Is the wage of $970 an outlier for this set of data? Justify your answer with calculations. (3 marks)
--- 6 WORK AREA LINES (style=lined) ---
- Each employee receives a $20 pay increase.
What effect will this have on the standard deviation? (1 mark)
--- 2 WORK AREA LINES (style=lined) ---
Algebra, STD2 A2 2015 HSC 27c
Ariana’s parents have given her an interest‑free loan of $4800 to buy a car. She will pay them back by paying `$x` immediately and `$y` every month until she has repaid the loan in full.
After 18 months Ariana has paid back $1510, and after 36 months she has paid back $2770.
This information can be represented by the following equations.
`x + 18y = 1510`
`x + 36y = 2770`
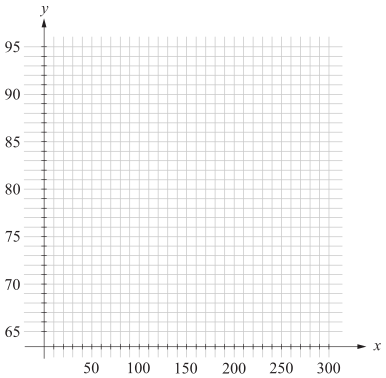
- Graph these equations below and use to solve simultaneously for the values of `x` and `y`. (2 marks)
--- 1 WORK AREA LINES (style=lined) ---
- How many months will it take Ariana to repay the loan in full? (2 marks)
--- 4 WORK AREA LINES (style=lined) ---
Show Worked Solution
i.
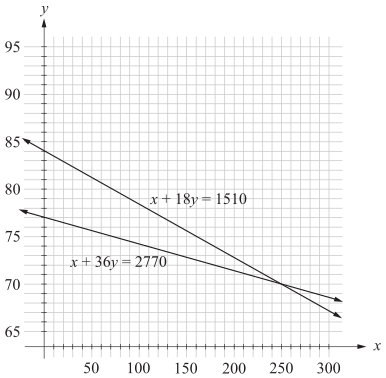
`:.\ text(Solution is)\ \ x = 250, \ y = 70`
ii. `text(Let)\ \ A = text(the amount paid back after)\ n\ text(months)`
`A = 250 + 70n`
♦ Mean mark 44%.
`text(Find)\ n\ text(when)\ A = 4800`
| `250 + 70n` | `= 4800` |
| `70n` | `= 4550` |
| `n` | `= 65` |
`:.\ text(It will take Ariana 65 months to repay)`
`text(the loan in full.)`
Probability, STD2 S2 2015 HSC 26e
The table shows the relative frequency of selecting each of the different coloured jelly beans from packets containing green, yellow, black, red and white jelly beans.
\begin{array} {|c|c|}
\hline
\rule{0pt}{2.5ex} \textit{Colour} \rule[-1ex]{0pt}{0pt} & \textit{Relative frequency} \\
\hline
\rule{0pt}{2.5ex} \text{Green} \rule[-1ex]{0pt}{0pt} & 0.32 \\
\hline
\rule{0pt}{2.5ex} \text{Yellow} \rule[-1ex]{0pt}{0pt} & 0.13 \\
\hline
\rule{0pt}{2.5ex} \text{Black} \rule[-1ex]{0pt}{0pt} & 0.14 \\
\hline
\rule{0pt}{2.5ex} \text{Red} \rule[-1ex]{0pt}{0pt} & \\
\hline
\rule{0pt}{2.5ex} \text{White} \rule[-1ex]{0pt}{0pt} & 0.24 \\
\hline
\end{array}
- What is the relative frequency of selecting a red jelly bean? (1 mark)
--- 2 WORK AREA LINES (style=lined) ---
- Based on this table of relative frequencies, what is the probability of NOT selecting a black jelly bean? (1 mark)
--- 2 WORK AREA LINES (style=lined) ---
Financial Maths, STD2 F4 2015 HSC 26d
A family currently pays $320 for some groceries.
Assuming a constant annual inflation rate of 2.9%, calculate how much would be paid for the same groceries in 5 years’ time. (2 marks)
Algebra, STD2 A1 2015 HSC 24 MC
Consider the equation `(2x)/3-4 = (5x)/2 + 1`.
Which of the following would be a correct step in solving this equation?
- `(2x)/3-3 = (5x)/2`
- `(2x)/3 = (5x)/2 + 5`
- `2x-4 = (15x)/2 + 3`
- `(4x)/6-8 = 5x + 2`
Statistics, STD2 S5 2015 HSC 20 MC
A machine produces cylindrical pipes. The mean of the diameters of the pipes is 8 cm and the standard deviation is 0.04 cm.
Assuming a normal distribution, what percentage of cylindrical pipes produced will have a diameter less than 7.96 cm?
- `text(16%)`
- `text(32%)`
- `text(34%)`
- `text(68%)`
Show Worked Solution
`mu = 8\ text(cm)\ \ \ s = 0.04\ text(cm)`
♦ Mean mark 50%.
`ztext{-score(7.96)}= (x-mu)/sigma= (7.96-8)/0.04=-1`

`:.\ text(% of pipes with a diameter less than 7.96 cm.)`
`=\ text(50%)-text(34%)`
`=\ text(16%)`
`=>A`
Statistics, STD2 S1 2015 HSC 19 MC
The table shows the life expectancy (expected remaining years of life) for females at selected ages in the given periods of time.

In 1975, a 45‑year‑old female used the information in the table to calculate the age to which she was expected to live. Twenty years later she recalculated the age to which she was expected to live.
What is the difference between the two ages she calculated?
- 2.7 years
- 3.1 years
- 3.7 years
- 5.8 years
Financial Maths, STD2 F4 2015 HSC 17 MC
What amount must be invested now at 4% per annum, compounded quarterly, so that in five years it will have grown to `$60\ 000`?
- `$8919`
- `$11 156`
- `$49\ 173`
- `$49\ 316`
Statistics, STD2 S1 2015 HSC 6 MC
The times, in minutes, that a large group of students spend on exercise per day are presented in the box‑and‑whisker plot.

What percentage of these students spend between 40 minutes and 60 minutes per day on exercise?
- 17%
- 20%
- 25%
- 50%
Statistics, STD2 S1 2015 HSC 4 MC
On a school report, a student’s record of completing homework is graded using the following codes.
C = consistently
U = usually
S = sometimes
R = rarely
N = never
What type of data is this?
- Categorical, ordinal
- Categorical, nominal
- Numerical, continuous
- Numerical, discrete
Functions, 2ADV F1 2015 HSC 2 MC
What is the slope of the line with equation `2x-4y + 3 = 0`?
- `-2`
- `-1/2`
- `1/2`
- `2`
Trigonometry, 2ADV T1 2004 HSC 3c

The diagram shows a point `P` which is 30 km due west of the point `Q`.
The point `R` is 12 km from `P` and has a bearing from `P` of 070°.
- Find the distance of `R` from `Q`. (2 marks)
--- 4 WORK AREA LINES (style=lined) ---
- Find the bearing of `R` from `Q`. (2 marks)
--- 4 WORK AREA LINES (style=lined) ---
Show Worked Solution
i. `text(Join)\ \ RQ\ \ text(to form)\ \ Delta RPQ`

`/_RPQ = 90-70 = 20^@`
`text(Using the cosine rule:)`
| `RQ^2` | `= PR^2 + PQ^2-2 xx PR xx PQ xx cos /_RPQ` |
| `= 12^2 + 30^2-2 xx 12 xx 30 xx cos 20^@` | |
| `= 367.421…` | |
| `RQ` | `= 19.168…= 19.2\ text(km)\ \ text{(1 d.p.)}` |
ii. `text(Using sine rule:)`
| `(sin /_RQP)/12` | `= (sin 20^@)/(19.168…)` |
| `sin/_RQP` | `= (12 xx sin 20^@)/(19.168…)= 0.214…` |
| `/_RQP` | `= 12.36…^@= 12^@\ \ \ text{(nearest degree)}` |
`:.\ text(Bearing of)\ R\ text(from)\ Q`
`=270+12`
`=282^@`
Statistics, STD2 S4 2006 HSC 27b
Each member of a group of males had his height and foot length measured and recorded. The results were graphed and a line of fit drawn.
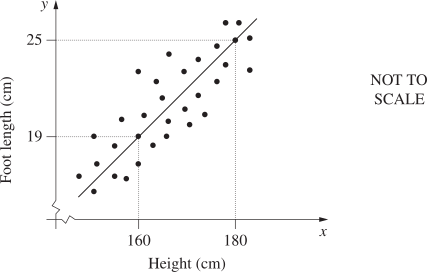
- Why does the value of the `y`-intercept have no meaning in this situation? (1 mark)
--- 2 WORK AREA LINES (style=lined) ---
- George is 10 cm taller than his brother Harry. Use the line of fit to estimate the difference in their foot lengths. (1 mark)
--- 2 WORK AREA LINES (style=lined) ---
- Sam calculated a correlation coefficient of −1.2 for the data. Give TWO reasons why Sam must be incorrect. (2 marks)
--- 5 WORK AREA LINES (style=lined) ---
Probability, STD2 S2 2006 HSC 26c
A new test has been developed for determining whether or not people are carriers of the Gaussian virus.
Two hundred people are tested. A two-way table is being used to record the results.
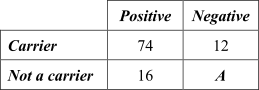
- What is the value of `A`? (1 mark)
--- 1 WORK AREA LINES (style=lined) ---
- A person selected from the tested group is a carrier of the virus.
- What is the probability that the test results would show this? (2 marks)
--- 4 WORK AREA LINES (style=lined) ---
- For how many of the people tested were their test results inaccurate? (1 mark)
--- 2 WORK AREA LINES (style=lined) ---
Functions, 2ADV F1 2005 HSC 1d
Express `((2x-3))/2-((x-1))/5` as a single fraction in its simplest form. (2 marks)
--- 5 WORK AREA LINES (style=lined) ---
Algebra, STD2 A4 2005 HSC 28b
Sue and Mikey are planning a fund-raising dance. They can hire a hall for $400 and a band for $300. Refreshments will cost them $12 per person.
- Write a formula for the cost ($C) of running the dance for `x` people. (1 mark)
--- 2 WORK AREA LINES (style=lined) ---
The graph shows planned income and costs when the ticket price is $20.

- Estimate the minimum number of people needed at the dance to cover the costs. (1 mark)
--- 1 WORK AREA LINES (style=lined) ---
- How much profit will be made if 150 people attend the dance? (1 mark)
--- 2 WORK AREA LINES (style=lined) ---
Sue and Mikey plan to sell 200 tickets. They want to make a profit of $1500.
- What should be the price of a ticket, assuming all 200 tickets will be sold? (3 marks)
--- 6 WORK AREA LINES (style=lined) ---
Statistics, STD2 S1 2005 HSC 27d
Nine students were selected at random from a school, and their ages were recorded.
\begin{array} {|c|}
\hline
\rule{0pt}{2.5ex} \textbf{Ages} \rule[-1ex]{0pt}{0pt} \\
\hline
\rule{0pt}{2.5ex} \ \ \ \text{12 11 16} \ \ \ \rule[-1ex]{0pt}{0pt} \\ \rule{0pt}{2.5ex} \text{14 16 15} \rule[-1ex]{0pt}{0pt} \\ \rule{0pt}{2.5ex} \text{14 15 14} \rule[-1ex]{0pt}{0pt} \\
\hline
\end{array}
- What is the sample standard deviation, correct to two decimal places? (2 marks)
--- 4 WORK AREA LINES (style=lined) ---
- Briefly explain what is meant by the term standard deviation. (1 mark)
--- 2 WORK AREA LINES (style=lined) ---
Measurement, STD2 M6 2005 HSC 27c
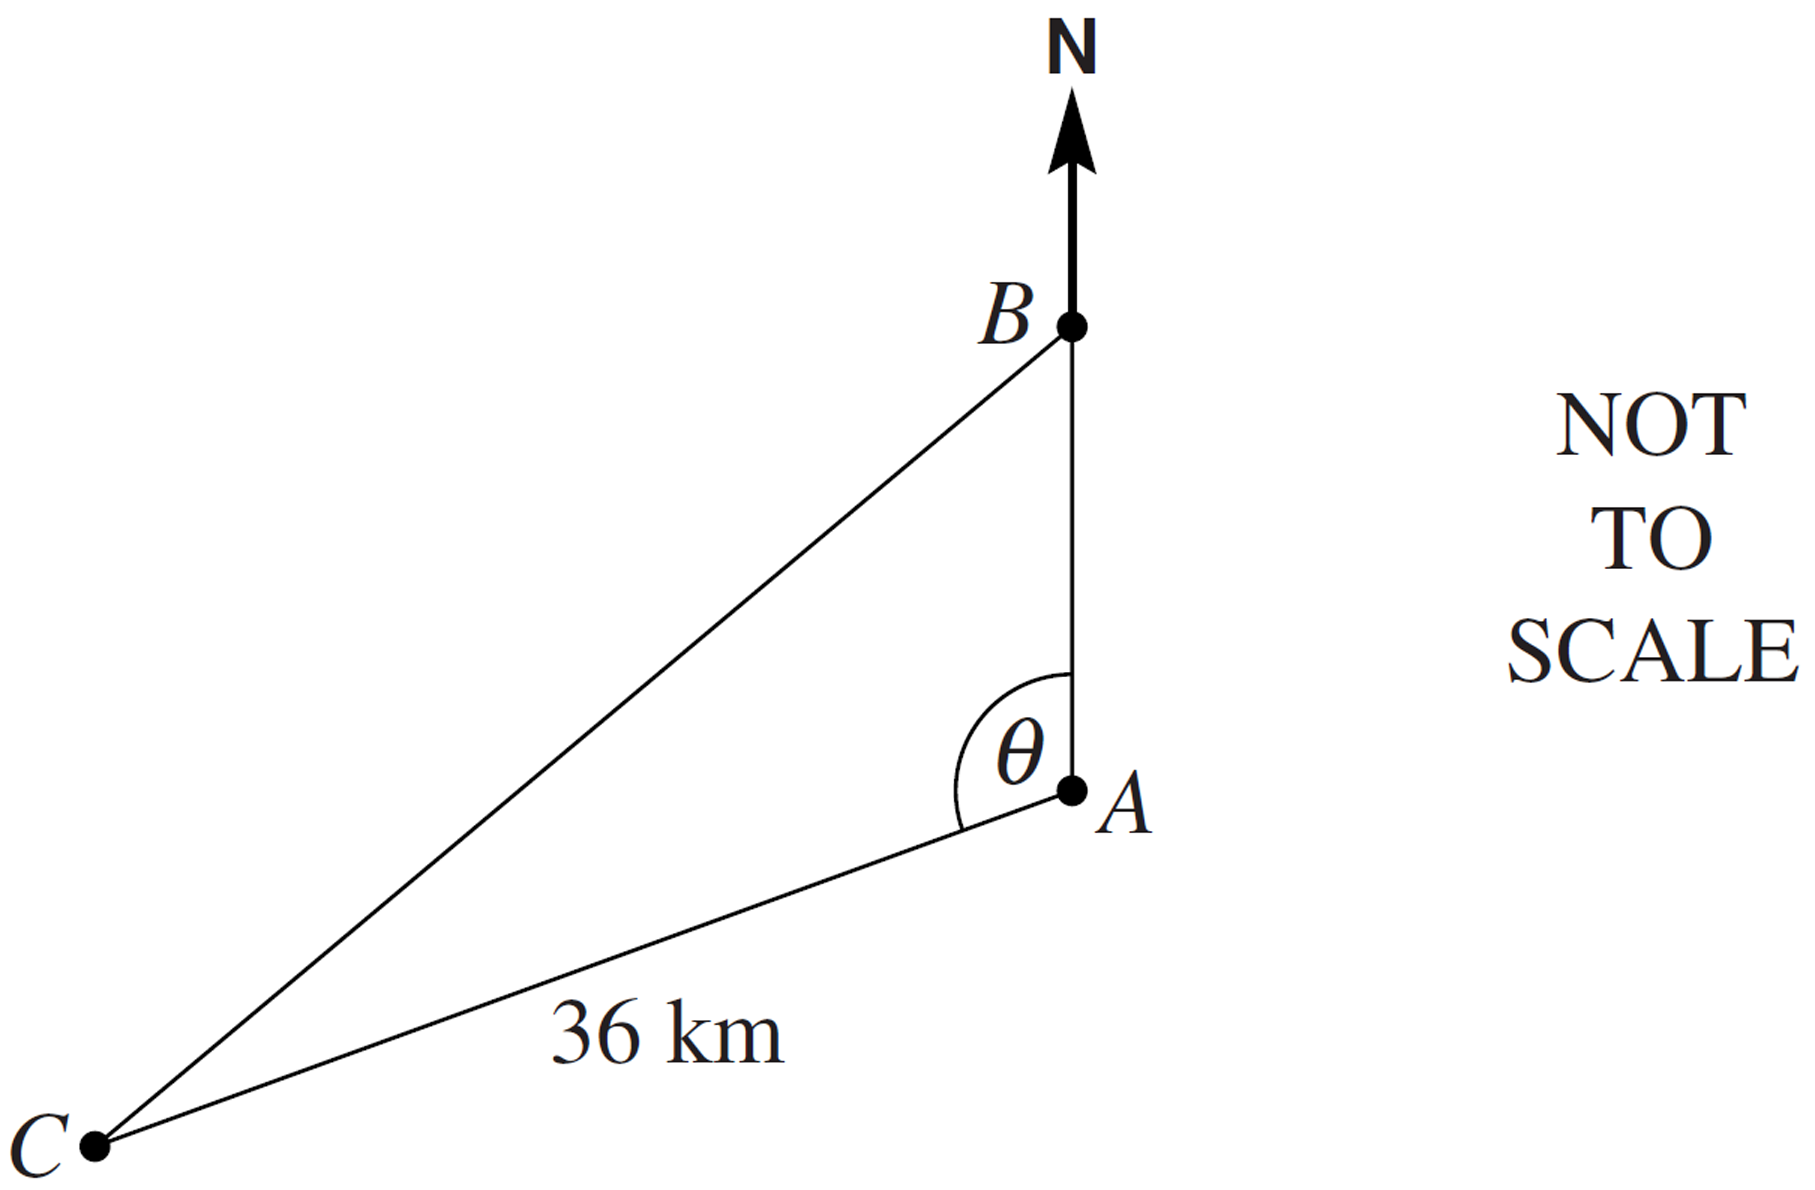
The bearing of `C` from `A` is 250° and the distance of `C` from `A` is 36 km.
- Explain why `theta` is 110°. (1 mark)
--- 2 WORK AREA LINES (style=lined) ---
- If `B` is 15 km due north of `A`, calculate the distance of `C` from `B`, correct to the nearest kilometre. (3 marks)
--- 6 WORK AREA LINES (style=lined) ---
Show Worked Solution
a. `text(There is 360° about point)\ A`
| `:.theta + 250^@` | `= 360^@` |
| `theta` | `= 110^@` |
| b. | 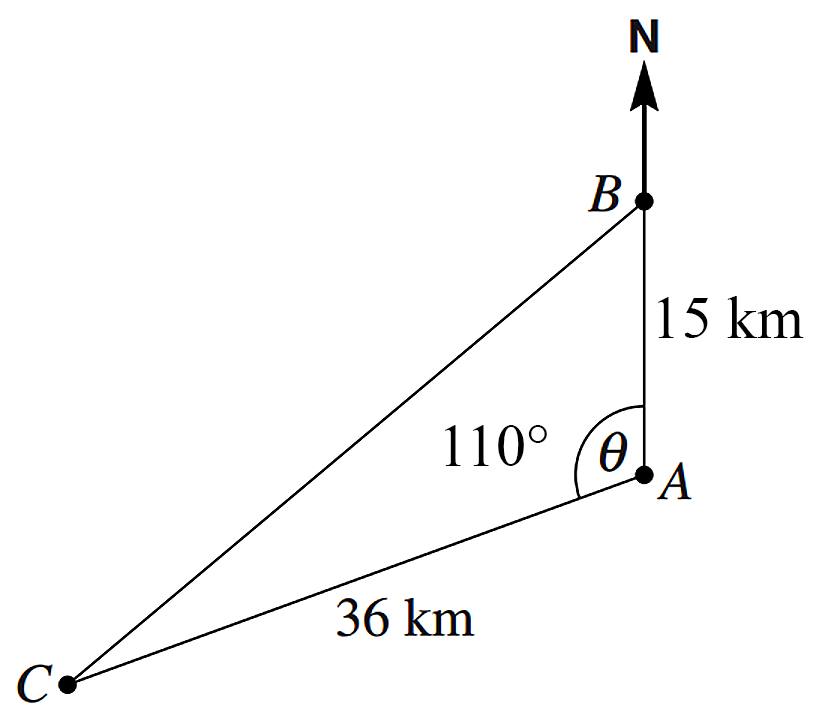 |
| `a^2` | `= b^2 + c^2-2ab\ cos\ A` |
| `CB^2` | `= 36^2 + 15^2-2 xx 36 xx 15 xx cos\ 110^@` |
| `= 1296 + 225-(-369.38…)` | |
| `= 1890.38…` | |
| `:.CB` | `= 43.47…` |
| `= 43\ text{km (nearest km)}` |
Statistics, STD2 S5 2005 HSC 26c
The weights of boxes of Brekky Bicks are normally distributed. The mean is 754 grams and the standard deviation is 2 grams.
- What is the `z`-score of a box of Brekky Bicks with a weight of 754 g? (1 mark)
--- 2 WORK AREA LINES (style=lined) ---
- What is the weight of a box that has a `z`-score of –1? (1 mark)
--- 2 WORK AREA LINES (style=lined) ---
- Brekky Bicks boxes are labelled as having a weight of 750 g. What percentage of boxes will have a weight less than 750 g? (2 marks)
--- 4 WORK AREA LINES (style=lined) ---
Show Worked Solution
a. `text{z-score (754 g) = 0 (754 g is the mean)}`
| b. `ztext(-score)` | `= (x-mu)/sigma` |
| `-1` | `= (x-754)/2` |
| `x-754` | `= -2` |
| `x` | `= 752\ text(grams)` |
c. `text{z-score (750)= (750-754)/2= -2`

`:.\ text(Graph shows that 2.5% of boxes will weigh less than 750 g.)`
Financial Maths, STD2 F5 2005 HSC 26b
Rod is saving for a holiday. He deposits $3600 into an account at the end of every year for four years. The account pays 5% per annum interest, compounding annually.
The table shows future values of an annuity of $1.

- Use the table to find the value of Rod’s investment at the end of four years. (2 marks)
--- 4 WORK AREA LINES (style=lined) ---
- How much interest does Rod earn on his investment over the four years? (2 marks)
--- 4 WORK AREA LINES (style=lined) ---
Statistics, STD2 S1 2006 HSC 23c
Vicki wants to investigate the number of hours spent on homework by students at her high school.
- Briefly describe a valid method of randomly selecting 200 students for a sample. (1 mark)
--- 2 WORK AREA LINES (style=lined) ---
- Vicki chooses her sample and asks each student how many hours (to the nearest hour) they usually spend on homework during one week.
The responses are shown in the frequency table.
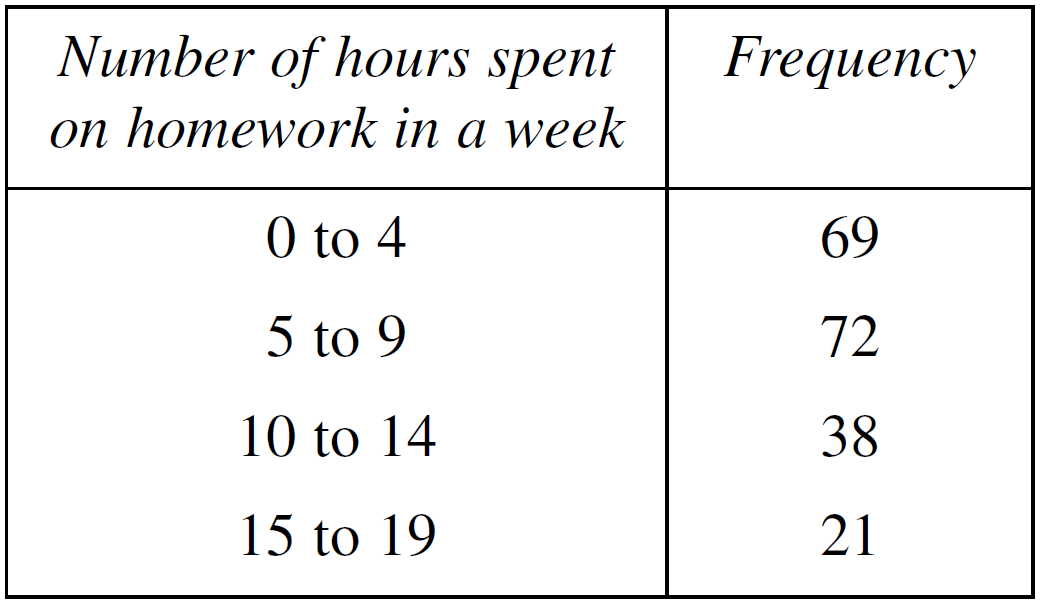
What is the mean amount of time spent on homework? (2 marks)
--- 4 WORK AREA LINES (style=lined) ---
Show Worked Solution
a. `text(A valid method would be using a stratified sample.)`
`text(The number of students sampled in each year is)`
`text(proportional to the size of each year.)`
MARKER’S COMMENT: This “routine” exercise of finding a mean from grouped data was incorrectly answered by most students! The best responses copied the table and inserted a class-centre column (see solution).
| b. |  |
`text(Mean)= text(Sum of Scores) / text(Total scores)= 1455/200= 7.275\ text(hours)`
Statistics, STD2 S1 2006 HSC 24c
The heights of the 60 members of a choir were recorded. These results were grouped and then displayed as a cumulative frequency histogram and polygon.
The shortest person in the choir is 140 cm and the tallest is 190 cm.

Draw an accurate box-and-whisker plot to represent the data. (3 marks)
--- 8 WORK AREA LINES (style=lined) ---
Show Worked Solution
`text(Low) = 140`
`text(High) = 190`
`text(Median) = 150\ \ \ \ text{(# People = 30)}`
`Q_1 = 145\ \ \ \ text{(# People = 15)}`
`Q_3 = 170\ \ \ \ text{(# People = 45)}`
`text(Box and Whisker)`

Statistics, STD2 S1 2006 HSC 24a

List TWO ways in which this graph is misleading. (2 marks)
--- 4 WORK AREA LINES (style=lined) ---
Statistics, STD2 S1 2005 HSC 24d
The sector graph shows the proportion of people, as a percentage, living in each region of Sumcity. There are 24 000 people living in the Eastern Suburbs.

- Show that the total number of people living in Sumcity is 160 000. (1 mark)
--- 1 WORK AREA LINES (style=lined) ---
Jake used the information above to draw a column graph.

- The column graph height is incorrect for one region.
Identify this region and justify your answer. (2 marks)
--- 4 WORK AREA LINES (style=lined) ---
Statistics, STD2 S1 2005 HSC 24a
- Draw a stem-and-leaf plot for the following set of scores.
-
`21\ \ \ 45\ \ \ 29\ \ \ 27\ \ \ 19\ \ \ 35\ \ \ 23\ \ \ 58\ \ \ 34\ \ \ 27` (2 marks)
--- 6 WORK AREA LINES (style=blank) ---
- What is the median of the set of scores? (1 mark)
--- 2 WORK AREA LINES (style=lined) ---
- Comment on the skewness of the set of scores. (1 mark)
--- 2 WORK AREA LINES (style=lined) ---
Show Answers Only
Show Worked Solution
| a. |  |
b. `text(10 scores)`
| `:.\ text(Median)` | `= text{(5th + 6th)}/2` |
| `= (27 + 29)/2= 28` |
c. `text(The data has a tail that stretches to the right)`
`:.\ text(Data is positively skewed.)`
Algebra, STD2 A4 2004 HSC 26a
- The number of bacteria in a culture grows from 100 to 114 in one hour.
What is the percentage increase in the number of bacteria? (1 mark)
--- 1 WORK AREA LINES (style=lined) ---
- The bacteria continue to grow according to the formula `n = 100(1.14)^t`, where `n` is the number of bacteria after `t` hours.
What is the number of bacteria after 15 hours? (1 mark)
\begin{array} {|l|c|}
\hline
\rule{0pt}{2.5ex} \text{Time in hours $(t)$} \rule[-1ex]{0pt}{0pt} & \;\; 0 \;\; & \;\; 5 \;\; & \;\; 10 \;\; & \;\; 15 \;\; \\
\hline
\rule{0pt}{2.5ex} \text{Number of bacteria ( $n$ )} \rule[-1ex]{0pt}{0pt} & \;\; 100 \;\; & \;\; 193 \;\; & \;\; 371 \;\; & \;\; ? \;\; \\
\hline
\end{array}
--- 1 WORK AREA LINES (style=lined) ---
- Use the values of `n` from `t = 0` to `t = 15` to draw a graph of `n = 100(1.14)^t`.
Use about half a page for your graph and mark a scale on each axis. (4 marks)
--- 10 WORK AREA LINES (style=lined) ---
- Using your graph or otherwise, estimate the time in hours for the number of bacteria to reach 300. (1 mark)
--- 1 WORK AREA LINES (style=lined) ---
Show Worked Solution
a. `text(Percentage increase)`COMMENT: Common ADV/STD2 content in new syllabus.
`= (114-100)/100 xx 100`
`= 14text(%)`
b. `n = 100(1.14)^t`
`text(When)\ \ t = 15,`
| `n` | `= 100(1.14)^15` |
| `= 713.793\ …` | |
| `= 714\ \ \ text{(nearest whole)}` |
| c. |  |
d. `text(Using the graph:)`
`text(The number of bacteria reaches 300 after approximately 8.4 hours.)`
Statistics, STD2 S1 2005 HSC 22 MC
Two groups of people were surveyed about their weekly wages. The results are shown in the box-and-whisker plots.
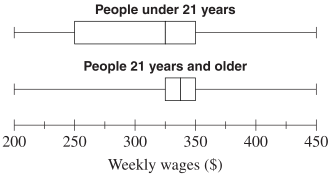
Which of the following statements is true for the people surveyed?
- The same percentage of people in each group earned more than $325 per week.
- Approximately 75% of people under 21 years earned less than $350 per week.
- Approximately 75% of people 21 years and older earned more than $350 per week.
- Approximately 50% of people in each group earned between $325 and $350 per week.
Probability, STD2 S2 2005 HSC 16 MC
On a television game show, viewers voted for their favourite contestant. The results were recorded in the two-way table.
\begin{array} {|l|c|c|}
\hline
\rule{0pt}{2.5ex} \rule[-1ex]{0pt}{0pt} & \textbf{Male viewers} & \textbf{Female viewers} \\
\hline
\rule{0pt}{2.5ex}\textbf{Contestant 1}\rule[-1ex]{0pt}{0pt} & 1372 & 3915\\
\hline
\rule{0pt}{2.5ex}\textbf{Contestant 2}\rule[-1ex]{0pt}{0pt} & 2054 & 3269\\
\hline
\end{array}
One male viewer was selected at random from all of the male viewers.
What is the probability that he voted for Contestant 1?
- `1372/(10\ 610)`
- `1372/5287`
- `1372/3426`
- `1372/2054`
Statistics, STD2 S1 2005 HSC 9 MC
A set of data is represented by the cumulative frequency histogram and ogive.

What is the best approximation for the interquartile range for this set of data?
- 25
- 30
- 35
- 40
Show Worked Solution

`IQR= Q3-Q1= 80-45= 35`
`=> C`
Probability, STD2 S2 2004 HSC 25c
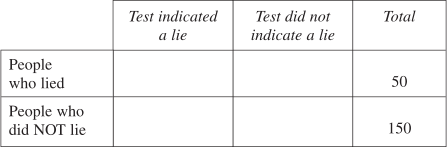
Lie detector tests are not always accurate. A lie detector test was administered to 200 people.
The results were:
• 50 people lied. Of these, the test indicated that 40 had lied;
• 150 people did NOT lie. Of these, the test indicated that 20 had lied.
- Complete the table using the information above. (2 marks)
--- 0 WORK AREA LINES (style=lined) ---
- For how many of the people tested was the lie detector test accurate? (1 mark)
--- 2 WORK AREA LINES (style=lined) ---
- For what percentage of the people tested was the test accurate? (1 mark)
--- 2 WORK AREA LINES (style=lined) ---
- What is the probability that the test indicated a lie for a person who did NOT lie? (1 mark)
--- 2 WORK AREA LINES (style=lined) ---
Show Worked Solution
a.
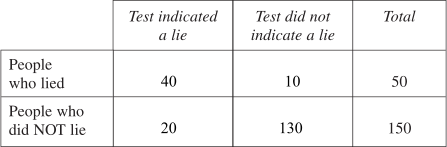
b. `text(# Accurate readings) = 40 + 130 = 170`
c. `text(Percentage of people with accurate readings)`
`= text(# Accurate readings)/text(Total readings) xx 100`
`= 170/200= 85 text(%)`
d. `text{P(lie detected when NOT a lie)} = 20/150= 2/15`
Statistics, STD2 S5 2004 HSC 24c
The normal distribution shown has a mean of 170 and a standard deviation of 10.
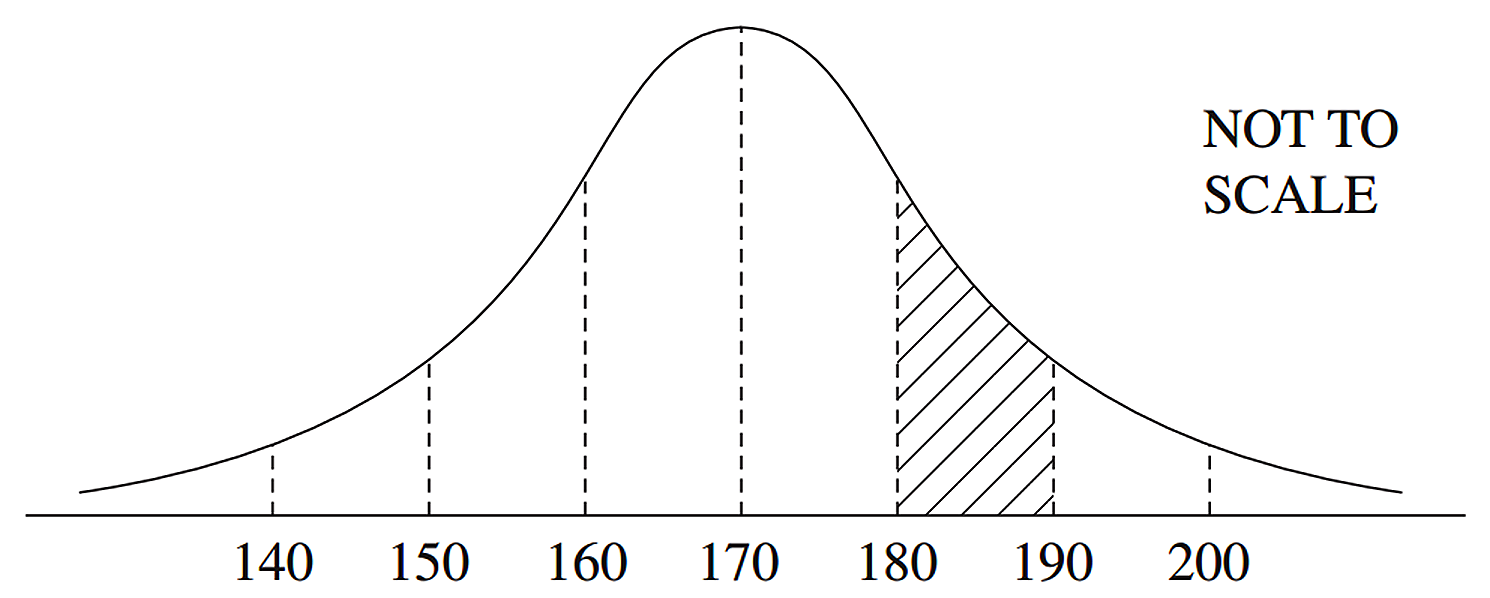
- Roberto has a raw score in the shaded region. What could his `z`-score be? (1 mark)
--- 1 WORK AREA LINES (style=lined) ---
- What percentage of the data lies in the shaded region? (2 marks)
--- 4 WORK AREA LINES (style=lined) ---
Show Worked Solution
a. `ztext{-score(180)}= (x-mu)/sigma= (180-170)/10= 1`
`ztext{-score(190)}= (190-170)/10= 2`
`:. 1 <= ztext(-score) <= 2`
| b. | 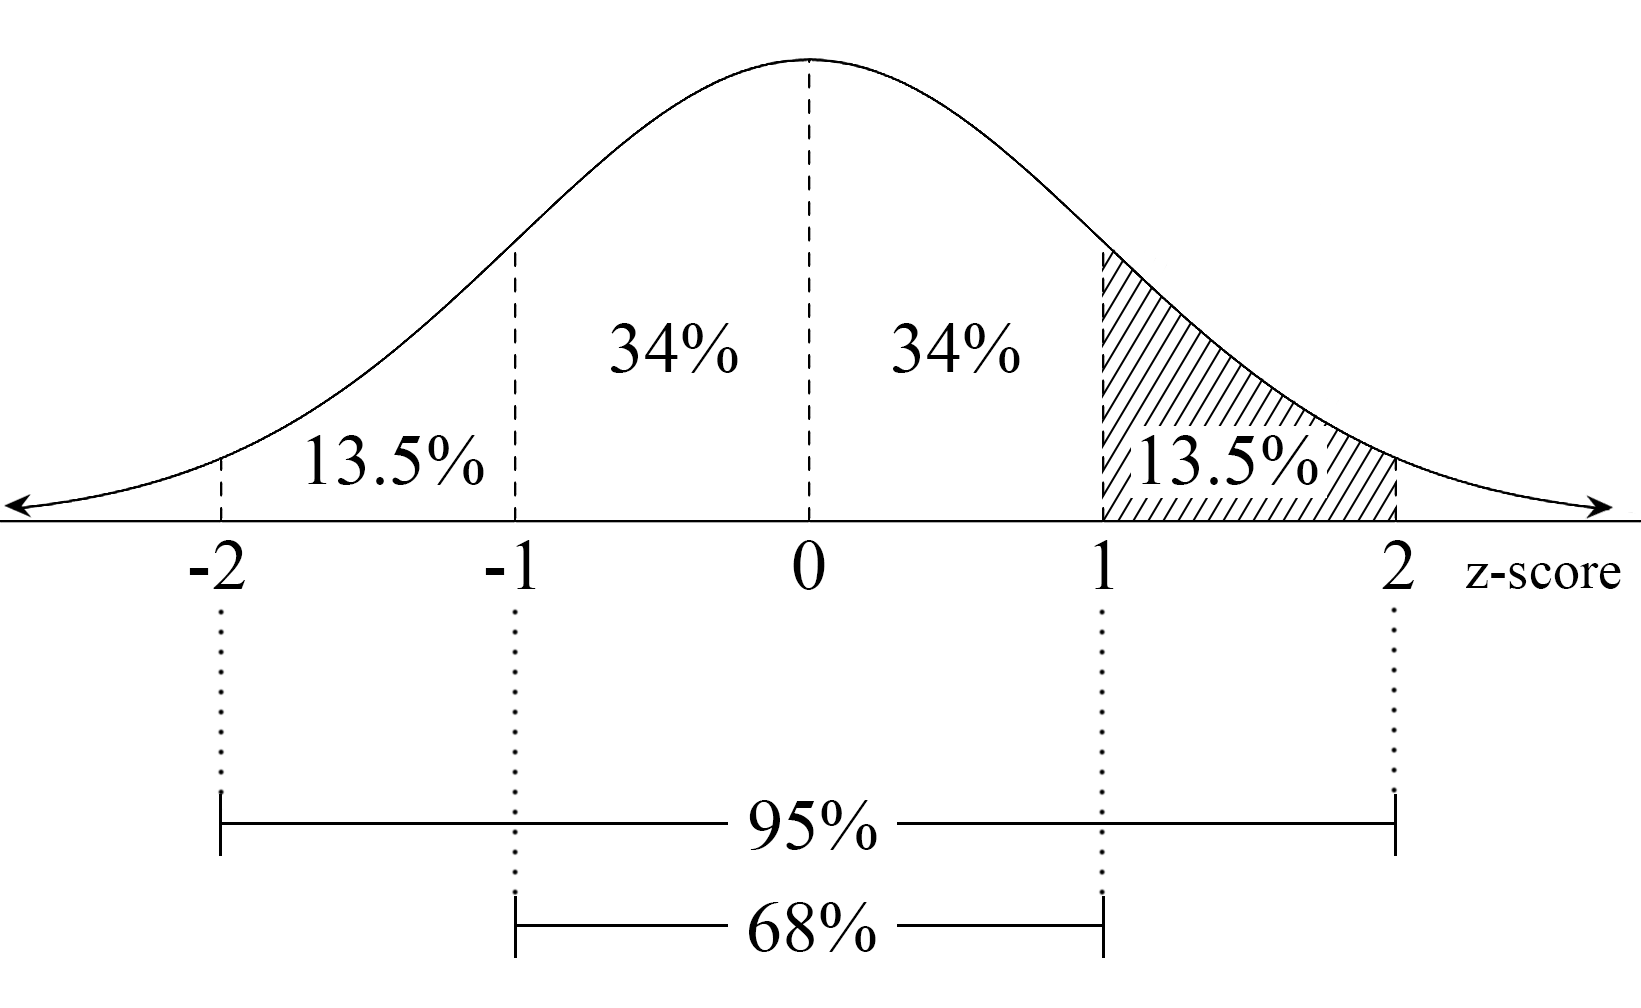 |
`text(From the graph above:)`
`text(13.5% lies in the shaded area.)`
Statistics, STD2 S5 2006 HSC 17 MC
In a normally distributed set of scores, the mean is 23 and the standard deviation is 5.
Approximately what percentage of the scores will lie between 18 and 33?
- `text(34%)`
- `text(47.5%)`
- `text(68%)`
- `text(81.5%)`
Show Worked Solution
`mu = 23`
`sigma = 5`
| `z text{-score (18)}` | `= (x-mu)/sigma` |
| `= (18-23)/5=-1` | |
| `z text{-score (33)}` | `= (33-23)/5= 2` |
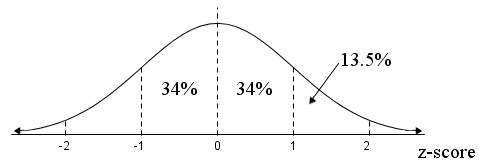
`:.\ text(Percentage between –1 and 2)`
`= 34 + 34 + 13.5=\ text(81.5%)`
`=> D`
Measurement, STD2 M6 2006 HSC 13 MC
What is the bearing of `A` from `B`?

- `060°`
- `120°`
- `150°`
- `300°`
Show Worked Solution

`text(Bearing of)\ A\ text(from)\ B`
`= 180 +120= 300^@`
`=> D`
Statistics, STD2 S1 2006 HSC 12 MC
The mean of a set of 5 scores is 62.
What is the new mean of the set of scores after a score of 14 is added?
- 38
- 54
- 62
- 76
Statistics, STD2 S1 2006 HSC 8 MC
Which of these graphs best represents positively skewed data with the smaller standard deviation?


Functions, 2ADV F1 2004 HSC 1c
Solve `(x-5)/3-(x+1)/4 = 5`. (2 marks)
Probability, STD2 S2 2006 HSC 6 MC
Marcella is planning to roll a standard six-sided die 60 times.
How many times would she expect to roll the number 4?
- 6
- 10
- 15
- 20
Statistics, STD2 S1 2006 HSC 4 MC
A set of scores is displayed in a stem-and-leaf plot.

What is the median of this set of scores?
- 28
- 30
- 33
- 47
Statistics, STD2 S1 2005 HSC 1 MC
What is the mean of the set of scores?
`3, \ 4, \ 5, \ 6, \ 6, \ 8, \ 8, \ 8, \ 15`
- 6
- 7
- 8
- 9
Statistics, STD2 S1 2004 HSC 12 MC
This box-and-whisker plot represents a set of scores.
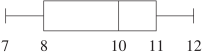
What is the interquartile range of this set of scores?
- 1
- 2
- 3
- 5
Statistics, STD2 S1 2004 HSC 8 MC
This sector graph shows the distribution of 116 prizes won by three schools: `X, Y and Z`.

How many prizes were won by School `X`?
- 26
- 32
- 81
- 99
Statistics, STD2 S1 2004 HSC 6-7 MC
Use the set of scores 1, 3, 3, 3, 4, 5, 7, 7, 12 to answer Questions 6 and 7.
Question 6
What is the range of the set of scores?
- 6
- 9
- 11
- 12
Question 7
What are the median and the mode of the set of scores?
- Median 3, mode 5
- Median 3, mode 3
- Median 4, mode 5
- Median 4, mode 3
Statistics, STD2 S5 EQ-Bank 5 MC
The length of a type of ant is approximately normally distributed with a mean of 4.8 mm and a standard deviation of `1.2` mm.
A standardised ant length of `z = -0.5` corresponds to an actual ant length of
- ` text(2.4 mm)`
- `text(3.6 mm)`
- `text(4.2 mm)`
- `text(5.4 mm)`
Statistics, STD2 S5 EQ-Bank 11 MC
The time, in hours, that each student spent sleeping on a school night was recorded for 1550 secondary-school students. The distribution of these times was found to be approximately normal with a mean of 7.4 hours and a standard deviation of 0.7 hours.
How many students would you expect to spend more than 8.1 hours sleeping on a school night?
You may assume for normally distributed data that:
-
- 68% of scores have `z`-scores between `-1` and `1`
- 95% of scores have `z`-scores between `-2` and `2`
- 99.7% of scores have `z`-scores between `-3` and `3`.
- `16`
- `248`
- `1302`
- `1510`
Algebra, STD2 A2 2007 HSC 27b
A clubhouse uses four long-life light globes for five hours every night of the year. The purchase price of each light globe is $6.00 and they each cost `$d` per hour to run.
- Write an equation for the total cost (`$c`) of purchasing and running these four light globes for one year in terms of `d`. (2 marks)
--- 4 WORK AREA LINES (style=lined) ---
- Find the value of `d` (correct to three decimal places) if the total cost of running these four light globes for one year is $250. (1 mark)
--- 2 WORK AREA LINES (style=lined) ---
- If the use of the light globes increases to ten hours per night every night of the year, does the total cost double? Justify your answer with appropriate calculations. (1 mark)
--- 2 WORK AREA LINES (style=lined) ---
- The manufacturer’s specifications state that the expected life of the light globes is normally distributed with a standard deviation of 170 hours.
What is the mean life, in hours, of these light globes if 97.5% will last up to 5000 hours? (1 mark)
--- 2 WORK AREA LINES (style=lined) ---
Show Worked Solution
a. `text(Purchase price) = 4 xx 6 = $24`
| `text(Running cost)` | `= text(# Hours) xx text(Cost per hour)` |
| `= 4 xx 5 xx 365 xx d= 7300d` |
`:.\ $c = 24 + 7300d`
b. `text(Given)\ \ $c = $250:`
| `250` | `= 24 + 7300d` |
| `7300d` | `= 226` |
| `d` | `= 226/7300= 0.03095…= 0.031\ $ text(/hr)\ text{(3 d.p.)}` |
c. `text(If)\ d\ text(doubles to 0.062)\ \ $text(/hr)`
`$c= 24 + 7300 xx 0.062= $476.60`
`text(S) text(ince $476.60 is less than)\ 2 xx $250\ ($500),`
`text(the total cost increases to less than double)`
`text(the original cost.)`
d. `sigma = 170`

`z\ text(-score of 5000 hours) = 2`
| `z` | `= (x-mu)/sigma` |
| `2` | `= (5000-mu)/170` |
| `340` | `= 5000-mu` |
| `mu` | `= 4660` |
`:.\ text(The mean life of these globes is 4660 hours.)`
Measurement, STD2 M6 2007 HSC 26a
The diagram shows information about the locations of towns `A`, `B` and `Q`.
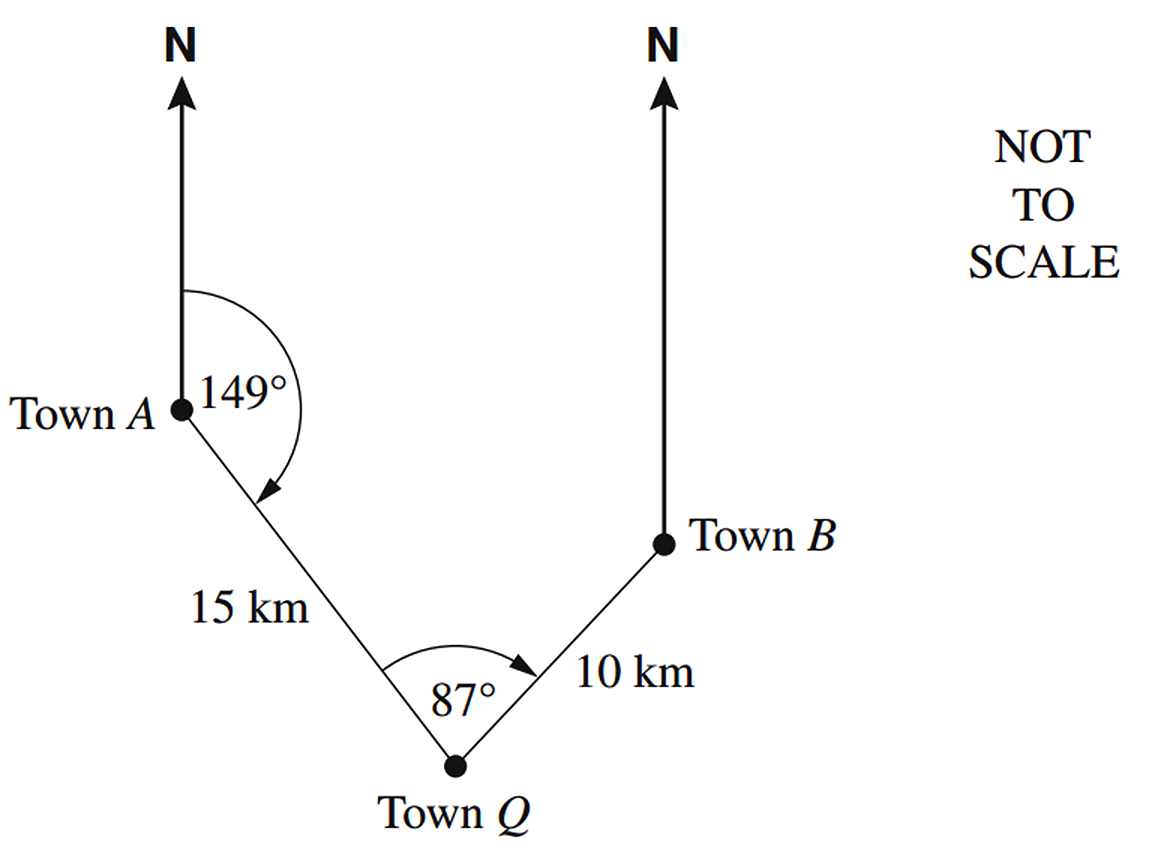
- It takes Elina 2 hours and 48 minutes to walk directly from Town `A` to Town `Q`.
Calculate her walking speed correct to the nearest km/h. (1 mark)
--- 1 WORK AREA LINES (style=lined) ---
- Elina decides, instead, to walk to Town `B` from Town `A` and then to Town `Q`.
Find the distance from Town `A` to Town `B`. Give your answer to the nearest km. (2 marks)
--- 4 WORK AREA LINES (style=lined) ---
- Calculate the bearing of Town `Q` from Town `B`. (1 mark)
--- 2 WORK AREA LINES (style=lined) ---
Show Worked Solution
a. `text(2 hrs 48 mins) = 168\ text(mins)`
| `text(Speed)\ text{(} A\ text(to)\ Q text{)}` | `= 15/168` |
| `= 0.0892…\ text(km/min)` |
| `text(Speed)\ text{(in km/hr)}` | `= 0.0892… xx 60` |
| `= 5.357…\ text(km/hr)` | |
| `= 5\ text(km/hr)\ text{(nearest km/hr)}` |
| b. | 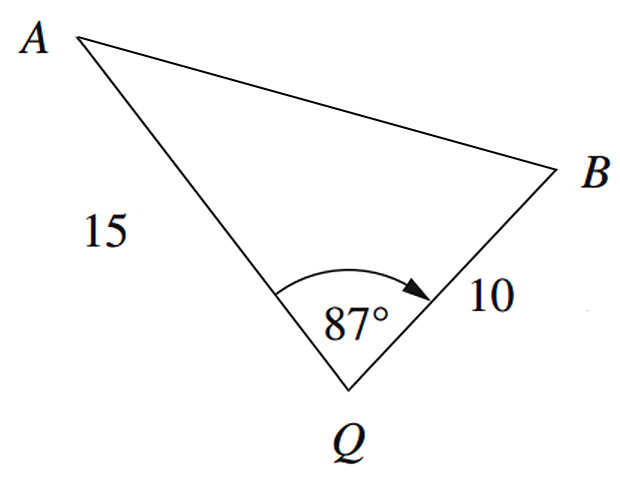 |
`text(Using cosine rule)`
| `AB^2` | `= 15^2 + 10^2-2 xx 15 xx 10 xx cos 87^@` |
| `= 309.299…` | |
| `AB` | `= 17.586…= 18\ text(km)\ text{(nearest km)}` |
`:.\ text(The distance from Town)\ A\ text(to Town)\ B\ text(is 18 km.)`
| c. | 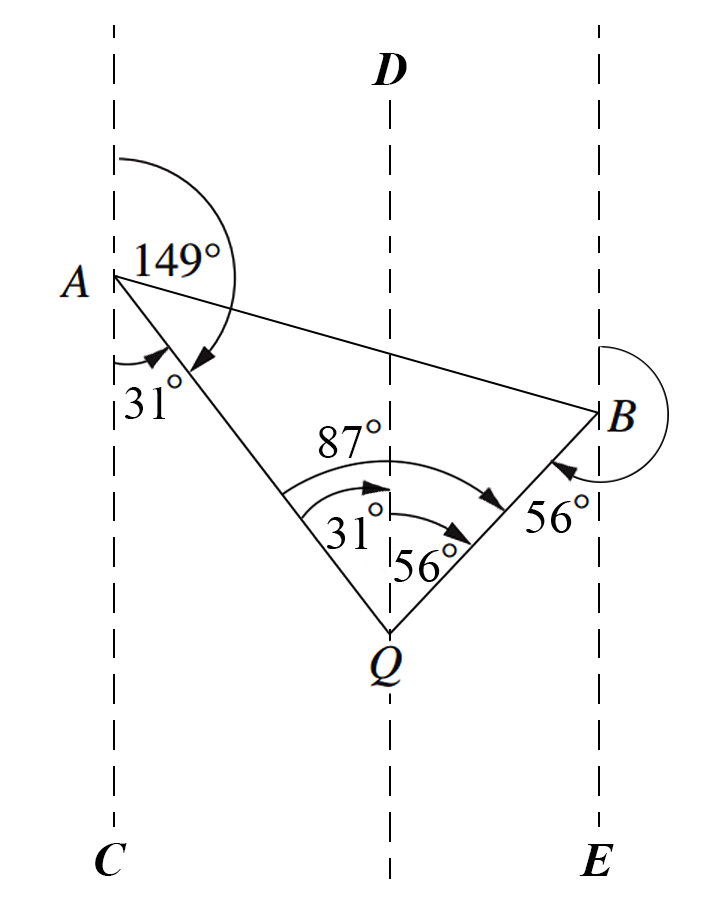 |
| `/_CAQ` | `= 31^@\ \ \ text{(} text(straight angle at)\ A text{)}` |
| `/_AQD` | `= 31^@\ \ \ text{(} text(alternate angle)\ AC\ text(||)\ DQ text{)}` |
| `/_DQB` | `= 87-31 = 56^@` |
| `/_QBE` | `= 56^@\ \ \ text{(} text(alternate angle)\ DQ \ text(||)\ BE text{)}` |
`:.\ text(Bearing of)\ Q\ text(from)\ B`
`= 180 + 56= 236^@`
Statistics, STD2 S5 2007 HSC 25d
The results of two class tests are normally distributed. The means and standard deviations of the tests are displayed in the table.
\begin{array} {|l|c|c|}
\hline
\rule{0pt}{2.5ex} \rule[-1ex]{0pt}{0pt} & \quad \text{Test 1} \quad & \quad \text{Test 2} \quad \\
\hline
\rule{0pt}{2.5ex} \text{Mean} \rule[-1ex]{0pt}{0pt} & 60 & 58 \\
\hline
\rule{0pt}{2.5ex} \text{Standard Deviation} \rule[-1ex]{0pt}{0pt} & 6.2 & 6.0 \\
\hline
\end{array}
- Stuart scored 63 in Test 1 and 62 in Test 2. He thinks that he has performed better in Test 1. Do you agree? Justify your answer using appropriate calculations. (2 marks)
--- 5 WORK AREA LINES (style=lined) ---
- If 150 students sat for Test 2, how many students would you expect to have scored less than 64? (2 marks)
--- 4 WORK AREA LINES (style=lined) ---
Show Worked Solution
a. `text(In Test 1:)\ \ mu = 60,\ sigma = 6.2`
`z text(-score)\ (63)= (x-mu)/sigma= (63-60)/6.2= 0.483…`
`text(In Test 2:)\ \ mu = 58,\ sigma = 6.0`
`z text(-score)\ (62)= (62-58)/6.0=0.666…`
`text(S) text(ince Stuart’s)\ z\ text(-score is higher in Test 2, his performance relative)`
`text(to the class is better despite his mark being slightly lower.)`
b. `text(In Test 2:)`
`z text(-score)\ (64)= (64-58)/6= 1`
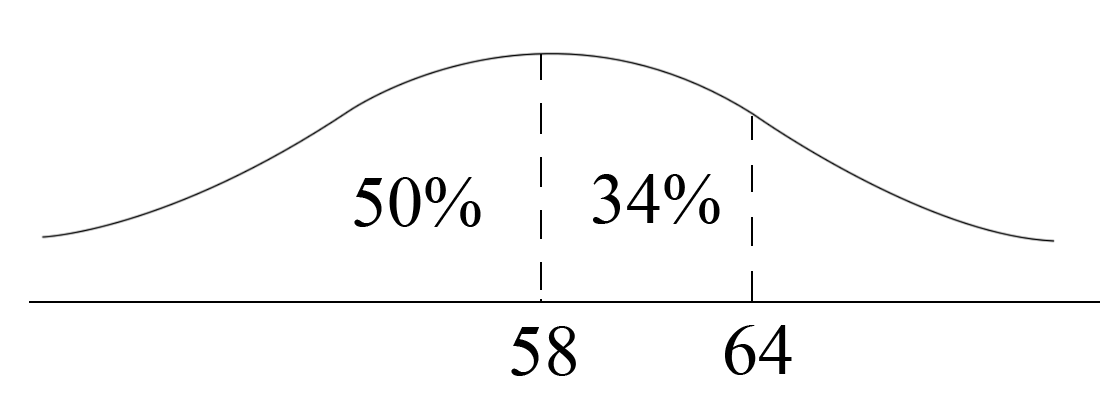
`text(84% have)\ z text(-score) < 1`
`:.\ text(# Students expected below 64) = text(84%) xx 150 = 126`
Statistics, STD2 S1 2007 HSC 24d
Barry constructed a back-to-back stem-and-leaf plot to compare the ages of his students.

- Write a brief statement that compares the distribution of the ages of males and females from this set of data. (1 mark)
--- 2 WORK AREA LINES (style=lined) ---
- What is the mode of this set of data? (1 mark)
--- 1 WORK AREA LINES (style=lined) ---
- Liam decided to use a grouped frequency distribution table to calculate the mean age of the students at Barry’s Ballroom Dancing Studio.
For the age group 30 - 39 years, what is the value of the product of the class centre and the frequency? (2 marks)
--- 3 WORK AREA LINES (style=lined) ---
- Liam correctly calculated the mean from the grouped frequency distribution table to be 39.5.
Caitlyn correctly used the original data in the back-to-back stem-and-leaf plot and calculated the mean to be 38.2.
What is the reason for the difference in the two answers? (1 mark)
--- 2 WORK AREA LINES (style=lined) ---
Statistics, STD2 S1 2007 HSC 24a
Consider the following set of scores:
`3, \ 5, \ 5, \ 6, \ 8, \ 8, \ 9, \ 10, \ 10, \ 50.`
- Calculate the mean of the set of scores. (1 mark)
--- 1 WORK AREA LINES (style=lined) ---
- What is the effect on the mean and on the median of removing the outlier? (2 marks)
--- 5 WORK AREA LINES (style=lined) ---
Statistics, STD2 S1 2007 HSC 21 MC
This set of data is arranged in order from smallest to largest.
`5, \ 6, \ 11, \ x, \ 13, \ 18, \ 25`
The range is six less than twice the value of `x`.
Which one of the following is true?
- The median is 12 and the interquartile range is 7.
- The median is 12 and the interquartile range is 12.
- The median is 13 and the interquartile range is 7.
- The median is 13 and the interquartile range is 12.
Statistics, STD2 S1 2007 HSC 17 MC
Ms Wigginson decided to survey a sample of 10% of the students at her school.
The school enrolment is shown in the table.

She surveyed the same number of students in each year group.
How would the numbers of students surveyed in Year 10 and Year 11 have changed if Ms Wigginson had chosen to use a stratified sample based on year groups?
- Increased in both Year 10 and Year 11
- Decreased in both Year 10 and Year 11
- Increased in Year 10 and decreased in Year 11
- Decreased in Year 10 and increased in Year 11
Probability, STD2 S2 2007 HSC 16 MC
Leanne copied a two-way table into her book.
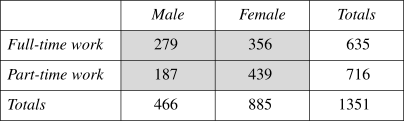
Leanne made an error in copying one of the values in the shaded section of the table.
Which value has been incorrectly copied?
- The number of males in full-time work
- The number of males in part-time work
- The number of females in full-time work
- The number of females in part-time work
Statistics, STD2 S4 2007 HSC 9 MC
Which of the following would be most likely to have a positive correlation?
- The population of a town and the number of schools in that town
- The price of petrol per litre and the number of litres of petrol sold
- The hours training for a marathon and the time taken to complete the marathon
- The number of dogs per household and the number of televisions per household
Probability, STD2 S2 2007 HSC 2 MC
Each student in a class is given a packet of lollies. The teacher records the number of red lollies in each packet using a frequency table.
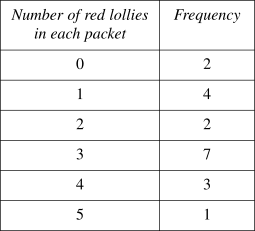
What is the relative frequency of a packet of lollies containing more than three red lollies?
- `4/19`
- `4/15`
- `11/19`
- `11/15`