SmarterEd

Aussie Maths & Science Teachers: Save your time with SmarterEd

  • Login
  • Get Help
  • About

Data Analysis, SM-Bank 034

Give an example of a data set with a mode of 9 and a mean of 10.  (1 mark)

Show Answers Only

`9,  9,  12`

`text(Note: other answers are possible.)`

Show Worked Solution

`9,  9,  12`

`text(Mode) = 9`

`text(Mean) = (9 + 9 + 12)/3\ = 30/3 \= 10`

`text(Note: other answers are possible.)`

Filed Under: Data Analysis Tagged With: num-title-ct-core, smc-4224-15-Mode, smc-4224-25-Mean

Data Analysis SM-Bank 033 MC

Which of the following terms best describes this distribution?
  

  1. Uniform
  2. Multimodal
  3. Unimodal
  4. Bimodal
Show Answers Only

`C`

Show Worked Solution

`text(There one mode, therefore, the distribution is best described as unimodal.`

`=>C`

Filed Under: Data Analysis Tagged With: num-title-ct-core, smc-4224-15-Mode, smc-4224-35-Describing datasets

Data Analysis, SM-Bank 032 MC

Which of the following terms best describes this distribution?
  

  1. Unimodal
  2. Multimodal
  3. Bimodal
  4. Uniform
Show Answers Only

`B`

Show Worked Solution

`text(There are many modes, therefore, the distribution is best described as multimodal.`

`=>B`

Filed Under: Data Analysis Tagged With: num-title-ct-core, smc-4224-15-Mode, smc-4224-35-Describing datasets

Data Analysis, SM-Bank 031 MC

Which of the following terms best describes this distribution?
  

  1. Unimodal
  2. Multimodal
  3. Bimodal
  4. Uniform
Show Answers Only

`C`

Show Worked Solution

`text(There are 2 modes, therefore, the distribution is best described as bimodal.`

`=>C`

Filed Under: Data Analysis Tagged With: num-title-ct-core, smc-4224-15-Mode, smc-4224-35-Describing datasets

Data Analysis SM-Bank 030 MC

Which of the following terms best describes this distribution?

  1. Unimodal
  2. Multimodal
  3. Bimodal
  4. Uniform
     
Show Answers Only

`D`

Show Worked Solution

`text(There is no distinct mode, therefore, the distribution is best described as uniform.`

`=>D`

Filed Under: Data Analysis Tagged With: num-title-ct-core, smc-4224-15-Mode, smc-4224-35-Describing datasets

Data Analysis, SM-Bank 029

The local nursery is selling advanced orange trees. The heights of the trees are displayed in the dot plot below.
 

What is the mean height of these trees?  (2 marks)

Show Answers Only

`173`

Show Worked Solution
`text(Mean)\ ` `=\ text(Average of the heights)`
  `= (170 xx 2 + 171 xx 2 + 172 xx 2 + 174 xx 3 + 175 + 176 + 177)/12`
  `= 2076/12`
  `= 173`

Filed Under: Data Analysis Tagged With: num-title-ct-core, smc-4224-25-Mean

Data Analysis, SM-Bank 028

Find the range for this set of scores.  (1 mark)

`74, \ 89, \ 65, \ 64, \ 87, \ 88, \ 68, \ 74, \ 72`

--- 1 WORK AREA LINES (style=lined) ---

Show Answers Only

`25`

Show Worked Solution

`text(Range) = text(Highest score) \-\text(Lowest score)   = 89 \-\64 = 25`

Filed Under: Data Analysis Tagged With: num-title-ct-core, smc-4224-10-Range

Data Analysis, SM-Bank 027

Find the median for this set of scores.  (1 mark)

`56, \ 56, \ 59, \ 60, \ 63 \ 64, \ 70, \ 71, \ 72`

--- 1 WORK AREA LINES (style=lined) ---

Show Answers Only

`63`

Show Worked Solution

`text(Median) = text(The middle or 5th score) = 63`

Filed Under: Data Analysis Tagged With: num-title-ct-core, smc-4224-20-Median

Data Analysis, SM-Bank 026

Find the mode for this set of scores.  (1 mark)

`12, \ 15, \ 18, \ 12, \ 17, \ 19, \ 10, \ 11, \ 12, \ 15`

Show Answers Only

`12`

Show Worked Solution

`text(Mode) = text(Score that occurs the most) = 12`

Filed Under: Data Analysis Tagged With: num-title-ct-core, smc-4224-15-Mode

Data Analysis, SM-Bank 025

A shop sells children's shoes in sizes from 5 to 9. The sizes of the last 100 shoes sold is shown in the table below.

\begin{array} {|l|c|c|c|c|c|c|}
\hline \textbf{Shoe Size} & 5 & 6 & 7 & 8 & 9  \\
\hline \textbf{Frequency}  & 14 & 21 & 30 & 23 & 12 \\
\hline \end{array}

  1. What is the median shoe size?  (1 mark)

    --- 1 WORK AREA LINES (style=lined) ---

  2. What is the mean shoe size?  Give your answer correct to the nearest whole number.  (2 marks)

    --- 2 WORK AREA LINES (style=lined) ---

  3. What is the range of shoe sizes?  (1 mark)

    --- 1 WORK AREA LINES (style=lined) ---

  4. What is the modal shoe size?  (1 mark)

    --- 1 WORK AREA LINES (style=lined) ---

  5. Briefly explain why the shop owner would be particularly interested in the modal shoe size?  (2 marks)

    --- 3 WORK AREA LINES (style=lined) ---

Show Answers Only
  1. `7`
  2. `6.98`
  3. `4`
  4. `7`
  5. `text(The shop keeper would be primarily interested in profit,)`
    `text(and the most popular shoe size will generate the most profit.)`
    `text(Also for stock purposes it would be an advantage to have the)`
    `text(most popular size in stock.)`
Show Worked Solution

a.    `text(Median) \ = \text(Average of 50th and 51st scores) \ = 7`

b.    `text(Mean)` `=(5 xx 14 + 6 xx 21 + 7 xx 30 + 8 xx 23 + 9 xx 12)/100`  
  `=(70 + 126 + 210 + 184 +108)/100`  
  `=698/100 = 6.98`  

 
c.
   `text(Range) \ = \text(highest score) \-\ text(lowest score) \ = 9 \-\ 5 = 4`

d.    `text(Modal shoe size) \ = \text(The shoe size with the highest frequency) \ = 7`

\begin{array} {ll}
\textbf{e.}&\text{The shop keeper would be primarily interested in profit,}\ \\
&\text{and the most popular shoe size will generate the most profit.}\ \\
&\text{Also for stock purposes it would be an advantage to have the}\ \\ 
&\text{most popular size in stock.}\end{array}

Filed Under: Data Analysis Tagged With: num-title-ct-core, smc-4224-45-Mean/median/mode/range

Data Analysis, SM-Bank 023

Justify why adding a score of 15 to the set of scores below will not change the mode of 7.  (2 marks)

`4, \ 5, \ 7, \ 7, \ 7, \ 10, \ 10, \ 11, \ 12, \ 15`

Show Answers Only

`text(Adding a score of 15 will increase the number of  15’s to 2.)`

`text(Therefore, the mode remains 7 as there are three 7’s.)`

Show Worked Solution

`text(Adding a score of 15 will increase the number of  15’s to 2.)`

`text(Therefore, the mode remains 7 as there are three 7’s.)`

Filed Under: Data Analysis Tagged With: num-title-ct-core, smc-4224-15-Mode, smc-4224-50-Add/remove data

Data Analysis, SM-Bank 024

Brendan scored the following marks in 4 class tests.

`15, \ 16, \ 16, \ 17 `

Explain the effect on his mean mark if he received a mark of 11 in his final class test.

Justify your answer with calculations.  (2 marks)

--- 4 WORK AREA LINES (style=lined) ---

Show Answers Only

`text(Initial Mean = 16)`

`text(New Mean = 15)`

`:.\ text(Mean decreases as a lower mark is added.)`

Show Worked Solution
`text(Initial Mean)` `=(15 + 16 + 16 + 17)/4`  
  `= 64/4`  
  `= 16`  


`text(New Mean)` `=(15 + 16 + 16 + 17 + 11)/5`
  `= 75/5`
  `= 15`


`:.\ text(Mean decreases as a lower mark is added.)`

Filed Under: Data Analysis Tagged With: num-title-ct-core, smc-4224-25-Mean, smc-4224-50-Add/remove data

Data Analysis, SM-Bank 022

Write down a set of six data values that has a range of 10, a mode of 10 and a minimum value of 10.  (2 marks)

Show Answers Only

`10, 10, 15, 18, 19, 20`

`text(Note: There are many possible solutions.)`

Show Worked Solution

`10, 10, 15, 18, 19, 20`

`text(Note: There are many possible solutions.)`

Filed Under: Data Analysis Tagged With: num-title-ct-core, smc-4224-45-Mean/median/mode/range

Data Analysis, SM-Bank 021 MC

A survey asked 9 students in Year 8 how many siblings they had.
 

\begin{array} {|c|c|}\hline \textbf{Number of Siblings}  & 0,  2,  2,  2,  3,  4,  4,  5,  5\\ \hline \end{array}

 
Which of the following is true for this data?

  1. mean > median > mode
  2. mean > median < mode
  3. mean = median = mode
  4. mean = median > mode
Show Answers Only

`D`

Show Worked Solution

`text(Mode = 2)`

`text(Median = 5th number = 3)`

`text(Mean)` `= (0 + 2 + 2 + 2 + 3 + 4 + 4 + 5 + 5)/9`
  `= 27 ÷ 9`
  `= 3`


`:.\ text(mean = median > mode)`

`=>D`

Filed Under: Data Analysis Tagged With: num-title-ct-core, smc-4224-45-Mean/median/mode/range

Data Analysis, SM-Bank 020

An AFL team has 10 players with the following heights in centimetres.

`180, \ 175, \ 163, \ 192, \ 200, \ 193, \ 195, \ 195, \ 188, \ 195`

What is the range of heights?  (1 mark)

Show Answers Only

`37\ text(centimetres)`

Show Worked Solution
`text(Range)` `=  200\-\163`
  `=  37\ text(centimetres)`

Filed Under: Data Analysis Tagged With: num-title-ct-core, smc-4224-10-Range

Data Analysis, SM-Bank 019

A vet measured the length of 21 dogs that came through his clinic.

The vet recorded the length of each dog.
  

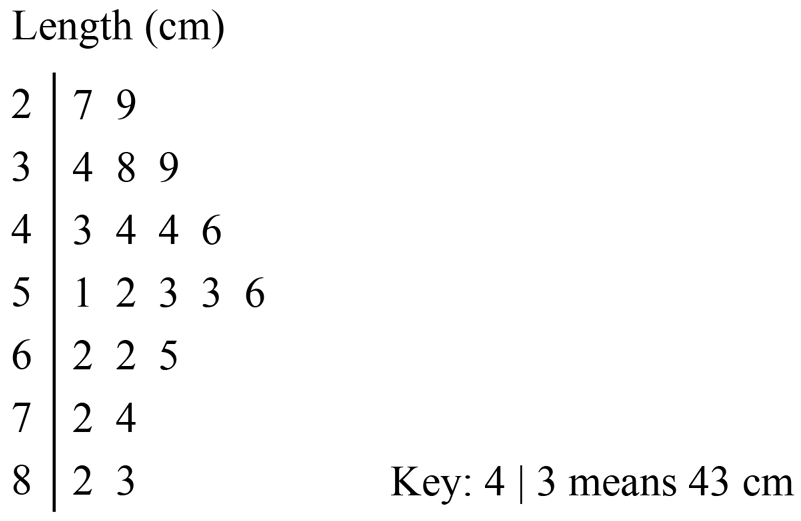
  1.  What is the median length?  (1 mark)

    --- 1 WORK AREA LINES (style=lined) ---

  2. The vet measured and recorded a new dog with a length of 41 centimetres. What is the new median length?  (1 mark)

    --- 2 WORK AREA LINES (style=lined) ---

Show Answers Only

a.   `text(52 cm)`

b.   `text(51.5 cm)`

Show Worked Solution

a.   `text(The median of 21 data points is the 11th data point.)`

`:.\ text(The median is 52 cm.)`


b.   `text(The median of 22 data points is the average of the 11th and 12th data point.)`

`text(Average)` `=(51 +52)/2`
  `=51.5\ text(cm)`

 
`:.\ text(The new median is 51.5 cm.)`

Filed Under: Data Analysis Tagged With: num-title-ct-core, smc-4224-20-Median, smc-4224-40-Stem and Leaf

Data Analysis, SM-Bank 018

Five students do a standing long jump at their athletics carnival and the length of their jumps, in centimetres, are recorded in the table below.


If Lenny's distance is removed from the data, what happens to the mean distance that is jumped from this group? (1 mark)

Show Answers Only

`text(Decreases)`

Show Worked Solution

`text(The mean decreases because the longest distance is removed from the data set.)`

Filed Under: Data Analysis Tagged With: num-title-ct-core, smc-4224-25-Mean, smc-4224-50-Add/remove data

Data Analysis, SM-Bank 017

A school's drama class puts on a play over five nights.

The play is open to the public and the numbers of tickets sold are shown in the table below.
 

The cost of each ticket was $15.

What was the mean amount of money collected from ticket sales per night?  (2 marks)

Show Answers Only

`$2850`

Show Worked Solution
`text(Mean number of tickets sold)` `= (210 + 170 + 180 + 170 + 220)/5`
  `= 190`


`:.\ text(Mean tickets sales)` `= 190 xx 15`
  `= $2850`

Filed Under: Data Analysis Tagged With: num-title-ct-core, smc-4224-25-Mean

Data Analysis, SM-Bank 016

This table summarises the time Tutty spent training her parrot over five days.


What was the average (mean) time for training the parrot each day?  (2 marks)

Show Answers Only

`text(56 minutes)`

Show Worked Solution
`text(Average)` `= (25 + 55 + 60 + 94 + 46)/5`
  `= 280/5`
  `= 56\ text(minutes)`

Filed Under: Data Analysis Tagged With: num-title-ct-core, smc-4224-25-Mean

Data Analysis, SM-Bank 015

A policeman is recording the speed of 25 cars travelling on a highway using a speed gun.

The results are shown in the stem-and-leaf plot.

  1. What is the median speed?  (1 mark)

    --- 2 WORK AREA LINES (style=lined) ---

  2. What is the range of the speeds?  (1 mark)

    --- 2 WORK AREA LINES (style=lined) ---

Show Answers Only

a.   `119\ text(km/hr)`

b.  `49\ text(km/hr)`

Show Worked Solution

a.   `25\ text(data points)`

`text(Median is the 13th data point)`

`:.\ text(Median) = 119\ text(km/hr)`
 

b.   `text(Range)` `= text(Highest) \ – \ text(Lowest)`
    `= 139\ – \ 90`
    `=49\ text(km/hr)`


Filed Under: Data Analysis Tagged With: num-title-ct-core, smc-4224-10-Range, smc-4224-20-Median, smc-4224-40-Stem and Leaf

Data Analysis, SM-Bank 014 MC

The Stars and the Thunder are playing cricket in a 20 over competition.

The stem-and-leaf plots show the number of runs each side has scored in their last 15 games.


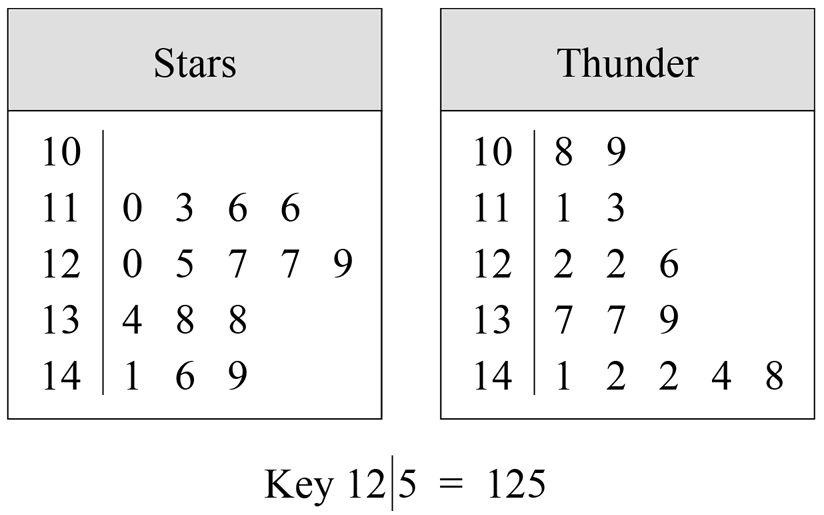
Which statement is true about the data.

  1. The Stars had the lowest run score.
  2. The Stars scored over 135 runs more times than the Thunder.
  3. The median score for The Stars is higher than the median score for The Thunder.
  4. The range of scores for The Stars is smaller than the range of scores for The Thunder.
Show Answers Only

`D`

Show Worked Solution

`text{Range The Stars} = 149\ – \ 140\ =\ 39`

`text{Range The Thunder} = 148\ – \ 108\ =\ 40`

`:.\ text(Correct statement is:)`

`text{The range of scores for The Stars is smaller than the}`

`text{range of scores for The Thunder (39 vs 40).}`

`=>D`


Filed Under: Data Analysis Tagged With: num-title-ct-core, smc-4224-40-Stem and Leaf

Data Analysis, SM-Bank 013

Curly measures the position of glaciers in the Antarctic.

His measurements showed that in 1 full year, a glacier moved 88 cm.

On average, how many centimetres did the glacier move per day?  (2 marks)

Show Answers Only

`0.24\ text(cm)`

Show Worked Solution

`text(Average daily movement of glacier)`

`=88/365`

`= 0.24\ text(cm)`

Filed Under: Data Analysis Tagged With: num-title-ct-core, smc-4224-25-Mean

Data Analysis, SM-Bank 012 MC

In Wadonga, there are 29 538 people.

Each day, the average person uses 168 litres of water.

Which of these gives the best estimate for the total number of litres of water used in Wadonga each day?

  1. `30\ 000 xx 200`
  2. `30\ 000 xx 100`
  3. `30\ 000 ÷ 200`
  4. `30\ 000 ÷ 100`
Show Answers Only

`A`

Show Worked Solution
`text(Total litres)` `=\ text(litres per person × total people)`  
  `= 30\ 000 xx 200`  
     

`text{(168 is closer to 200 than 100 and will give a better estimate.)}`

`=>A`

Filed Under: Data Analysis Tagged With: num-title-ct-core, smc-4224-25-Mean

Data Analysis, SM-Bank 011 MC

Five students throw the javelin at their athletics carnival and the length of their throws, to the nearest metre, are recorded in the table below.
 

If Monica's distance is removed from the data, what happens to the mean distance that is thrown from this group?

  1. It increases.
  2. It decreases.
  3. It stays the same.
  4. It is impossible to tell from the information given.
Show Answers Only

`A`

Show Worked Solution

The mean increases because the shortest distance is removed from the data set.

`=>A`

Filed Under: Data Analysis Tagged With: num-title-ct-core, smc-4224-25-Mean, smc-4224-50-Add/remove data

Data Analysis, SM-Bank 010 MC

The heights, in centimetres, of David's hockey side are displayed in the dot plot below.
 

Which of the following statements is true about this data?

  1. The median and the mode are both 174 and the mean is 174.5.
  2. The mean and the median are both 174 and the mode is 177.
  3. The mean is 175, the mode is 174 and the median is 174.5.
  4. The mean, median and mode are all equal to 174.
Show Answers Only

`D`

Show Worked Solution

`text(Data from the dot plot:)` `\ 171, \ 172, \ 172, \ 173, \ 174, \ 174, \ 174, \ 174, \ 176, \ 177, \ 177`

`text(Median)\ ` `=\ text(Middle or 6th score)`
  `= 174`


`text(Mode)\ ` `=\ text(The most frequent score)`
  `= 174`


`text(Mean)\ ` `=\ text(Average of the scores)`
  `= (171 + 172 + 172 + 173 + 174 + 174 + 174 + 174 + 176 + 177 + 177)/11`
  `= 1914/11`
  `= 174`

 
∴ The mean, median and mode are all equal to 174.

`=>D`

Filed Under: Data Analysis Tagged With: num-title-ct-core, smc-4224-15-Mode, smc-4224-20-Median, smc-4224-25-Mean, smc-4224-45-Mean/median/mode/range

Data Analysis, SM-Bank 009

A group of 10 students scored the following marks in an English exam.

 `87, \ 56, \ 86, \ 84, \ 89, \ 89, \ 87, \ 88, \ 90, \ 94`

  1. Calculate the mean mark for the exam.  (1 mark)

    --- 2 WORK AREA LINES (style=lined) ---

  2. After receiving his mark back for the exam, Marcus told his friend:

`text(“My mark of 84 was much better than the average, so I did really well.”)`

  Comment briefly on Marcus' statement.  (2 marks)

--- 3 WORK AREA LINES (style=lined) ---

Show Answers Only
  1. `85`
  2. `text(Marcus’ mark of 84 was below the average of 85 and he did not do well)`
    `text(compared to the other students as he received the second lowest mark.)`
Show Worked Solution
a.  `text(Mean)` `= (87 + 56 + 86 + 84 + 89 + 89 + 87 + 88 + 90 + 94)/10`
  `= (850)/10`
  `= 85`

 
b.  `text(Marcus’ mark of 84 was below the average of 85 and he did not do well)`
     `text(compared to the other students as he received the second lowest mark.)`


Filed Under: Data Analysis Tagged With: num-title-ct-core, smc-4224-25-Mean

Data Analysis, SM-Bank 008 MC

A group of friends met with their 7 children. The ages of the children were:

 `9, \ 4, \ 5, \ 6, \ 11, \ 3, \ 4`

The median of the children's ages is:

  1. `6`
  2. `5`
  3. `4`
  4. `8`
Show Answers Only

`B`

Show Worked Solution

`text(Ordered data:)` `\ 3, \ 4, \ 4, \ 5, \ 6, \ 9, \ 11`

`text(Median)\ ` `=\ text(Middle score)`
  `=5`

 
`=>B`

Filed Under: Data Analysis Tagged With: num-title-ct-core, smc-4224-20-Median

Data Analysis, SM-Bank 007

Bailey's soccer coach recorded the number of goals scored during the last 6 games of the season.

  `3, \ 7, \ 6, \ 3, \ 1, \ 4`

Find:

  1. the median number of goals scored.  (1 mark)

    --- 2 WORK AREA LINES (style=lined) ---

  2. the mean number of goals scored.  (1 mark)

    --- 2 WORK AREA LINES (style=lined) ---

Show Answers Only

i.  `3.5`

ii.  `4`

Show Worked Solution

i.  `text(Ordered data:)` `\ 1, \ 3, \ 3, \ 4, \ 6, \ 7`

`text(Median)\ ` `=\ text(Average of 2 middle scores)`
  `= (3+4)/2`
  `= 7/2`
  `=3.5`


ii.  `text(Mean) ` `= (3+7+6+3+1+4)/6`  
  `= 24/6`  
  `= 4`  


Filed Under: Data Analysis Tagged With: num-title-ct-core, smc-4224-20-Median, smc-4224-25-Mean

Data Analysis, SM-Bank 006

In the two weeks leading up to a half marathon, Rogan ran the following distances, in kilometres.

`15, \ 21, \ 17, \ 9, \ 17, \ 25, \ 11`

What was his mean distance, in kilometres?  Give your answer correct to 2 decimal places?  (2 marks)

Show Answers Only

`16.43` km

Show Worked Solution
`text(Mean)` `= (15 + 21 + 17 + 9 + 17 + 25 + 11)/7`
  `= (115)/7`
  `= 16.4285…`
  `~~ 16.43` km

Filed Under: Data Analysis Tagged With: num-title-ct-core, smc-4224-25-Mean

Data Analysis, SM-Bank 005 MC

The points scored by an AFL team in their first 13 games of the season is recorded.

`78, \ 84, \ 63, \ 75, \ 98, \ 105, \ 92, \ 75, \ 84, \ 96, \ 84, \102, \100`

In the 14th game, they scored 61.

Which of these values would increase?

  1. `text(mode)`
  2. `text(range)`
  3. `text(mean)`
  4. `text(median)`
Show Answers Only

`B`

Show Worked Solution

`text(Consider each option:)`

`text(Mode – unchanged at 84)`

`text(Range – increases from 42 to 44)`

`text(Mean – decreases from 87.38 to 85.5)`

`text{Median – unchanged at 84}`

`=>B`

Filed Under: Data Analysis Tagged With: num-title-ct-core, smc-4224-45-Mean/median/mode/range, smc-4224-50-Add/remove data

Data Analysis, SM-Bank 004 MC

Jacqui's basketball team has 5 players.

The height of each player is listed below (in cm):
 

`186, 190, 164, 190, 175`
  

What is the median height of these players?

  1. `181\ text(cm)`
  2. `164\ text(cm)`
  3. `186\ text(cm)`
  4. `190\ text(cm)`
Show Answers Only

`C`

Show Worked Solution

`text(Heights in order are:)`

`164, 175, 186, 190, 190`

`:.\ text(Median) = 186\ text(cm)`

`=> C`

Filed Under: Data Analysis Tagged With: num-title-ct-core, smc-4224-20-Median

Data Analysis, SM-Bank 003

This table shows the number of people who visited a war memorial on weekdays over 4 weeks.


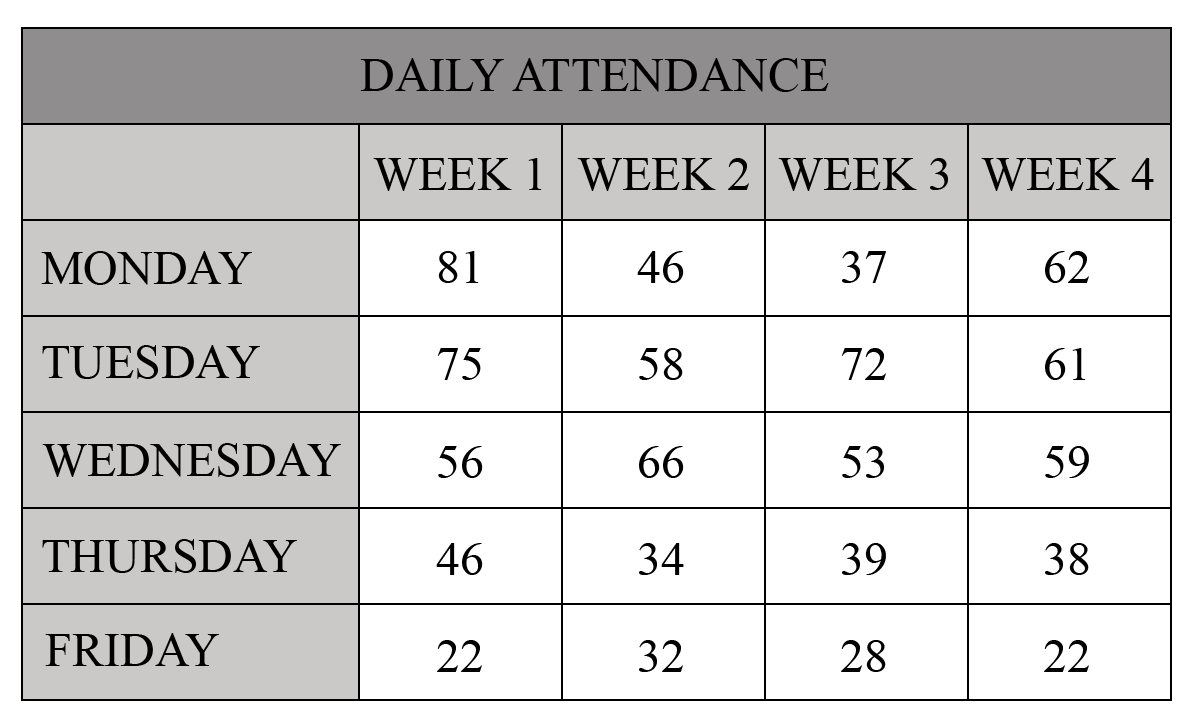
  1. What was the range of people visiting the war memorial on Monday?  (1 mark)

    --- 1 WORK AREA LINES (style=lined) ---

  2. What was the mean number of people who attended the war memorial on Fridays?  (1 mark)

    --- 1 WORK AREA LINES (style=lined) ---

  3. What was the median number of people who visited the war memorial during week 3?  (1 mark)

    --- 1 WORK AREA LINES (style=lined) ---

  4. What is the modal number of visitors to the war memorial during the four week period?  (1 mark)

    --- 1 WORK AREA LINES (style=lined) ---

Show Answers Only

a.   `44`

b.   `26`

c.   `39`

d.   `22`

Show Worked Solution
a.   `text(Range on Mondays)` `= 81 \ -\ 37`
  `= 44`


b.   `text(Mean on Fridays)` `=(22 + 32+28+22)/4`
  `=104/4`
  `=26`

  
c.   `text(Week 3 data in order:   28,  37,  39,  53,  72)`

`text(Median Week 3)` `=\ text(middle score)`
  `=\  39`

 
d.   `text(Modal number of visitors) = 22`

Filed Under: Data Analysis Tagged With: num-title-ct-core, smc-4224-10-Range, smc-4224-15-Mode, smc-4224-20-Median, smc-4224-25-Mean

Data Analysis, SM-Bank 002

The mean (average) of four numbers is 26.

One more number is added and the mean number becomes 27.

What is the number that was added?  (2 marks)

--- 4 WORK AREA LINES (style=lined) ---

Show Answers Only

`31`

Show Worked Solution

`text(Total of the first 4 numbers,)`

`26 xx 4 = 104`

`text(Total including the 5th number added,)`

`27 xx 5 = 135`

`:.\ text(The number added)` `=135-104`
  `=31`

Filed Under: Data Analysis Tagged With: num-title-ct-core, smc-4224-25-Mean

Data Analysis, SM-Bank 001 MC

Percy bought 8 packets of cough lollies for $18.00.

The average cost of one packet is

  1. `$0.45`
  2. `$2.25`
  3. `$2.50`
  4. `$10`
Show Answers Only

`B`

Show Worked Solution
`text(Price of 1 packet)` `= ($18.00)/8`
  `= $2.25`

 
`=>B`

Filed Under: Data Analysis Tagged With: num-title-ct-core, smc-4224-25-Mean

Probability, STD1 S2 2022 HSC 17

Each number from 1 to 30 is written on a separate card. The 30 cards are shuffled. A game is played where one of these cards is selected at random. Each card is equally likely to be selected.

Ezra is playing the game, and wins if the card selected shows an odd number between 20 and 30.

  1. List the numbers which would result in Ezra winning the game.  (1 mark)

    --- 1 WORK AREA LINES (style=lined) ---

  2. What is the probability that Ezra does NOT win the game?  (2 marks)

    --- 4 WORK AREA LINES (style=lined) ---

Show Answers Only
  1. `21, 23, 25, 27, 29`
  2. `Ptext{(not win)} = 5/6`
Show Worked Solution

a.   `21, 23, 25, 27, 29`
 

b.    `Ptext{(not win)}` `=1-Ptext{(win)}`
    `=1-5/30`
    `=25/30`
    `=5/6`


♦ Mean mark 51%.

Filed Under: Probability, Single and Multi-Stage Events Tagged With: Band 3, Band 5, num-title-ct-core, num-title-qs-hsc, smc-1135-05-Simple Probability, smc-1135-30-P(E) = 1 - P(not E), smc-4225-15-Single-stage events, smc-4225-20-Complementary events

Probability, STD1 S2 2021 HSC 20

In a bag, there are six playing cards, 2, 4, 6, 8, Queen and King. The Queen and King are known as picture cards.

Two of these cards are chosen randomly. All the possible outcomes are shown.


  1. What is the probability that the two cards chosen include one or both picture cards?  (1 mark)

    --- 2 WORK AREA LINES (style=lined) ---

  2. What is the probability that the two cards chosen do NOT include any picture cards?  (1 mark)

    --- 2 WORK AREA LINES (style=lined) ---

Show Answers Only
  1. `9/15`
  2. `6/15`
Show Worked Solution

a.   `P text{(at least 1 picture card)} = 9/15`


b.    `P text{(no picture card)}` `= 1 – 9/15`
    `= 6/15`

Filed Under: Probability, Single and Multi-Stage Events Tagged With: Band 4, num-title-ct-core, num-title-qs-hsc, smc-1135-20-Other Multi-Stage Events, smc-1135-30-P(E) = 1 - P(not E), smc-4225-15-Single-stage events, smc-4225-20-Complementary events

Statistics, STD1 S1 2021 HSC 2 MC

A survey of which of the following would provide data that are both categorical and nominal?

  1. Hair colour
  2. Height in centimetres
  3. Number of people present at a concert
  4. Size of coffee cup classified as small, medium or large
Show Answers Only

`A`

Show Worked Solution

`text(By elimination:)`

♦♦ Mean mark 25%.

`text{Qualitative (not quantitative)}`

`text{→ Eliminate B and C}`

`text(Nominal data is not ordered)`

`text{→ Eliminate D}`

`=> A`

Filed Under: Classifying Data, Classifying Data, Classifying Data, Data Classification, Investigation and Sampling Methods, Data Classification, Investigation and Sampling Methods Tagged With: Band 5, num-title-ct-core, num-title-qs-hsc, smc-1127-20-Classifying Data, smc-4223-30-Categorical data, smc-5075-10-Categorical, smc-6309-20-Data Classification, smc-6529-20-Data Classification, smc-820-20-Classifying Data

Statistics, STD2 S1 2021 HSC 3 MC

The stem-and-leaf plot shows the number of goals scored by a team in each of ten netball games.
  

What is the mode of this dataset?

  1. 5
  2. 18
  3. 25
  4. 29
Show Answers Only

`C`

Show Worked Solution

`\text{Mode}  -> \text{data point with highest frequency}`

`\text{Mode}  = 25`

`=> C`

Filed Under: Bar Charts, Histograms and Other Graphs, Data Analysis, Other Charts, Other Charts, Other Charts Tagged With: Band 3, common-content, num-title-ct-core, num-title-qs-hsc, smc-1128-24-Stem and Leaf, smc-4224-15-Mode, smc-4224-40-Stem and Leaf, smc-6311-10-Stem-and-Leaf, smc-6531-10-Stem-and-Leaf, smc-822-20-Stem and Leaf

Probability, STD1 S2 2020 HSC 26

Barbara plays a game of chance, in which two unbiased six-sided dice are rolled. The score for the game is obtained by finding the difference between the two numbers rolled. For example, if Barbara rolls a 2 and a 5, the score is 3.

The table shows some of the scores.


  1. Complete the six missing values in the table to show all possible scores for the game.   (1 mark)
  2. What is the probability that the score for a game is NOT 0?  (2 marks)

    --- 3 WORK AREA LINES (style=lined) ---

Show Answers Only
  1.  

     
  2. `frac{5}{6}`
Show Worked Solution

a.     

♦ Mean mark part (b) 47%.
b.       `Ptext{(not zero)}` `= frac{text(numbers) ≠ 0}{text(total numbers)}`
    `= frac{30}{36}`
    `= frac{5}{6}`

 
\(\text{Alternate solution (b)}\)

b.       `Ptext{(not zero)}` `= 1 – Ptext{(zero)}`
    `= 1 – frac{6}{36}`
    `= frac{5}{6}`

Filed Under: Probability, Single and Multi-Stage Events Tagged With: Band 4, Band 5, num-title-ct-core, num-title-qs-hsc, smc-1135-20-Other Multi-Stage Events, smc-1135-40-Arrays, smc-4225-20-Complementary events, smc-4225-45-Multi-stage events

Statistics, STD2 S1 2020 HSC 7 MC

Which histogram best represents a dataset that is positively skewed?


Show Answers Only

`A`

Show Worked Solution

♦♦ Mean mark 32%.

`text(Positive skew occurs when the tail on the)`

`text{histogram is longer on the right-hand}`

`text{(positive) side.}`

`=> A`

Filed Under: Bar Charts and Histograms, Bar Charts and Histograms, Bar Charts and Histograms, Bar Charts and Histograms, Bar Charts, Histograms and Other Graphs, Data Analysis Tagged With: Band 5, common-content, num-title-ct-core, num-title-qs-hsc, smc-1128-15-Histograms, smc-4224-35-Describing datasets, smc-6310-20-Histograms, smc-6530-20-Histograms, smc-821-15-Histograms, smc-997-15-Histograms

Probability, STD1 S2 2019 HSC 24

The faces on a biased six-sided die are labelled 1, 2, 3, 4, 5 and 6. The die was rolled twenty times. The relative frequency of rolling a 6 was 30% and the relative frequency of rolling a 2 was 15%. The number 3 was the only other number rolled in the twenty rolls.

How many times was the number 3 rolled in the twenty rolls of the die?  (3 marks)

--- 4 WORK AREA LINES (style=lined) ---

 
Show Answers Only

`11`

Show Worked Solution

`text(Number of 6’s) = 30/100 xx 20 = 6`

`text(Number of 2’s) = 15/100 xx 20 = 3`

`:.\ text(Number of 3’s)` `= 20 – (6 + 3)`
  `= 11`

Filed Under: Probability, Relative Frequency Tagged With: Band 4, num-title-ct-core, num-title-qs-hsc, smc-1133-30-Expected Frequency (np), smc-4225-35-Relative frequency

Measurement, STD1 M1 2019 HSC 15

The diagram shows a shape made up of a square of side length 8 cm and a semicircle.


Find the area of the shape to the nearest square centimetre.  (3 marks)

--- 6 WORK AREA LINES (style=lined) ---

Show Answers Only

`89\ text(cm)^2\  text{(nearest cm}^2text{)}`

Show Worked Solution

♦♦ Mean mark 26%.

`text(Area)` `=\ text(Area of square + Area of semicircle)`
  `= 8 xx 8 + 1/2 xx pi xx 4^2`
  `= 89.13…= 89\ text(cm)^2\  text{(nearest cm}^2text{)}`

Filed Under: Circular measure, Perimeter and Area, Perimeter and Area Tagged With: Band 5, num-title-ct-core, num-title-qs-hsc, smc-1121-20-Perimeter and Area (Circular Measure), smc-4944-50-Composite shapes, smc-6520-50-Area (Circular Measure)

Probability, STD2 S2 2019 HSC 20

A roulette wheel has the numbers 0, 1, 2, …, 36 where each of the 37 numbers is equally likely to be spun.


If the wheel is spun 18 500 times, calculate the expected frequency of spinning the number 8.  (2 marks)

--- 4 WORK AREA LINES (style=lined) ---

Show Answers Only

`500`

Show Worked Solution

`P(8) = 1/37`

`:.\ text(Expected Frequency (8))`

`= 1/37 xx 18\ 500`

`= 500`

Filed Under: Data, Probability, Relative Frequency, Relative Frequency, Relative Frequency Tagged With: Band 4, common-content, num-title-ct-core, num-title-qs-hsc, smc-1133-20-Games of Chance, smc-4225-35-Relative frequency, smc-6805-40-Games of Chance, smc-6805-50-Expected Frequency, smc-827-20-Games of Chance, smc-827-40-Expected Frequency (np), smc-990-20-Games of Chance, smc-990-40-Expected Frequency (np)

Statistics, STD2 S1 EQ-Bank 1 MC

A survey asked the following question for students born in Australia:

"Which State or Territory were you born in?"

How would the responses be classified?

  1. Categorical, ordinal
  2. Categorical, nominal
  3. Numerical, discrete
  4. Numerical, continuous
Show Answers Only

`B`

Show Worked Solution

`text{The data is categorical (not numerical) since}`

`text(the name of a State is required.)`

`text(This data cannot be ordered.)`

`=> B`

Filed Under: Classifying Data, Classifying Data, Classifying Data, Classifying Data, Data Classification, Investigation and Sampling Methods, Data Classification, Investigation and Sampling Methods Tagged With: Band 3, common-content, num-title-ct-core, num-title-qs-hsc, smc-1127-20-Classifying Data, smc-5075-10-Categorical, smc-6309-20-Data Classification, smc-6529-20-Data Classification, smc-820-20-Classifying Data

Probability, STD2 S2 2018 HSC 26a

Jeremy rolled a biased 6-sided die a number of times. He recorded the results in a table.
  

\begin{array} {|l|c|c|c|c|c|c|}
\hline
\rule{0pt}{2.5ex} \text{Number} \rule[-1ex]{0pt}{0pt} & \ \ 1 \ \ & \ \ 2 \ \  & \ \ 3 \ \  & \ \ 4 \ \  & \ \ 5 \ \  & \ \ 6 \ \ \\
\hline
\rule{0pt}{2.5ex} \text{Frequency} \rule[-1ex]{0pt}{0pt} & \ \ 23 \ \ & \ \ 19 \ \  & \ \ 48 \ \  & \ \ 20 \ \  & \ \ 21 \ \  & \ \ 19 \ \ \\
\hline
\end{array} 

What is the relative frequency of rolling a 3?  (1 mark)

--- 2 WORK AREA LINES (style=lined) ---

Show Answers Only

\(\dfrac{8}{25}\)

Show Worked Solution
♦ Mean mark 40%.

\(\text{Rel Freq}\) \(=\dfrac{\text{number of 3’s rolled}}{\text{total rolls}}\)
  \(=\dfrac{48}{150}\)
  \(=\dfrac{8}{25}\)

Filed Under: Data, Probability, Relative Frequency, Relative Frequency, Relative Frequency Tagged With: Band 5, common-content, num-title-ct-core, num-title-qs-hsc, smc-1133-20-Games of Chance, smc-4225-35-Relative frequency, smc-6805-40-Games of Chance, smc-827-20-Games of Chance, smc-990-20-Games of Chance

Probability, STD2 S2 2018 HSC 20 MC

During a year, the maximum temperature each day was recorded. The results are shown in the table.


From the days with a maximum temperature less than 25°C, one day is selected at random.

What is the probability, to the nearest percentage, that the selected day occurred during winter?

  1. 19%
  2. 25%
  3. 32%
  4. 77%
Show Answers Only

`text(C)`

Show Worked Solution
`text{P(winter day)}` `= (text(winter days < 25))/text(total days < 25) xx 100`
  `= 71/223 xx 100`
  `= 31.8…%`

`=>\ text(C)`

Filed Under: Probability, Relative Frequency, Relative Frequency, Relative Frequency Tagged With: Band 4, common-content, num-title-ct-core, num-title-qs-hsc, smc-1133-10-Surveys/Two-Way Tables, smc-4225-35-Relative frequency, smc-827-10-Surveys/Two-Way Tables, smc-990-10-Surveys/Two-Way Tables

Statistics, STD2 S1 2018 HSC 11 MC

A set of data is summarised in this frequency distribution table.


Which of the following is true about the data?

  1. Mode = 7, median = 5.5
  2. Mode = 7, median = 6
  3. Mode = 9, median = 5.5
  4. Mode = 9, median = 6
Show Answers Only

`B`

Show Worked Solution

`text{Mode = 7  (highest frequency of 9)}`

`text(Median = average of 15th and 16th data points.)`

`:.\ text(Median = 6)`

`=> B`

Filed Under: Data Analysis, Measures of Centre and Spread, Measures of Centre and Spread, Summary Statistics, Summary Statistics - No Graph, Summary Statistics - No graph Tagged With: Band 4, common-content, num-title-ct-core, num-title-qs-hsc, smc-1131-20-Median and Mode, smc-1131-60-Frequency Tables, smc-4224-15-Mode, smc-4224-25-Mean, smc-6312-20-Median and Mode, smc-6312-60-Frequency Tables, smc-6532-20-Median and Mode, smc-6532-60-Frequency Tables, smc-824-20-Median and Mode, smc-824-60-Frequency Tables, smc-999-20-Median and Mode, smc-999-60-Frequency Tables

Probability, STD2 S2 2018 HSC 9 MC

An experiment has three distinct outcomes, A, B and C.

Outcome A occurs 50% of the time. Outcome B occurs 23% of the time.

What is the expected number of times outcome C would occur if the experiment is conducted 500 times?

  1. 115
  2. 135
  3. 250
  4. 365
Show Answers Only

`text(B)`

Show Worked Solution

`text(Expectation of outcome)\ C`

`= 1 – 0.5 – 0.23`

`= 0.27`
 

`:.\ text(Expected times)\ C\ text(occurs)`

`= 0.27 xx 500`

`= 135`

`=>\ text(B)`

Filed Under: Fundamental Understanding, Fundamental Understanding, Probability Tagged With: Band 3, num-title-ct-core, num-title-qs-hsc, smc-4225-35-Relative frequency

Statistics, STD2 S1 2018 HSC 3 MC

A survey asked the following question.

'How many brothers do you have?'

How would the responses be classified?

  1. Categorical, ordinal
  2. Categorical, nominal
  3. Numerical, discrete
  4. Numerical, continuous
Show Answers Only

`C`

Show Worked Solution

`text(The number of brothers a person has is)`

`text(an exact whole number.)`

`:.\ text(Classification is numerical, discrete.)`

`=> C`

Filed Under: Classifying Data, Classifying Data, Classifying Data, Classifying Data, Data Classification, Investigation and Sampling Methods, Data Classification, Investigation and Sampling Methods Tagged With: Band 4, common-content, num-title-ct-core, num-title-qs-hsc, smc-1127-20-Classifying Data, smc-5075-15-Numerical, smc-6309-20-Data Classification, smc-6529-20-Data Classification, smc-820-20-Classifying Data

Probability, STD2 S2 2017 HSC 15 MC

The faces on a twenty-sided die are labelled  $0.05, $0.10, $0.15, … , $1.00.

The die is rolled once.

What is the probability that the amount showing on the upper face is more than 50 cents but less than 80 cents?

A.     `1/4`

B.     `3/10`

C.     `7/20`

D.     `1/2`

Show Answers Only

`A`

Show Worked Solution

`text(Possible faces that satisfy are:)`

♦ Mean mark 50%.

`55text(c),60text(c),65text(c),70text(c),75text(c)`

`:.\ text(Probability)` `= 5/20`
  `= 1/4`

`=>A`

Filed Under: Combinations and Single Stage Events, Probability, Single and Multi-Stage Events, Single stage events Tagged With: Band 5, num-title-ct-core, num-title-qs-hsc, smc-1135-05-Simple Probability, smc-4225-15-Single-stage events, smc-828-10-Simple Probability

Probability, STD2 S2 2017 HSC 5 MC

In a survey of 200 randomly selected Year 12 students it was found that 180 use social media.

Based on this survey, approximately how many of 75 000 Year 12 students would be expected to use social media?

A.     60 000

B.     67 500

C.     74 980

D.     75 000

Show Answers Only

`B`

Show Worked Solution
`text(Expected number)` `= 180/200 xx 75\ 000`
  `= 67\ 500`

`=> B`

Filed Under: Data, DS5/6 - Normal Distribution and Sampling, Probability, Relative Frequency, Relative Frequency, Relative Frequency, Relative Frequency Tagged With: Band 3, common-content, num-title-ct-core, num-title-qs-hsc, smc-1133-10-Surveys/Two-Way Tables, smc-1133-30-Expected Frequency (np), smc-4225-35-Relative frequency, smc-6805-50-Expected Frequency, smc-827-10-Surveys/Two-Way Tables, smc-827-40-Expected Frequency (np), smc-990-10-Surveys/Two-Way Tables, smc-990-40-Expected Frequency (np)

Statistics, STD2 S1 2016 HSC 7 MC

Which set of data is classified as categorical and nominal?

  1. blue, green, yellow
  2. small, medium, large
  3. 5.2 cm, 6 cm, 7.21 cm
  4. 4 people, 5 people, 9 people 
Show Answers Only

\(A\)

Show Worked Solution

\(\text{Categorical data is qualitative (eliminate C and D)}\)

♦♦ Mean mark 26%.

\(\text{Nominal data not ordered (eliminate B)}\)

\(\Rightarrow A\)

Filed Under: Classifying Data, Classifying Data, Classifying Data, Classifying Data, Data Classification, Investigation and Sampling Methods, Data Classification, Investigation and Sampling Methods, DS1 - Stats and society Tagged With: Band 6, common-content, num-title-ct-core, num-title-qs-hsc, smc-1127-20-Classifying Data, smc-5075-10-Categorical, smc-6309-20-Data Classification, smc-6529-20-Data Classification, smc-820-20-Classifying Data

Probability, STD2 S2 2015 HSC 26e

The table shows the relative frequency of selecting each of the different coloured jelly beans from packets containing green, yellow, black, red and white jelly beans.

\begin{array} {|c|c|}
\hline
\rule{0pt}{2.5ex} \textit{Colour} \rule[-1ex]{0pt}{0pt} & \textit{Relative frequency} \\
\hline
\rule{0pt}{2.5ex} \text{Green} \rule[-1ex]{0pt}{0pt} & 0.32 \\
\hline
\rule{0pt}{2.5ex} \text{Yellow} \rule[-1ex]{0pt}{0pt} & 0.13 \\
\hline
\rule{0pt}{2.5ex} \text{Black} \rule[-1ex]{0pt}{0pt} & 0.14 \\
\hline
\rule{0pt}{2.5ex} \text{Red} \rule[-1ex]{0pt}{0pt} &  \\
\hline
\rule{0pt}{2.5ex} \text{White} \rule[-1ex]{0pt}{0pt} & 0.24 \\
\hline
\end{array}

  1. What is the relative frequency of selecting a red jelly bean?  (1 mark)

    --- 2 WORK AREA LINES (style=lined) ---

  2. Based on this table of relative frequencies, what is the probability of NOT selecting a black jelly bean?  (1 mark)

    --- 2 WORK AREA LINES (style=lined) ---

Show Answers Only
  1. \(0.17\)
  2. \(0.86\)
Show Worked Solution

i.  \(\text{Relative frequency of red}\)

\(= 1-(0.32 + 0.13 + 0.14 + 0.24)\)

\(= 1-0.83\)

\(= 0.17\)


ii.  \(P\text{(not selecting black)}\)

\(= 1-P\text{(selecting black)}\)

\(= 1-0.14\)

\(= 0.86\)

Filed Under: Combinations and Single Stage Events, Data, Probability, Relative Frequency, Relative Frequency, Relative Frequency, Relative Frequency, Single and Multi-Stage Events, Single stage events Tagged With: Band 3, Band 4, common-content, num-title-ct-core, num-title-qs-hsc, smc-1133-20-Games of Chance, smc-1135-05-Simple Probability, smc-4225-20-Complementary events, smc-4225-35-Relative frequency, smc-6805-40-Games of Chance, smc-827-20-Games of Chance, smc-828-10-Simple Probability, smc-990-20-Games of Chance

Statistics, STD2 S1 2015 HSC 4 MC

On a school report, a student’s record of completing homework is graded using the following codes.

C = consistently
U = usually
S = sometimes
R = rarely
N = never

What type of data is this?

  1. Categorical, ordinal
  2. Categorical, nominal
  3. Numerical, continuous
  4. Numerical, discrete
Show Answers Only

`A`

Show Worked Solution

`text(The data has been grouped into categories and)`

`text(because each category can be ranked, it is ordinal.)`

`=> A`

Filed Under: Classifying Data, Classifying Data, Classifying Data, Classifying Data, Data Classification, Investigation and Sampling Methods, Data Classification, Investigation and Sampling Methods, DS1 - Stats and society Tagged With: Band 4, common-content, num-title-ct-core, num-title-qs-hsc, smc-1127-20-Classifying Data, smc-5075-10-Categorical, smc-6309-20-Data Classification, smc-6529-20-Data Classification, smc-820-20-Classifying Data

Statistics, STD2 S1 2006 HSC 24a

2UG-2006-24a

List TWO ways in which this graph is misleading.   (2 marks)

--- 4 WORK AREA LINES (style=lined) ---

Show Answers Only

`text(Reasons the graph is misleading include)`

`text(- the columns are of different widths/volumes)`

`text(- the vertical axis doesn’t start at zero)`

Show Worked Solution

`text(Reasons the graph is misleading include)`

`text(- the columns are of different widths/volumes)`

`text(- the vertical axis doesn’t start at zero)`

Filed Under: Bar Charts and Histograms, Bar Charts and Histograms, Bar Charts and Histograms, Bar Charts and Histograms, Bar Charts and Histograms, Bar Charts, Histograms and Other Graphs, Interpreting Data Tagged With: Band 4, common-content, num-title-ct-core, num-title-qs-hsc, smc-1128-10-Bar Charts, smc-5077-10-Misleading graphs, smc-6310-10-Bar Charts, smc-6530-10-Bar Charts, smc-821-10-Bar Charts, smc-997-10-Bar Charts

Statistics, STD2 S1 2005 HSC 24d

The sector graph shows the proportion of people, as a percentage, living in each region of Sumcity. There are 24 000 people living in the Eastern Suburbs.
 

2UG-2005-24d1
 

  1. Show that the total number of people living in Sumcity is  160 000.   (1 mark)

    --- 1 WORK AREA LINES (style=lined) ---

Jake used the information above to draw a column graph.
 

2UG-2005-24d2

  1. The column graph height is incorrect for one region.


    Identify this region and justify your answer.   (2 marks)

    --- 4 WORK AREA LINES (style=lined) ---

Show Answers Only

a.   `160\ 000`

b.   `text(Western Suburbs population)`

Show Worked Solution

a.   `text(Let the population of Sumcity =)\ P`

`text(15%)× P` `= 24\ 000`
`:.P`  `= (24\ 000)/0.15= 160\ 000\ …\ text(as required)`

  
b.
  `text(Western Suburbs population)`

`= text(10%) × 160\ 000= 16\ 000`

`text(The column graph has this population as)`

`text(12 000 people which is incorrect.)`

Filed Under: Bar Charts and Histograms, Bar Charts and Histograms, Bar Charts and Histograms, Bar Charts and Histograms, Bar Charts and Histograms, Bar Charts, Histograms and Other Graphs, Displaying Data, Other Chart Types, Other Charts, Other Charts, Other Charts, Other Graphs Tagged With: Band 4, common-content, num-title-ct-core, num-title-qs-hsc, smc-1128-10-Bar Charts, smc-5076-15-Sector graphs and Divided Bar graphs, smc-5077-10-Misleading graphs, smc-6310-10-Bar Charts, smc-6311-30-Other Charts, smc-6530-10-Bar Charts, smc-6531-30-Other Charts, smc-6531-40-Outliers, smc-821-10-Bar Charts, smc-822-40-Other Charts, smc-997-10-Bar Charts, smc-998-40-Other Charts

Statistics, STD2 S1 2005 HSC 24a

  1. Draw a stem-and-leaf plot for the following set of scores.
  2.  


    `21\ \ \ 45\ \ \ 29\ \ \ 27\ \ \ 19\ \ \ 35\ \ \ 23\ \ \ 58\ \ \ 34\ \ \ 27`    (2 marks)

    --- 6 WORK AREA LINES (style=blank) ---

  3. What is the median of the set of scores?   (1 mark)

    --- 2 WORK AREA LINES (style=lined) ---

  4. Comment on the skewness of the set of scores.   (1 mark)

    --- 2 WORK AREA LINES (style=lined) ---

Show Answers Only

a.

b.    `28`

c.    `text(The data has a tail that stretches to the right)`

`:.\ text(Data is positively skewed.)`

Show Worked Solution
a.    HSC 2005 24a

  
b.   
`text(10 scores)`

`:.\ text(Median)` `= text{(5th + 6th)}/2`
  `= (27 + 29)/2= 28`

  
c.
  `text(The data has a tail that stretches to the right)`

`:.\ text(Data is positively skewed.)`

Filed Under: Bar Charts, Histograms and Other Graphs, Displaying Data, Other Chart Types, Other Charts, Other Charts, Other Charts, Stem & Leaf, Box & Whisker Tagged With: Band 4, Band 5, common-content, num-title-ct-core, num-title-qs-hsc, smc-1128-24-Stem and Leaf, smc-5076-20-Stem and Leaf, smc-6311-10-Stem-and-Leaf, smc-6531-10-Stem-and-Leaf, smc-822-20-Stem and Leaf, smc-998-20-Stem and Leaf

Probability, STD2 S2 2005 HSC 11 MC

The diagram shows a spinner.


The arrow is spun and will stop in one of the six sections.

What is the probability that the arrow will stop in a section containing a number greater
than 4?

  1.    `2/5`
  2.    `2/3`
  3.    `1/3`
  4.    `1/2`
Show Answers Only

`D`

Show Worked Solution

`P\ text((number greater than 4))`

`= P(7) + P (9)`

`= 2/6 + 1/6`

`= 1/2`

`=>  D`

Filed Under: Combinations and Single Stage Events, Probability, Single and Multi-Stage Events, Single stage events Tagged With: Band 3, num-title-ct-core, num-title-qs-hsc, smc-1135-05-Simple Probability, smc-4225-15-Single-stage events, smc-828-10-Simple Probability

Statistics, STD2 S1 2006 HSC 12 MC

The mean of a set of 5 scores is 62.

What is the new mean of the set of scores after a score of 14 is added?

  1. 38
  2. 54
  3. 62
  4. 76
Show Answers Only

`B`

Show Worked Solution

`text(Mean of 5 scores) = 62`

`:.\ text(Total of 5 scores) = 62 xx 5 = 310`

`text(Add a score of 14)`

`text(Total of 6 scores) = 310 + 14 = 324`

`:.\ text(New mean)= 324/6=54`

`=>  B`

Filed Under: Data Analysis, Measures of Centre and Spread, Measures of Centre and Spread, Summary Statistics, Summary Statistics - No Graph, Summary Statistics - No graph, Summary Statistics (no graph) Tagged With: Band 4, common-content, num-title-ct-core, num-title-qs-hsc, smc-1131-10-Mean, smc-4224-25-Mean, smc-4224-50-Add/remove data, smc-6312-10-Mean, smc-6532-10-Mean, smc-824-10-Mean, smc-999-10-Mean

Probability, STD2 S2 2006 HSC 10 MC

Kay randomly selected a marble from a bag of marbles, recorded its colour and returned it to the bag. She repeated this process a number of times.


Based on these results, what is the best estimate of the probability that Kay will choose a green marble on her next selection?

  1.   `5/24`
  2.   `1/24`
  3.   `1/6`
  4.   `1/5`
Show Answers Only

`C`

Show Worked Solution
`text{P(Green)}` `= text(# Green chosen) / text(Total Selections)`
  `= 4/24`
  `= 1/6`

`=>  C`

Filed Under: Multi-stage Events, Multi-Stage Events, Probability, Single and Multi-Stage Events Tagged With: Band 4, num-title-ct-core, num-title-qs-hsc, smc-1135-20-Other Multi-Stage Events, smc-4225-35-Relative frequency, smc-829-20-Other Multi-Stage Events

  • « Previous Page
  • 1
  • …
  • 28
  • 29
  • 30
  • 31
  • Next Page »

Copyright © 2014–2026 SmarterEd.com.au · Log in