

Statistics, STD2 EQ-Bank 21 MC
Twenty-five people were surveyed about the amount of money they spent on groceries per week, to the nearest dollar.
The results are shown in the frequency table.
\begin{array} {|c|c|}
\hline
\rule{0pt}{2.5ex} \textit{Amount Spent} ($) \rule[-1ex]{0pt}{0pt} & \ \ \ \ \ \textit{Frequency}\ \ \ \ \ \\
\hline
\rule{0pt}{2.5ex} 50-99 \rule[-1ex]{0pt}{0pt} & 4 \\
\hline
\rule{0pt}{2.5ex} 100-149 \rule[-1ex]{0pt}{0pt} & 9 \\
\hline
\rule{0pt}{2.5ex} 150-199 \rule[-1ex]{0pt}{0pt} & 8 \\
\hline
\rule{0pt}{2.5ex} 200-249 \rule[-1ex]{0pt}{0pt} & 4 \\
\hline
\end{array}
What is the mean amount spent on groceries by these people per week?
- $143.50
- $148.50
- $153.50
- $158.50
Statistics, STD2 EQ-Bank 19 MC
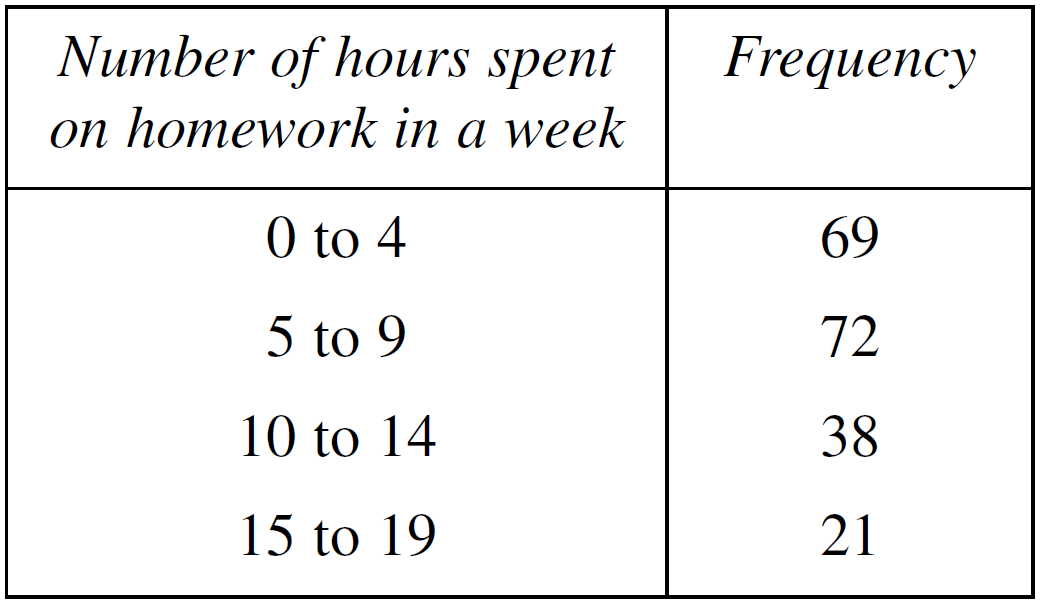
Thirty students were surveyed about the number of hours they spent on homework per week, to the nearest hour.
The results are shown in the frequency table.
\begin{array} {|c|c|}
\hline
\rule{0pt}{2.5ex} \textit{Hours per week} \rule[-1ex]{0pt}{0pt} & \ \ \ \ \ \textit{Frequency}\ \ \ \ \ \\
\hline
\rule{0pt}{2.5ex} 0-4 \rule[-1ex]{0pt}{0pt} & 8 \\
\hline
\rule{0pt}{2.5ex} 5-9 \rule[-1ex]{0pt}{0pt} & 10 \\
\hline
\rule{0pt}{2.5ex} 10-14 \rule[-1ex]{0pt}{0pt} & 7 \\
\hline
\rule{0pt}{2.5ex} 15-19 \rule[-1ex]{0pt}{0pt} & 5 \\
\hline
\end{array}
What is the mean number of hours of homework completed by the students per week?
- 8.0
- 8.5
- 9.0
- 9.5
Statistics, STD2 EQ-Bank 9 MC
A dataset has an interquartile range (IQR) of 18.
The upper quartile (Q₃) is 45.
What is the maximum value that would NOT be classified as an outlier?
- 63
- 68
- 70
- 72
Statistics, STD2 EQ-Bank 8 MC
The following data shows the ages of people attending a fitness class:
16, 24, 26, 28, 30, 32, 34, 36, 52, 62
How many outliers are in this dataset?
- 0
- 1
- 2
- 3
Statistics, STD2 EQ-Bank 3 MC
A dataset has a lower quartile (Q1) of 25 and an upper quartile (Q3) of 35.
Which of the following values would be classified as an outlier?
- 2
- 10
- 48
- 50
Statistics, STD2 EQ-Bank 1 MC
A dataset has the following values arranged in order:
12, 15, 18, 21, 24, 27, 30, 33, 36
What is the interquartile range (IQR) of this dataset?
- 12
- 15
- 18
- 24
Statistics, STD2 EQ-Bank 12 MC
A teacher recorded the following test scores (out of 50) for 8 students:
32, 38, 41, 44, 46, 48, 50, 50
What is the standard deviation of this set of data, correct to one decimal place?
- 5.2 marks
- 5.6 marks
- 5.9 marks
- 6.7 marks
Statistics, STD2 EQ-Bank 11 MC
A basketball player recorded the following number of points scored in 9 games:
18, 22, 25, 28, 31, 34, 38, 41, 45
What is the standard deviation of this set of data, correct to one decimal place?
- 8.5 points
- 9.1 points
- 10.2 points
- 11.5 points
Statistics, STD2 EQ-Bank 10 MC
A science class recorded the following heights (in cm) of sunflower plants after 8 weeks:
142, 156, 163, 171, 178, 185, 192, 201
What is the standard deviation of this set of data, correct to one decimal place?
- 17.8 cm
- 18.3 cm
- 20.5 cm
- 22.1 cm
Statistics, STD2 EQ-Bank 2 MC
In a small business, the seven employees earn the following wages per week:
\(\$300, \ \$490, \ \$520, \ \$590, \ \$660, \ \$680, \ \$970\)
What is the population standard deviation of the wages, correct to 2 decimal places?
- $187.25
- $191.04
- $201.58
- $215.73
Statistics, STD2 S1 2023 HSC 15 MC
Ashan's mathematics class needs to complete six tests, each worth 100 marks.
After completing the first five tests, Ashan calculated that he would need a mark of 90 in the final test in order to have a mean mark of 80 for the six tests.
What was Ashan's mean mark after completing the first five tests?
- 78
- 74
- 70
- 65
Statistics, STD2 S1 2022 HSC 5 MC
Consider the following dataset.
`{:[13,16,17,17,21,24]:}`
Which row of the table shows how the median and mean are affected when a score of 5 is added to the dataset?

Statistics, STD2 S1 2021 HSC 17
The five-number summary of a dataset is given.
Lowest score = 1
Lowest quartile (`Q_1`) = 4
Median (`Q_2`) = 7
Upper quartile (`Q_3`) = 10
Highest score = 20
Is 20 an outlier? Justify your answer with calculations. (2 marks)
--- 5 WORK AREA LINES (style=lined) ---
Statistics, STD1 S1 2020 HSC 24
- The ages in years, of ten people at the local cinema last Saturday afternoon are shown.
\(38 \ \ 25 \ \ 38 \ \ 46 \ \ 55 \ \ 68 \ \ 72 \ \ 55 \ \ 36 \ \ 38\)
- The mean of this dataset is 47.1 years.
- How many of the ten people were aged between the mean age and the median age? (2 marks)
--- 4 WORK AREA LINES (style=lined) ---
- On Wednesday, ten people all aged 70 went to this same cinema.
- Would the standard deviation of the age dataset from Wednesday be larger than, smaller than or equal to the standard deviation of the age dataset given in part (a)? Briefly explain your answer without performing any calculations. (2 marks)
--- 5 WORK AREA LINES (style=lined) ---
Statistics, STD2 S2 2020 HSC 28
Consider the following dataset.
`1 5 9 10 15`
Suppose a new value, `x`, is added to this dataset, giving the following.
`1 5 9 10 15 x`
It is known that `x` is greater than 15. It is also known that the difference between the means of the two datasets is equal to ten times the difference between the medians of the two datasets.
Calculate the value of `x`. (4 marks)
--- 8 WORK AREA LINES (style=lined) ---
Statistics, STD2 S1 2019 HSC 19
The heights, in centimetres, of 10 players on a basketball team are shown.
170, 180, 185, 188, 192, 193, 193, 194, 196, 202
Is the height of the shortest player on the team considered an outlier? Justify your answer with calculations. (3 marks)
Statistics, STD2 S1 2018 HSC 26e
A cumulative frequency table for a data set is shown.
\begin{array} {|c|c|}
\hline
\ \ \ \ \ \ \ \textit{Score}\ \ \ \ \ \ \ & \ \ \ \ \ \textit{Cumulative}\ \ \ \ \ \\ & \textit{frequency} \\
\hline
\rule{0pt}{2.5ex} \text{1} \rule[-1ex]{0pt}{0pt} & 5 \\
\hline
\rule{0pt}{2.5ex} \text{2} \rule[-1ex]{0pt}{0pt} & 9 \\
\hline
\rule{0pt}{2.5ex} \text{3} \rule[-1ex]{0pt}{0pt} & 16 \\
\hline
\rule{0pt}{2.5ex} \text{4} \rule[-1ex]{0pt}{0pt} & 20 \\
\hline
\rule{0pt}{2.5ex} \text{5} \rule[-1ex]{0pt}{0pt} & 34 \\
\hline
\rule{0pt}{2.5ex} \text{6} \rule[-1ex]{0pt}{0pt} & 42 \\
\hline
\end{array}
What is the interquartile range of this data set? (2 marks)
--- 4 WORK AREA LINES (style=lined) ---
Statistics, STD2 S1 2018 HSC 11 MC
A set of data is summarised in this frequency distribution table.

Which of the following is true about the data?
- Mode = 7, median = 5.5
- Mode = 7, median = 6
- Mode = 9, median = 5.5
- Mode = 9, median = 6
Statistics, STD2 S1 2018 HSC 1 MC
A set of scores has the following five-number summary.
lower extreme = 2
lower quartile = 5
median = 6
upper quartile = 8
upper extreme = 9
What is the range?
- 2
- 3
- 6
- 7
Statistics, STD2 S1 2017 HSC 30a
A set of data has a lower quartile (`Q_L`) of 10 and an upper quartile (`Q_U`) of 16.
What is the maximum possible range for this set of data if there are no outliers? (2 marks)
--- 4 WORK AREA LINES (style=lined) ---
Statistics, STD2 S1 2017 HSC 27a
Jamal surveyed eight households in his street. He asked them how many kilolitres (kL) of water they used in the last year. Here are the results.
`220, 105, 101, 450, 37, 338, 151, 205`
- Calculate the mean of this set of data. (1 mark)
--- 1 WORK AREA LINES (style=lined) ---
- What is the standard deviation of this set of data, correct to one decimal place? (1 mark)
--- 1 WORK AREA LINES (style=lined) ---
Statistics, STD2 S1 2016 HSC 27b
A small population consists of three students of heights 153 cm, 168 cm and 174 cm. Samples of varying sizes can be taken from this population.
What is the mean of the mean heights of all the possible samples? Justify your answer. (2 marks)
--- 4 WORK AREA LINES (style=lined) ---
Statistics, STD2 S1 2016 HSC 21 MC
A grouped data frequency table is shown.
\begin{array} {|c|c|}
\hline
\rule{0pt}{2.5ex} \textit{Class Interval} \rule[-1ex]{0pt}{0pt} & \ \ \ \ \ \textit{Frequency}\ \ \ \ \ \\
\hline
\rule{0pt}{2.5ex} \text{1 – 5} \rule[-1ex]{0pt}{0pt} & 3 \\
\hline
\rule{0pt}{2.5ex} \text{6 – 10} \rule[-1ex]{0pt}{0pt} & 6 \\
\hline
\rule{0pt}{2.5ex} \text{11 – 15} \rule[-1ex]{0pt}{0pt} & 8 \\
\hline
\rule{0pt}{2.5ex} \text{16 – 20} \rule[-1ex]{0pt}{0pt} & 9 \\
\hline
\end{array}
What is the mean for this set of data?
- 6.5
- 10.5
- 11.9
- 12.4
Statistics, STD2 S1 2016 HSC 19 MC
A soccer referee wrote down the number of goals scored in 9 different games during the season.
`2, \ 3, \ 3, \ 3, \ 5, \ 5, \ 8, \ 9, \ ...`
The last number has been omitted. The range of the data is 10.
What is the five-number summary for this data set?
- `2, 3, 5, 8.5, 12`
- `2, 3, 5, 8.5, 10`
- `2, 3, 5, 8, 12`
- `2, 3, 5, 8, 10`
Statistics, STD2 S1 2015 HSC 27d
In a small business, the seven employees earn the following wages per week:
\(\$300, \ \$490, \ \$520, \ \$590, \ \$660, \ \$680, \ \$970\)
- Is the wage of $970 an outlier for this set of data? Justify your answer with calculations. (3 marks)
--- 6 WORK AREA LINES (style=lined) ---
- Each employee receives a $20 pay increase.
What effect will this have on the standard deviation? (1 mark)
--- 2 WORK AREA LINES (style=lined) ---
Statistics, STD2 S1 2005 HSC 27d
Nine students were selected at random from a school, and their ages were recorded.
\begin{array} {|c|}
\hline
\rule{0pt}{2.5ex} \textbf{Ages} \rule[-1ex]{0pt}{0pt} \\
\hline
\rule{0pt}{2.5ex} \ \ \ \text{12 11 16} \ \ \ \rule[-1ex]{0pt}{0pt} \\ \rule{0pt}{2.5ex} \text{14 16 15} \rule[-1ex]{0pt}{0pt} \\ \rule{0pt}{2.5ex} \text{14 15 14} \rule[-1ex]{0pt}{0pt} \\
\hline
\end{array}
- What is the sample standard deviation, correct to two decimal places? (2 marks)
--- 4 WORK AREA LINES (style=lined) ---
- Briefly explain what is meant by the term standard deviation. (1 mark)
--- 2 WORK AREA LINES (style=lined) ---
Statistics, STD2 S1 2006 HSC 23c
Vicki wants to investigate the number of hours spent on homework by students at her high school.
- Briefly describe a valid method of randomly selecting 200 students for a sample. (1 mark)
--- 2 WORK AREA LINES (style=lined) ---
- Vicki chooses her sample and asks each student how many hours (to the nearest hour) they usually spend on homework during one week.
The responses are shown in the frequency table.
What is the mean amount of time spent on homework? (2 marks)
--- 4 WORK AREA LINES (style=lined) ---

Show Worked Solution
a. `text(A valid method would be using a stratified sample.)`
`text(The number of students sampled in each year is)`
`text(proportional to the size of each year.)`
MARKER’S COMMENT: This “routine” exercise of finding a mean from grouped data was incorrectly answered by most students! The best responses copied the table and inserted a class-centre column (see solution).
| b. |  |
`text(Mean)= text(Sum of Scores) / text(Total scores)= 1455/200= 7.275\ text(hours)`
Statistics, STD2 S1 2006 HSC 12 MC
The mean of a set of 5 scores is 62.
What is the new mean of the set of scores after a score of 14 is added?
- 38
- 54
- 62
- 76
Statistics, STD2 S1 2005 HSC 1 MC
What is the mean of the set of scores?
`3, \ 4, \ 5, \ 6, \ 6, \ 8, \ 8, \ 8, \ 15`
- 6
- 7
- 8
- 9
Statistics, STD2 S1 2004 HSC 6-7 MC
Use the set of scores 1, 3, 3, 3, 4, 5, 7, 7, 12 to answer Questions 6 and 7.
Question 6
What is the range of the set of scores?
- 6
- 9
- 11
- 12
Question 7
What are the median and the mode of the set of scores?
- Median 3, mode 5
- Median 3, mode 3
- Median 4, mode 5
- Median 4, mode 3
Statistics, STD2 S1 2007 HSC 24a
Consider the following set of scores:
`3, \ 5, \ 5, \ 6, \ 8, \ 8, \ 9, \ 10, \ 10, \ 50.`
- Calculate the mean of the set of scores. (1 mark)
--- 1 WORK AREA LINES (style=lined) ---
- What is the effect on the mean and on the median of removing the outlier? (2 marks)
--- 5 WORK AREA LINES (style=lined) ---
Statistics, STD2 S1 2007 HSC 21 MC
This set of data is arranged in order from smallest to largest.
`5, \ 6, \ 11, \ x, \ 13, \ 18, \ 25`
The range is six less than twice the value of `x`.
Which one of the following is true?
- The median is 12 and the interquartile range is 7.
- The median is 12 and the interquartile range is 12.
- The median is 13 and the interquartile range is 7.
- The median is 13 and the interquartile range is 12.
Statistics, STD2 S1 2008 HSC 23f
Christina has completed three Mathematics tests. Her mean mark is 72%.
What mark (out of 100) does she have to get in her next test to increase her mean mark to 73%? (2 marks)
--- 5 WORK AREA LINES (style=lined) ---
Statistics, STD2 S1 2008 HSC 13 MC
The height of each student in a class was measured and it was found that the mean height was 160 cm.
Two students were absent. When their heights were included in the data for the class, the mean height did not change.
Which of the following heights are possible for the two absent students?
- 155 cm and 162 cm
- 152 cm and 167 cm
- 149 cm and 171 cm
- 143 cm and 178 cm
Statistics, STD2 S1 2008 HSC 8 MC
What is the median of the following set of scores?

- 12
- 13
- 14
- 15
Statistics, STD2 S1 2014 HSC 14 MC
Twenty Year 12 students were surveyed. These students were asked how many hours of sport they play per week, to the nearest hour.
The results are shown in the frequency table.
\begin{array} {|c|c|}
\hline
\rule{0pt}{2.5ex} \textit{Hours per week} \rule[-1ex]{0pt}{0pt} & \ \ \ \ \ \textit{Frequency}\ \ \ \ \ \\
\hline
\rule{0pt}{2.5ex} 0-2 \rule[-1ex]{0pt}{0pt} & 5 \\
\hline
\rule{0pt}{2.5ex} 3-5 \rule[-1ex]{0pt}{0pt} & 10 \\
\hline
\rule{0pt}{2.5ex} 6-8 \rule[-1ex]{0pt}{0pt} & 3 \\
\hline
\rule{0pt}{2.5ex} 9-11 \rule[-1ex]{0pt}{0pt} & 2 \\
\hline
\end{array}
What is the mean number of hours of sport played by the students per week?
- 3.3
- 4.3
- 5.0
- 5.3
Statistics, STD2 S1 2011 HSC 17 MC
The heights of the players in a basketball team were recorded as 1.8 m, 1.83 m, 1.84 m, 1.86 m and 1.92 m. When a sixth player joined the team, the average height of the players increased by 1 centimetre.
What was the height of the sixth player?
- 1.85 m
- 1.86 m
- 1.91 m
- 1.93 m
Statistics, STD2 S1 2011 HSC 14 MC
A data set of nine scores has a median of 7.
The scores 6, 6, 12 and 17 are added to this data set.
What is the median of the data set now?
- 6
- 7
- 8
- 9
Statistics, STD2 S5 2013 HSC 29b
Ali’s class sits two Geography tests. The results of her class on the first Geography test are shown.
`58,\ \ 74,\ \ 65,\ \ 66,\ \ 73,\ \ 71,\ \ 72,\ \ 74,\ \ 62,\ \ 70`
The mean was 68.5 for the first test.
- Calculate the standard deviation for the first test. Give your answer correct to one decimal place. (1 mark)
--- 1 WORK AREA LINES (style=lined) ---
- On the second Geography test, the mean for the class was 74.4 and the standard deviation was 12.4.
Ali scored 62 on the first test. Calculate the mark that she needed to obtain in the second test to ensure that her performance relative to the class was maintained. (3 marks)
--- 6 WORK AREA LINES (style=lined) ---
Statistics, STD2 S1 2013 HSC 26b
Write down a set of six data values that has a range of 12, a mode of 12 and a minimum value of 12. (2 marks)
Statistics, STD2 S1 2009 HSC 3 MC
The eye colours of a sample of children were recorded.
When analysing this data, which of the following could be found?
- Mean
- Median
- Mode
- Range
Statistics, STD2 S1 2009 HSC 21 MC
The mean of a set of ten scores is 14. Another two scores are included and the new mean is 16.
What is the mean of the two additional scores?
- 4
- 16
- 18
- 26
Statistics, STD2 S1 2013 HSC 14 MC
The July sales prices for properties in a suburb were:
$552 000, $595 000, $607 000, $607 000, $682 000, and $685 000.
On 1 August, another property in the same suburb was sold for over one million dollars.
If the property had been sold in July, what effect would it have had on the mean and median sale prices for July?
- Both the mean and median would have changed.
- Neither the mean nor the median would have changed.
- The mean would have changed and the median would have stayed the same.
- The mean would have stayed the same and the median would have changed.