SmarterEd

Aussie Maths & Science Teachers: Save your time with SmarterEd

  • Login
  • Get Help
  • About

HMS, HAG EQ-Bank 121

Recent epidemiological data shows that Australian life expectancy decreased for the first time since the mid-1900s during 2020-2022, while simultaneously showing that males experience higher total disease burden than females across most age groups.

Explain how this data reflects current challenges in Australian population health.   (5 marks)

--- 15 WORK AREA LINES (style=lined) ---

Show Answers Only
  • The decrease in life expectancy during 2020-2022 demonstrates that infectious diseases can still significantly impact population health, as evidenced by COVID-19 becoming the third leading cause of death and disrupting decades of steady improvement.
  • This reveals that Australia’s health system faced unprecedented challenges during the pandemic, resulting in increased mortality from both COVID-19 infections and other causes due to delayed medical treatments and healthcare service disruptions.
  • The higher disease burden experienced by males across most age groups indicates that persistent gender-based health inequities remain unresolved, reflecting significant differences in health-seeking behaviours, workplace risk exposures and lifestyle choices.
  • This pattern shows that males are more likely to experience fatal burden from preventable conditions like cardiovascular disease and intentional injuries, while females experience more non-fatal burden from anxiety disorders and chronic musculoskeletal conditions.
  • The combination of these contrasting trends demonstrates that Australian population health faces both emerging infectious disease threats and entrenched chronic disease inequities that require comprehensive, multi-faceted public health interventions and targeted prevention strategies.
Show Worked Solution
  • The decrease in life expectancy during 2020-2022 demonstrates that infectious diseases can still significantly impact population health, as evidenced by COVID-19 becoming the third leading cause of death and disrupting decades of steady improvement.
  • This reveals that Australia’s health system faced unprecedented challenges during the pandemic, resulting in increased mortality from both COVID-19 infections and other causes due to delayed medical treatments and healthcare service disruptions.
  • The higher disease burden experienced by males across most age groups indicates that persistent gender-based health inequities remain unresolved, reflecting significant differences in health-seeking behaviours, workplace risk exposures and lifestyle choices.
  • This pattern shows that males are more likely to experience fatal burden from preventable conditions like cardiovascular disease and intentional injuries, while females experience more non-fatal burden from anxiety disorders and chronic musculoskeletal conditions.
  • The combination of these contrasting trends demonstrates that Australian population health faces both emerging infectious disease threats and entrenched chronic disease inequities that require comprehensive, multi-faceted public health interventions and targeted prevention strategies.

Filed Under: Current Health Status Tagged With: Band 4, smc-5474-20-Life Expectancy and Trends, smc-5474-30-Gender Inequities, smc-5474-50-Data Interpretation

HMS, HAG EQ-Bank 120

A health report shows that coronary heart disease mortality rates have declined by more than 80% since the 1960s, while cancer mortality rates have decreased by 32% over the last 30 years. However, chronic conditions now represent the vast majority of deaths in Australia.

Explain what this data reveals about Australia's health transition.   (3 marks)

--- 9 WORK AREA LINES (style=lined) ---

Show Answers Only
  • The declining mortality rates demonstrate that medical advances and prevention strategies have successfully reduced deaths from coronary heart disease and cancer.
  • However, this creates a paradox where chronic conditions still dominate mortality statistics because Australians live longer and develop multiple age-related conditions.
  • This reveals that Australia has experienced an epidemiological transition where improved survival leads to increased chronic disease burden in older populations.
Show Worked Solution
  • The declining mortality rates demonstrate that medical advances and prevention strategies have successfully reduced deaths from coronary heart disease and cancer.
  • However, this creates a paradox where chronic conditions still dominate mortality statistics because Australians live longer and develop multiple age-related conditions.
  • This reveals that Australia has experienced an epidemiological transition where improved survival leads to increased chronic disease burden in older populations.

Filed Under: Current Health Status Tagged With: Band 3, smc-5474-20-Life Expectancy and Trends, smc-5474-50-Data Interpretation

HMS, HAG EQ-Bank 113

Analyse the relationship between changes in major causes of mortality and life expectancy trends in Australia over the past century.   (8 marks)

--- 24 WORK AREA LINES (style=lined) ---

Show Answers Only

Overview Statement

The interaction between declining infectious disease mortality and rising chronic disease prevalence has shaped Australia’s life expectancy patterns, with significant relationships emerging between disease transitions and population ageing trends.

Component Relationship 1

Infectious disease control directly contributed to dramatic life expectancy increases from the early 1900s to 1995. Public health measures, vaccination programmes and antibiotics effectively eliminated tuberculosis, pneumonia and other communicable diseases as leading causes of death. This transformation resulted in Australians living longer and reaching ages where chronic conditions become prevalent. The significance of this relationship demonstrates how medical advances enabled populations to survive infectious diseases but led to exposure to age-related chronic conditions like cardiovascular disease and cancer.

Component Relationship 2

The epidemiological transition has created a paradoxical relationship where longer life expectancy coincides with increased chronic disease burden. Cancer, dementia and cardiovascular disease now dominate mortality statistics because people live long enough to develop these age-related conditions. Recent trends show life expectancy declining slightly due to COVID-19, illustrating how infectious diseases can still impact longevity patterns. This reveals that the relationship between disease patterns and life expectancy remains dynamic and influenced by emerging health threats.

Implications and Synthesis

These interconnected relationships demonstrate how disease transitions fundamentally reshape population health outcomes, requiring healthcare systems to adapt from acute care models to chronic disease management approaches for sustained life expectancy improvements.

Show Worked Solution

Overview Statement

The interaction between declining infectious disease mortality and rising chronic disease prevalence has shaped Australia’s life expectancy patterns, with significant relationships emerging between disease transitions and population ageing trends.

Component Relationship 1

Infectious disease control directly contributed to dramatic life expectancy increases from the early 1900s to 1995. Public health measures, vaccination programmes and antibiotics effectively eliminated tuberculosis, pneumonia and other communicable diseases as leading causes of death. This transformation resulted in Australians living longer and reaching ages where chronic conditions become prevalent. The significance of this relationship demonstrates how medical advances enabled populations to survive infectious diseases but led to exposure to age-related chronic conditions like cardiovascular disease and cancer.

Component Relationship 2

The epidemiological transition has created a paradoxical relationship where longer life expectancy coincides with increased chronic disease burden. Cancer, dementia and cardiovascular disease now dominate mortality statistics because people live long enough to develop these age-related conditions. Recent trends show life expectancy declining slightly due to COVID-19, illustrating how infectious diseases can still impact longevity patterns. This reveals that the relationship between disease patterns and life expectancy remains dynamic and influenced by emerging health threats.

Implications and Synthesis

These interconnected relationships demonstrate how disease transitions fundamentally reshape population health outcomes, requiring healthcare systems to adapt from acute care models to chronic disease management approaches for sustained life expectancy improvements.

Filed Under: Current Health Status Tagged With: Band 6, smc-5474-10-Morbidity and Mortality, smc-5474-20-Life Expectancy and Trends

HMS, HAG EQ-Bank 111

Explain how chronic conditions have become the dominant cause of disease burden in Australia, replacing infectious diseases as the primary health concern.   (5 marks)

--- 15 WORK AREA LINES (style=lined) ---

Show Answers Only
  • Chronic conditions have become the dominant cause of disease burden because Australia has experienced an epidemiological transition over the past century where deaths from infectious diseases declined dramatically while chronic conditions increased.
  • The reason for this is improved sanitation, vaccination programmes, antibiotics and public health measures have effectively controlled infectious diseases like tuberculosis and pneumonia.
  • As a result, Australians now live longer but develop age-related chronic conditions such as cardiovascular disease, cancer, dementia and diabetes that require long-term management.
  • This leads to chronic conditions now being responsible for the vast majority of deaths, with cancer, mental health conditions and musculoskeletal conditions emerging as the leading disease groups.
  • Consequently, the healthcare system has shifted focus from treating acute infectious episodes to managing long-term chronic diseases that cause substantial disability and premature death.
  • This demonstrates why modern Australia faces different health challenges compared to previous generations, requiring preventive strategies and lifestyle interventions rather than just medical treatments.
  • Therefore, understanding this transition helps explain current patterns of morbidity and mortality in Australian populations.

Show Worked Solution
  • Chronic conditions have become the dominant cause of disease burden because Australia has experienced an epidemiological transition over the past century where deaths from infectious diseases declined dramatically while chronic conditions increased.
  • The reason for this is improved sanitation, vaccination programmes, antibiotics and public health measures have effectively controlled infectious diseases like tuberculosis and pneumonia.
  • As a result, Australians now live longer but develop age-related chronic conditions such as cardiovascular disease, cancer, dementia and diabetes that require long-term management.
  • This leads to chronic conditions now being responsible for the vast majority of deaths, with cancer, mental health conditions and musculoskeletal conditions emerging as the leading disease groups.
  • Consequently, the healthcare system has shifted focus from treating acute infectious episodes to managing long-term chronic diseases that cause substantial disability and premature death.
  • This demonstrates why modern Australia faces different health challenges compared to previous generations, requiring preventive strategies and lifestyle interventions rather than just medical treatments.
  • Therefore, understanding this transition helps explain current patterns of morbidity and mortality in Australian populations.

Filed Under: Current Health Status Tagged With: Band 4, smc-5474-10-Morbidity and Mortality, smc-5474-20-Life Expectancy and Trends

HMS, HAG EQ-Bank 4 MC

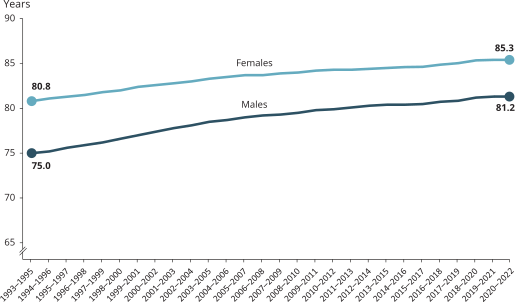
The graph below shows life expectancy trends in Australia from 1993-2022. 

Based on this data trend, which statement BEST describes what the epidemiological data reveals about recent Australian health patterns?

  1. Life expectancy has remained constant for both males and females since 1993
  2. The gender gap in life expectancy has increased significantly over this period
  3. Life expectancy steadily increased until 2020-2022 when it showed a slight decline
  4. Males consistently have higher life expectancy than females throughout this period
Show Answers Only

\(C\)

Show Worked Solution
  • C is correct: Graph shows steady increase until recent slight decline in 2020-2022.

Other Options:

  • A is incorrect: Clear upward trend visible from 1993 to 2020.
  • B is incorrect: Gender gap appears relatively stable throughout period.
  • D is incorrect: Females consistently higher than males throughout graph.

Filed Under: Current Health Status Tagged With: Band 3, smc-5474-20-Life Expectancy and Trends, smc-5474-50-Data Interpretation

HMS, HAG 2020 HSC 22

Complete the table for THREE current leading causes of mortality for males and females in Australia.   (4 marks)

--- 0 WORK AREA LINES (style=blank) ---

\begin{array}{|c|c|c|}
\hline
\rule{0pt}{2.5ex}\textit{Current leading} & \textit{Trend in mortality rate for} & \textit{Trend in mortality rate for}\\
\rule[-1ex]{0pt}{0pt}\quad \textit{cause of mortality} \quad & \textit{males over the last 10 years} & \textit{females over the last 10 years}\\
\hline
\quad & \quad &\quad\\
\hline
\quad & \quad &\quad\\
\hline
\quad & \quad &\quad\\
\hline
\end{array}

 
Show Answers Only

\(\text{Any THREE of the following}\)

\begin{array}{|l|c|c|}
\hline
\rule{0pt}{2.5ex}\quad \quad \textit{Current leading} & \textit{Trend in mortality} & \textit{Trend in mortality }\\
\quad \ \  \textit{cause of mortality} \quad & \textit{rates for males over} & \textit{rate for females }\\
\rule[-1ex]{0pt}{0pt}\quad \quad & \textit{the last 10 years} & \textit{over the last 10 years}\\
\hline
\rule{0pt}{2.5ex}\text{Coronary heart disease} \rule[-1ex]{0pt}{0pt}& \text{Decreased} & \text{Decreased} \\
\hline
\rule{0pt}{2.5ex}\text{Dementia and Alzheimer’s } & \text{Increased} & \text{Increased} \\
\rule[-1ex]{0pt}{0pt}\text{disease} & \text{} & \text{} \\
\hline
\rule{0pt}{2.5ex}\text{Cerebrovascular disease} \rule[-1ex]{0pt}{0pt}& \text{Decreased} & \text{Decreased} \\
\hline
\rule{0pt}{2.5ex}\text{Lung cancer} \rule[-1ex]{0pt}{0pt}& \text{Decreased} & \text{Decreased} \\
\hline
\rule{0pt}{2.5ex}\text{Chronic obstructive} & \text{Decreased} & \text{Decreased} \\
\rule[-1ex]{0pt}{0pt}\text{pulmonary disease} & \text{} & \text{} \\
\hline
\rule{0pt}{2.5ex}\text{Diabetes} \rule[-1ex]{0pt}{0pt}& \text{Increased} & \text{Increased} \\
\hline
\rule{0pt}{2.5ex}\text{Cardiovascular disease} \rule[-1ex]{0pt}{0pt}& \text{Decreased} & \text{Decreased} \\
\hline
\rule{0pt}{2.5ex}\text{Mental health (suicide)} \rule[-1ex]{0pt}{0pt}& \text{Increased} & \text{Increased} \\
\hline
\end{array}

Show Worked Solution

\(\text{Any THREE of the following}\)

\begin{array}{|l|c|c|}
\hline
\rule{0pt}{2.5ex}\quad \quad \textit{Current leading} & \textit{Trend in mortality} & \textit{Trend in mortality }\\
\quad \ \  \textit{cause of mortality} \quad & \textit{rates for males over} & \textit{rate for females }\\
\rule[-1ex]{0pt}{0pt}\quad \quad & \textit{the last 10 years} & \textit{over the last 10 years}\\
\hline
\rule{0pt}{2.5ex}\text{Coronary heart disease} \rule[-1ex]{0pt}{0pt}& \text{Decreased} & \text{Decreased} \\
\hline
\rule{0pt}{2.5ex}\text{Dementia and Alzheimer’s } & \text{Increased} & \text{Increased} \\
\rule[-1ex]{0pt}{0pt}\text{disease} & \text{} & \text{} \\
\hline
\rule{0pt}{2.5ex}\text{Cerebrovascular disease} \rule[-1ex]{0pt}{0pt}& \text{Decreased} & \text{Decreased} \\
\hline
\rule{0pt}{2.5ex}\text{Lung cancer} \rule[-1ex]{0pt}{0pt}& \text{Decreased} & \text{Decreased} \\
\hline
\rule{0pt}{2.5ex}\text{Chronic obstructive} & \text{Decreased} & \text{Decreased} \\
\rule[-1ex]{0pt}{0pt}\text{pulmonary disease} & \text{} & \text{} \\
\hline
\rule{0pt}{2.5ex}\text{Diabetes} \rule[-1ex]{0pt}{0pt}& \text{Increased} & \text{Increased} \\
\hline
\rule{0pt}{2.5ex}\text{Cardiovascular disease} \rule[-1ex]{0pt}{0pt}& \text{Decreased} & \text{Decreased} \\
\hline
\rule{0pt}{2.5ex}\text{Mental health (suicide)} \rule[-1ex]{0pt}{0pt}& \text{Increased} & \text{Increased} \\
\hline
\end{array}


♦♦ Mean mark 47%.

Filed Under: Chronic Conditions, Diseases and Injury, Current Health Status Tagged With: Band 5, smc-5474-10-Morbidity and Mortality, smc-5474-20-Life Expectancy and Trends, smc-5477-15-Other Conditions and Injury, smc-5477-30-Groups and Changing Patterns

Copyright © 2014–2026 SmarterEd.com.au · Log in