SmarterEd

Aussie Maths & Science Teachers: Save your time with SmarterEd

  • Login
  • Get Help
  • About

Probability, STD2 EQ-Bank 31

A survey of 60 people found the following information about their exercise habits.

  • 35 enjoy hiking \((H)\)
  • 28 enjoy cycling \((C)\)
  • 8 enjoy neither hiking nor cycling
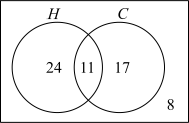
  1. Draw a Venn diagram to represent this information.   (2 marks)

    --- 8 WORK AREA LINES (style=lined) ---

  2. One person is selected at random. What is the probability that the person enjoys hiking or cycling?   (1 mark)

    --- 3 WORK AREA LINES (style=lined) ---

Show Answers Only

a.    
b.    \(\dfrac{13}{15}\)

Show Worked Solution

a.    \(\text{Number in either }H\text{ or }C = 60-8 = 52\)

\(\text{Number in both }H\text{ and }C = 35+28-52 = 11\)

\(H\text{ only} = 35-11 = 24\)

\(C\text{ only} = 28-11 = 17\)
  

b.    \(P(H \text{ or } C) = \dfrac{24+11+17}{60} = \dfrac{52}{60} = \dfrac{13}{15}\)

\(\text{OR, using the complement:}\)

\(P(H \text{ or } C) = 1-\dfrac{8}{60} = \dfrac{13}{15}\)
Filed Under: Venn Diagrams and Expected/Relative Frequency Tagged With: Band 4, Band 5, smc-6936-10-Venn Diagrams, syllabus-2027

Probability, STD2 EQ-Bank 5 MC

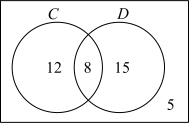
The Venn diagram shows information about 40 people surveyed about whether they own a dog \((D)\) or a cat \((C)\).

Which two-way table correctly represents the information in the Venn diagram?

A.      \(\begin{array}{|l|c|c|c|} \hline & D & \text{Not }D & \text{Total} \\ \hline C & 12 & 8 & 20 \\ \hline \text{Not }C & 5 & 15 & 20 \\ \hline \text{Total} & 17 & 23 & 40 \\ \hline \end{array}\) B.    \(\begin{array}{|l|c|c|c|} \hline & D & \text{Not }D & \text{Total} \\ \hline C & 8 & 12 & 20 \\ \hline \text{Not }C & 15 & 5 & 20 \\ \hline \text{Total} & 23 & 17 & 40 \\ \hline \end{array}\)
C.    \(\begin{array}{|l|c|c|c|} \hline & D & \text{Not }D & \text{Total} \\ \hline C & 15 & 12 & 27 \\ \hline \text{Not }C & 8 & 5 & 13 \\ \hline \text{Total} & 23 & 17 & 40 \\ \hline \end{array}\) D.    \(\begin{array}{|l|c|c|c|} \hline & D & \text{Not }D & \text{Total} \\ \hline C & 5 & 12 & 17 \\ \hline \text{Not }C & 15 & 8 & 23 \\ \hline \text{Total} & 20 & 20 & 40 \\ \hline \end{array}\)
Show Answers Only

\(B\)

Show Worked Solution

\(\text{Reading the Venn diagram:}\)

\(\text{C and D (intersection)} = 8\)

\(\text{C only (not D)} = 12\)

\(\text{D only (not C)} = 15\)

\(\text{Neither} = 5\)
  

\(\text{In the two-way table:}\)

\(\text{Row }C\text{: }\ D\text{ column} = 8,\ \text{Not }D\text{ column} = 12,\ \text{Total} = 20\)

\(\text{Row Not }C\text{: }\ D\text{ column} = 15,\ \text{Not }D\text{ column} = 5,\ \text{Total} = 20\)
  

\(\Rightarrow B\)

Filed Under: Venn Diagrams and Expected/Relative Frequency Tagged With: Band 4, smc-6936-10-Venn Diagrams, smc-6936-20-Two-way Tables, smc-6936-25-Venn/2-way Table Transfer, syllabus-2027

Probability, STD2 EQ-Bank 2 MC

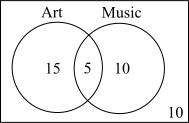
The Venn diagram shows information about 40 students and the subjects they study.
  

One student is selected at random.

What is the probability that the student studies Art but not Music?

  1. \(\dfrac{1}{8}\)
  2. \(\dfrac{1}{4}\)
  3. \(\dfrac{3}{8}\)
  4. \(\dfrac{1}{2}\)
Show Answers Only

\(C\)

Show Worked Solution

\(\text{Number studying Art but not Music} = 15\)

\(\text{Total students} = 15+5+10+10=40\)

\(P(\text{Art but not Music}) = \dfrac{15}{40} = \dfrac{3}{8}\)
  

\(\Rightarrow C\)

Filed Under: Venn Diagrams and Expected/Relative Frequency Tagged With: Band 3, smc-6936-10-Venn Diagrams, syllabus-2027

Probability, STD2 EQ-Bank 28

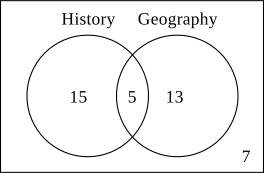
History and Geography are two of the subjects students may decide to study. For a group of 40 students, the following is known.

    • 7 students study neither History nor Geography
    • 20 students study History
    • 18 students study Geography
  1. Draw a Venn diagram that represents the information given, and hence find the number of students that study both History and Geography.   (2 marks)

    --- 6 WORK AREA LINES (style=lined) ---

  2. A student is chosen at random. Determine the probability that the students studies Geography only.   (1 mark)

    --- 3 WORK AREA LINES (style=lined) ---

Show Answers Only

a.    \(\text{Venn diagram:}\)

\(n\text{(study H and G)}= 5\)
 

b.    \(P(\text{study G only}) = \dfrac{13}{40}=32.5\% \)

Show Worked Solution

a.    \(\text{Venn diagram:}\)

\(n\text{(study H and G)}= 5\)
 

b.    \(P(\text{study G only}) = \dfrac{13}{40}=32.5\% \)

Filed Under: Venn Diagrams and Expected/Relative Frequency Tagged With: Band 4, Band 5, smc-6936-10-Venn Diagrams, syllabus-2027

Probability, STD2 EQ-Bank 30

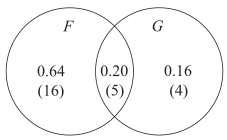
In a workplace of 25 employees, each employee speaks either French or German, or both.

If 36% of the employees speak German, and 20% speak both French and German.

  1. Draw a Venn diagram that represents the information given.   (2 marks)

    --- 6 WORK AREA LINES (style=lined) ---

  2. If one person is chosen at random, what is the probability they can speak French but cannot speak German?   (2 marks)

    --- 4 WORK AREA LINES (style=lined) ---

Show Answers Only

a.    `text(Venn diagram:)`


b.    \(\text{Number who can speak French but not German = 16}\)

\(P(F\ \text{but not}\ G)=\dfrac{16}{25} = 64\%\)

Show Worked Solution

a.    `text(Venn diagram:)`


b.    \(\text{Number who can speak French but not German = 16}\)

\(P(F\ \text{but not}\ G)=\dfrac{16}{25} = 64\%\)

Filed Under: Venn Diagrams and Expected/Relative Frequency Tagged With: Band 4, Band 5, smc-6936-10-Venn Diagrams, syllabus-2027

Probability, STD2 EQ-Bank 22

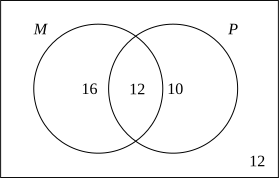
A survey of 50 students found that:

  • 28 students study Mathematics (set \(M\))
  • 22 students study Physics (set \(P\) )
  • 12 students study both Mathematics and Physics.
  1. Draw a Venn diagram to represent this information.   (2 marks)

    --- 6 WORK AREA LINES (style=lined) ---

  2. How many students study Mathematics but not Physics?   (1 mark)

    --- 2 WORK AREA LINES (style=lined) ---

  3. If a student is chosen at random, what is the probability that they do not study either subject?   (1 mark)

    --- 2 WORK AREA LINES (style=lined) ---

Show Answers Only

a.


b.    \(\text{Using the Venn diagram:}\)

\(\text{Number who study Maths but not physics = 16}\)
 

c.    \(P(\text{study both}) = \dfrac{12}{50}=24\%\)

Show Worked Solution

a.


b.    \(\text{Using the Venn diagram:}\)

\(\text{Number who study Maths but not physics = 16}\)
 

c.    \(P(\text{study neither}) = \dfrac{12}{50}=24\%\)

Filed Under: Venn Diagrams and Expected/Relative Frequency Tagged With: Band 4, smc-6936-10-Venn Diagrams, syllabus-2027

Probability, STD2 EQ-Bank 20

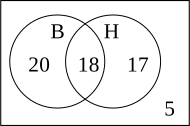
In a group of 60 students, 38 play basketball, 35 play hockey and 5 do not play either basketball or hockey.

  1. Draw a Venn diagram to represent the information given.   (2 marks)

    --- 5 WORK AREA LINES (style=lined) ---

  2. What percentage of students play both basketball and hockey?   (1 mark)

    --- 4 WORK AREA LINES (style=lined) ---

Show Answers Only

a.    

 
b.
    \(\text{From the diagram, 18 students play both sports.}\)

\(\text{Percentage}\ = \dfrac{18}{60} \times 100 = 30\%\)

Show Worked Solution

a.    

 
b.
    \(\text{From the diagram, 18 students play both sports.}\)

\(\text{Percentage}\ = \dfrac{18}{60} \times 100 = 30\%\)

Filed Under: Venn Diagrams and Expected/Relative Frequency Tagged With: Band 4, smc-6936-10-Venn Diagrams, syllabus-2027

Probability, STD2 EQ-Bank 32

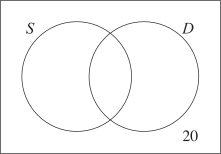
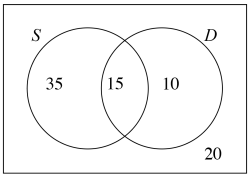
In Year 11 there are 80 students. Of these, 50 play a sport \((S), 25\) are involved in debating ( \(D\) ), and 20 do neither.

  1. Using this information, complete the Venn diagram.   (2 marks)


  1. A Year 11 student is selected at random.
  2. What is the probability that the student plays a sport and is involved in debating?   (1 mark)

    --- 2 WORK AREA LINES (style=lined) ---

  3. Two Year 11 students are selected at random.
  4. What is the probability that both students are involved in debating only?   (2 marks)

    --- 3 WORK AREA LINES (style=lined) ---

Show Answers Only

a.    \(\text{Venn diagram}\)


b.    \(\dfrac{3}{16}\)

c.    \(\dfrac{9}{632} \)

Show Worked Solution

a.    \(\text{Venn diagram}\)


b.    \(\text{Using the Venn diagram:}\)

\(P\text{(plays both)} = \dfrac{15}{80}=\dfrac{3}{16}\)
 

c.    \(P\text{(both students involved in debating only)}\)

\(=\dfrac{10}{80} \times\ \dfrac{9}{79}=\dfrac{9}{632} (\approx 0.0142)\)

Filed Under: Venn Diagrams and Expected/Relative Frequency Tagged With: Band 4, Band 5, smc-6936-10-Venn Diagrams, syllabus-2027

Copyright © 2014–2026 SmarterEd.com.au · Log in