The Venn diagram shows information about 40 people surveyed about whether they own a dog \((D)\) or a cat \((C)\).
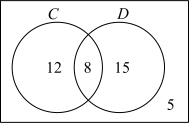
Which two-way table correctly represents the information in the Venn diagram?
| A. | \(\begin{array}{|l|c|c|c|} \hline & D & \text{Not }D & \text{Total} \\ \hline C & 12 & 8 & 20 \\ \hline \text{Not }C & 5 & 15 & 20 \\ \hline \text{Total} & 17 & 23 & 40 \\ \hline \end{array}\) | B. | \(\begin{array}{|l|c|c|c|} \hline & D & \text{Not }D & \text{Total} \\ \hline C & 8 & 12 & 20 \\ \hline \text{Not }C & 15 & 5 & 20 \\ \hline \text{Total} & 23 & 17 & 40 \\ \hline \end{array}\) |
| C. | \(\begin{array}{|l|c|c|c|} \hline & D & \text{Not }D & \text{Total} \\ \hline C & 15 & 12 & 27 \\ \hline \text{Not }C & 8 & 5 & 13 \\ \hline \text{Total} & 23 & 17 & 40 \\ \hline \end{array}\) | D. | \(\begin{array}{|l|c|c|c|} \hline & D & \text{Not }D & \text{Total} \\ \hline C & 5 & 12 & 17 \\ \hline \text{Not }C & 15 & 8 & 23 \\ \hline \text{Total} & 20 & 20 & 40 \\ \hline \end{array}\) |