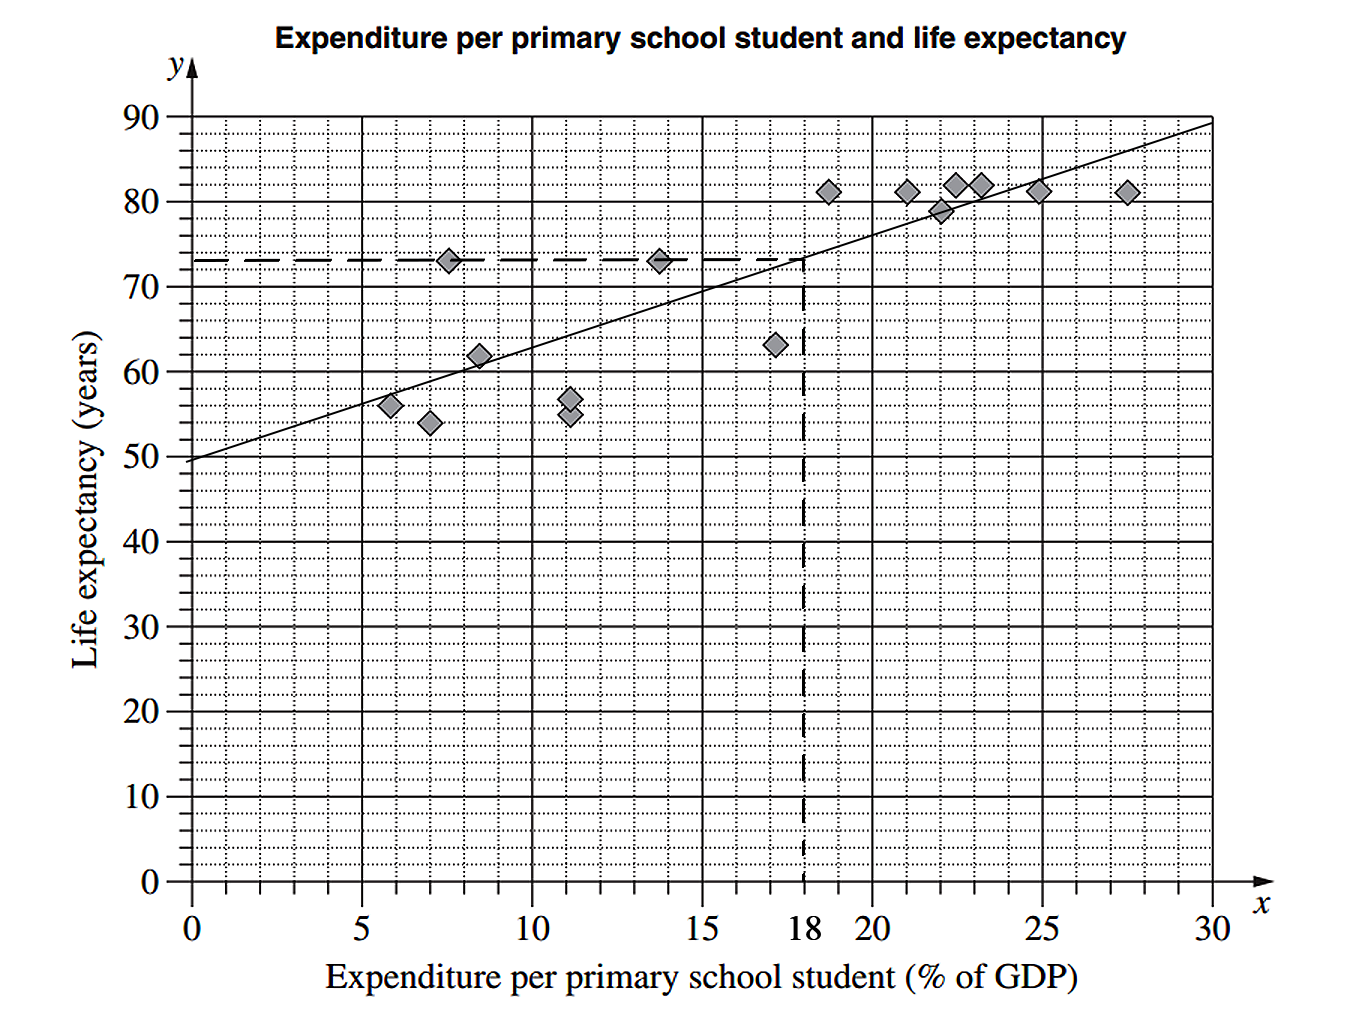
The scatterplot shows the relationship between expenditure per primary school student, as a percentage of a country’s Gross Domestic Product (GDP), and the life expectancy in years for 15 countries.

- For the given data, the correlation coefficient, `r`, is 0.83. What does this indicate about the relationship between expenditure per primary school student and life expectancy for the 15 countries? (1 mark)
--- 1 WORK AREA LINES (style=lined) ---
- For the data representing expenditure per primary school student, `Q_L` is 8.4 and `Q_U` is 22.5.
What is the interquartile range? (1 mark)
--- 1 WORK AREA LINES (style=lined) ---
- Another country has an expenditure per primary school student of 47.6% of its GDP.
Would this country be an outlier for this set of data? Justify your answer with calculations. (2 marks)
--- 4 WORK AREA LINES (style=lined) ---
- On the scatterplot, draw the least-squares line of best fit `y = 1.29x + 49.9`. (2 marks)
--- 4 WORK AREA LINES (style=lined) ---
- Using this line, or otherwise, estimate the life expectancy in a country which has an expenditure per primary school student of 18% of its GDP. (1 mark)
--- 1 WORK AREA LINES (style=lined) ---
- Why is this line NOT useful for predicting life expectancy in a country which has expenditure per primary school student of 60% of its GDP? (1 mark)
--- 1 WORK AREA LINES (style=lined) ---
- `text(It indicates there is a strong positive)`
`text(correlation between the two variables.)`
- `14.1`
- `text(Yes, because it’s > 43.65%)`
-
- `73.1\ text(years)`
- `text(At 60% GDP, the line predicts a life expectancy)`
-
`text(of 127.3. This line of best fit is only accurate)`
-
`text(in a lower range of GDP expediture.)`
| i. | `text(It indicates there is a strong positive)` |
| `text(correlation between the two variables)` |
| ii. | `text(IQR)` | `= Q_U\ – Q_L` |
| `= 22.5\ – 8.4` | ||
| `= 14.1` |
iii. `text(An outlier on the upper side must be more than)`
`Q_u\ +1.5xxIQR`
`=22.5+(1.5xx14.1)`
`=\ text(43.65%)`
`:.\ text(A country with an expenditure of 47.6% is an outlier).`
| iv. |  |
v. `text(Life expectancy) ~~ 73.1\ text{years (see dotted line)}`
`text(Alternative Solution)`
`text(When)\ x=18`
`y=1.29(18)+49.9=73.12\ \ text(years)`
COMMENT: Examiners regularly ask students to identify and comment on outliers where linear relationships break down.
| vi. | `text(At 60% GDP, the line predicts a life)` |
| `text(expectancy of 127.3. This line of best)` | |
| `text(fit is only predictive in a lower range)` | |
| `text(of GDP expenditure.)` |


