SmarterEd

Aussie Maths & Science Teachers: Save your time with SmarterEd

  • Login
  • Get Help
  • About

Linear Functions, 2UA 2012 HSC 5 MC

What is the perpendicular distance of the point  `(2, –1)`  from the line  `y = 3x + 1`?

(A)   `6/sqrt10`  

(B)   `6/sqrt5`  

(C)   `8/sqrt10`  

(D)   `8/sqrt5` 

Show Answers Only

`C`

Show Worked Solution

`P(2,-1)\ ,`

`y=3x+1 \ =>\ 3x\-y + 1=0`

`_|_ text(dist)` `= | (ax_1 + by_1 + c)/sqrt(a^2 + b^2) |`
  `= | (3(2)\-1(-1) + 1)/sqrt(3^2 + (-1)^2) |`
  `= 8/sqrt10`

`=>  C`

Filed Under: 6. Linear Functions Tagged With: Band 4

Calculus, 2ADV C3 2012 HSC 4 MC

The diagram shows the graph  `f(x)`.
 

2012 4 mc
 

Which of the following statements is true? 

  1. `f^{′}(a)>0\ \ text(and)\ \ f^{″}(a)<0`  
  2. `f^{′}(a)>0\ text(and)\ \ f^{″}(a)>0`  
  3. `f^{′}(a)<0\ \ text(and)\ \ f^{″}(a)<0`  
  4.  `f^{′}(a)<0\ \ text(and)\ \ f^{″}(a)>0`  
Show Answers Only

`A`

Show Worked Solution

`text(At)\ \ x=a,`

`f^{′}(a) > 0\ \ \ :.\ text(Cannot be)\ C\ text(or)\ D`

`f^{″}(a) < 0\ \ text(because)\ \ f(x)\ text(is concave down at)\ x=a`

`:.\ text(Cannot be)\ B`

`=>  A`

Filed Under: Curve Sketching and The Primitive Function, The Derivative Function and its Graph (Y12) Tagged With: Band 4, smc-1089-40-Investigate Graph Shapes

Plane Geometry, 2UA 2013 HSC 16c

The diagram shows triangles  `ABC`  and  `ABD`  with  `AD`  parallel to  `BC`. The sides  `AC`  and  `BD`  intersect at  `Y`. The point  `X`  lies on  `AB`  such that  `XY`  is parallel to  `AD`  and  `BC`.

2UA 2013 HSC 16c

  1. Prove that  `Delta ABC`  is similar to  `Delta AXY`.   (2 marks)
  2. Hence, or otherwise, prove that  `1/(XY) = 1/(AD) + 1/(BC)`.   (2 marks)
Show Answers Only
  1. `text(Proof)\ \ text{(See Worked Solutions)}`
  2. `text(Proof)\ \ text{(See Worked Solutions)}`
Show Worked Solution
(i)   2UA 2013 HSC 16c Answer

`text(Prove)\ Delta ABC\ text(|||)\ Delta AXY`

COMMENT: A great example of easy marks that appear in the early stages of the final questions.

`/_YAX\ text(is common)`

`/_AYX= /_ACB\ \ \ text{(corresponding,  YX || CB)}`

`:.\ Delta ABC\ text(|||)\ Delta AXY\ \ \ text{(equiangular)}`


(ii)  `text(Need to prove)\ 1/(XY) = 1/(AD) + 1/(BC)`

♦♦♦ Mean mark 13%.
COMMENT: The presence of `AD` in the required proof should alert students to the strategy of finding another set of congruent triangles where this side can be utilised.

`text(Using part)\ text{(i)}`

`=>(AX)/(AB) = (XY)/(BC)`

`text(Similarly,)\ Delta ABD\ text(|||)\ Delta XBY\ \ text{(equiangular)}`

`(BX)/(AB) = (XY)/(AD)`

`text(Adding the identities)`

`(AX)/(AB) + (BX)/(AB)` `= (XY)/(BC) + (XY)/(AD)`
`( (AX + BX) )/(AB)` `= XY (1/(BC) + 1/(AD) )`
`(AB)/(AB)` `= XY (1/(AD) + 1/(BC))\ \ \ \ (text(Note)\ AX + BX = AB text{)}`
 `1` `= XY (1/(AD) + 1/(BC))` 
 `1/(XY)` `= 1/(AD) + 1/(BC)\ \ \ text(… as required)` 

Filed Under: 2. Plane Geometry Tagged With: Band 4, Band 6

Calculus, 2ADV C4 2013 HSC 16a

The derivative of a function `f(x)` is  `f^{′}(x) = 4x-3`.  The line  `y = 5x-7`  is tangent to the graph `f(x)`.

Find the function `f(x)`.   (3 marks) 

--- 6 WORK AREA LINES (style=lined) ---

Show Answers Only

`f(x) = 2x^2-3x + 1`

Show Worked Solution

`text(Solution 1)`

`f^{′}(x)` `=4x-3`
`f(x)` `= int 4x-3\ dx`
  `= 2x^2-3x + c`

 
`text(Intersection when)`

`2x^2-3x + c = 5x-7`

`2x^2-8x + (7 + c) = 0`

  
`text(S)text(ince)\ \ y=5x-7\ \ text(is a tangent)\ => Delta =0`

`b^2-4ac` `=0`
`(-8)^2-[4xx2xx(7+c)]` `= 0`
`64-56-8c` `=8`
`8c` `=8`
`c` `=1`

 
`:.f(x) = 2x^2-3x + 1`

 
`text(Solution 2)`

`f^{′}(x)=4x-3`

`y=5x-7\ \ text{(Gradient = 5)}`

`=>4x-3` `=5`
`x` `=2`

 
`f(x) = 2x^2-3x + 1`

`f(x)\ text{passes through (2, 3)}`

`f(2)` `=2xx 2^2-3(2)+c`
`3` `=8-6+c`
`c` `=1`

 
`:.f(x) = 2x^2-3x + 1`

Filed Under: Other Integration Applications (Y12), Tangents and Normals Tagged With: Band 4, smc-1090-10-Quadratic Function, smc-1090-50-Find curve given tangent, smc-1213-25-Tangents/Primitive function

Integration, 2UA 2013 HSC 15a

The diagram shows the front of a tent supported by three vertical poles. The poles are 1.2 m apart. The height of each outer pole is 1.5 m, and the height of the middle pole is 1.8 m. The roof hangs between the poles.

2013 15a

The front of the tent has area `A\ text(m²)`. 

  1. Use the trapezoidal rule to estimate  `A`.    (1 mark)
  2. Use Simpson’s rule to estimate  `A`.     (1 mark)
  3. Explain why the trapezoidal rule gives the better estimate of  `A`.    (1 mark)
Show Answers Only
  1. `3.96\ text(m²)`
  2. `4.08\ text(m²)`
  3. 2UA 2013 15a ans
  4. `text(S)text(ince the tent roof is concave up, the)`
  5. `text(trapezoidal rule uses straight lines and Simpson’s)`
  6. `text(Rule assumes a concave down arc, the trapezoidal)`
  7. `text(rule will be more accurate)\ text{(as per diagram)}`
Show Worked Solution
(i)    `A` `~~ h/2 [y_0 + 2y_1 + y_2]`
    `~~ 1.2/2 [1.5 + (2 xx 1.8) + 1.5]`
    `~~ 0.6 [6.6]`
    `~~ 3.96\ text(m²)`


(ii)    `A` `~~ h/3 [y_0 + 4y_1 + y_2]`
    `~~1.2/3 [1.5 + (4 xx 1.8) + 1.5]`
    `~~ 0.4 [10.2]`
    `~~ 4.08\ text(m²)`


♦♦♦ This proved the hardest mark to get in the whole 2013 HSC paper with a mean mark of just 3%!
MARKER’S COMMENT: Ensure you understand the different lines that result from using Simpson’s Rule vs the Trapezoidal Rule. Drawing a sketch is often the clearest way to explain (see Worked Solutions).


(iii)  
    2UA 2013 15a ans

`text(S)text(ince the tent roof is concave up, the)`

`text(trapezoidal rule uses straight lines and Simpson’s)`

`text(Rule assumes a concave down arc, the trapezoidal)`

`text(rule will be more accurate)\ text{(as per diagram)}`

Filed Under: Trapezoidal and Simpson's Rule Tagged With: Band 4, Band 6

Trigonometry, 2ADV T1 2013 HSC 13c

The region  `ABC`  is a sector of a circle with radius 30 cm, centred at  `C`. The angle of the sector is  `theta`. The arc  `DE`  lies on a circle also centred at  `C`, as shown in the diagram.
 

2013 13c

The arc  `DE`  divides the sector  `ABC`  into two regions of equal area.

Find the exact length of the interval  `CD`.   (2 marks)

--- 5 WORK AREA LINES (style=lined) ---

Show Answers Only

 `15sqrt2\ text(cm.)`

Show Worked Solution
`text(Area of sector)\ ABC` `=1/2 r^2 theta`
  `=1/2 xx 30^2 xx theta`
  `= 450 theta`

`text(Let)\ CD = x`

MARKER’S COMMENT: Simply finding the area of sector `ABC` achieved half marks in this challenging question! Show your working.

`text(Area of sector)\ CDE = 1/2 x^2 theta`

`text(S)text(ince)\ DE\ text(divides sector)\ ABC\ text(in half,)`

`text(Area sector)\ CDE` `= 1/2 xx text(Area sector)\ ABC`
`1/2 x^2 theta` `= 1/2 xx 450 theta`
`x^2` `=450`
`x` `=sqrt450\ \ \ \ \ \ (x>0)`
  `= 15 sqrt2\ text(cm)`


`:.\ text(The exact length of interval)\ CD\ text(is)\ 15 sqrt2\ text(cm.)`

Filed Under: Circular Measure, Circular Measure (Adv-2027), Circular Measure (Y11) Tagged With: Band 4, smc-6394-20-Area of Sector, smc-978-20-Area of Sector

Calculus, 2ADV C4 2013 HSC 13b

The diagram shows the graphs of the functions  `f(x) = 4x^3-4x^2 +3x`  and  `g(x) = 2x`. The graphs meet at  `O`  and at  `T`.
 

2013 13b

  1. Find the  `x`-coordinate of  `T`.   (1 mark)

    --- 2 WORK AREA LINES (style=lined) ---

  2. Find the area of the shaded region between the graphs of the functions  `f(x)`  and  `g(x)`.   (3 marks)

    --- 6 WORK AREA LINES (style=lined) ---

Show Answers Only
  1. `T\ text(is)\ (1/2, 1)`
  2. `text(Shaded area between the curves is)\ 1/48\ text(u²)`
Show Worked Solution
i. `T\ text(occurs when)\ \ f(x) = g(x)`
`4x^3-4x^2 + 3x` `=2x`
`4x^3-4x^2 + x` `=0`
`x(4x^2-4x + 1)` `=0`
`x(2x-1)^2` `=0`


`2x-1=0 \ \ => \ x=1/2`

`text(Substitute)\ \ x=1/2\ \ text(into)\ g(x)`

`g(1/2) = 2 xx 1/2 = 1`

`:.\ T (1/2, 1)`


ii. `text(Shaded Area)` `= int_0^(1/2) (f(x)-g(x)) \ dx`
    `= int_0^(1/2) (4x^3-4x^2 + x) \ dx`
    `= [x^4-4/3x^3 + 1/2x^2]_0^(1/2)`
    `= [((1/2)^4-4/3(1/2)^3 + 1/2(1/2)^2)-0]`
    `= 1/16-1/6 + 1/8`
    `= 1/48\ text(u²)`

 
`:.\ text(Shaded area between the curves is)\ 1/48\ text(u²)`

Filed Under: Areas Under Curves, Areas Under Curves (Y12) Tagged With: Band 4, smc-975-20-Cubic

Trigonometry, 2ADV T3 2013 HSC 13a

The population of a herd of wild horses is given by

`P(t) = 400 + 50 cos (pi/6 t)`

where  `t`  is time in months. 

  1. Find all times during the first 12 months when the population equals 375 horses.    (2 marks)

    --- 5 WORK AREA LINES (style=lined) ---

  2. Sketch the graph of  `P(t)`  for  `0 <= t <= 12`.    (2 marks)

    --- 8 WORK AREA LINES (style=lined) ---

Show Answers Only
  1. `t=4\ text(months and 8 months)`
  2. `text(See Worked Solutions.)`
Show Worked Solution

i.  `P(t) = 400 + 50 cos (pi/6 t)`

`text(Need to find)\ t\ text(when)\ P(t) = 375`

`375` `= 400 + 50 cos (pi/6 t)`
`50 cos (pi/6 t)` `=-25`
`cos (pi/6 t)` `= – 1/2`
   
`text(S)text(ince)\ \ cos(pi/3)=1/2, text(and cos is)`
`text(negative in)\ 2^text(nd) // 3^text(rd)\ text(quadrants:)`
`=>pi/6 t` `= (pi\ – pi/3),\ (pi + pi/3),\ (3pi\ – pi/3)`
  `= (2pi)/3,\ (4pi)/3,\ (8pi)/3,\ …`
`:.t` `= 4,\ 8,\ 16,\ …`

 
`:.\ text(In the 1st 12 months,)\ P(t) = 375\ text(when)`

`t=4\ text(months and 8 months.)`


♦ Mean mark 39%
ii. 2UA 2013 13a ans

Filed Under: Exact Trig Ratios and Other Identities, Trig Applications (Y12), Trig graphs Tagged With: Band 4, Band 5, smc-1188-10-Population

Linear Functions, 2UA 2013 HSC 12b

The points  `A(–2, –1)`,  `B(–2, 24)`,  `C(22, 42)` and  `D(22, 17)` form a parallelogram as shown. The point  `E(18, 39)` lies on  `BC`. The point  `F`  is the midpoint of  `AD`.
 

2013 12b
 

  1. Show that the equation of the line through  `A`  and  `D`  is  `3x- 4y + 2 = 0`.    (2 marks)
  2. Show that the perpendicular distance from  `B`  to the line through  `A`  and  `D`  is  `20`  units.   (1 mark)
  3. Find the length of  `EC`.    (1 mark)
  4. Find the area of the trapezium  `EFDC`.    (2 marks)
Show Answers Only
  1. `3x-4y+2=0`
  2. `text(Proof)\  text{(See Worked Solutions)}`
  3. `text(5 units)`
  4. `200\  text(u²)`
Show Worked Solution
(i)    `text(Need to find the equation of)\ AD`
`m_(AD)` `= (y_2\-y_1)/(x_2\-x_1)`
  `= (17+1)/(22+2)`
  `= 18/24`
  `= 3/4`

`text(Equation of)\ AD\ text(has)\ m=3/4 text(, through)\ A text{(–2,–1)}`

`text(Using)\ y\-y_1` `= m (x\-x_1)`
`y+1` `=3/4 (x +2)`
`4y+4` `=3x+6`
`3x-4y+2` `=0`
MARKER’S COMMENT: Students must know the perpendicular distance formula which was again the cause of many errors such that it was flagged by markers.
 

(ii)    `B(–2,24)`
  `AD\ text(is)\  \ 3x -4y+2 =0`
`_|_ text(dist)` `= | (ax_1 + by_1 + c)/sqrt(a^2 + b^2) |`
  `= | (3(–2)\-4(24) + 2)/sqrt(3^2 + (–4)^2 )|`
  `= | (-6\ -96 +2)/sqrt25 |`
  `= | -100/5 |`
  `= 20\ text(units)`


`:.\ _|_ text(dist of)\ B\ text(from)\ AD = 20\ text(units   … as required)`


(iii)   `E(18,39)\ \ \ C(22,42)`
`EC` `=sqrt ( (x_2\-x_1)^2 + (y_2\-y_1)^2 )`
  `= sqrt ( (22\-18)^2 + (42\-39)^2 )`
  `= sqrt (4^2 + 3^2)`
  `= sqrt25`
  `= 5\ text(units)`


`:.\ text(The length of)\ EC\ text(is 5 units.)`


(iv)    `text(Area of trapezium)` `=1/2 h (a+b)`
    `=1/2 h (EC + FD)`

`EC = 5\ text(units)`

 MARKER’S COMMENT: One of the most common cause of errors in this part occurred when students failed to use the result found in part (ii).

`text(Need to find)\ FD`

`text(S)text(ince)\ FD = 1/2 xx AD\ \ \ ( F\ text(is midpoint) )`

`A (–2,–1)\ \ D(22,17)`

`AD` `=sqrt( (22 + 2) + (17 + 1)^2 )`
  `= sqrt (24^2 + 18^2)`
  `= sqrt (900)`
  `= 30`

`=> FD = 1/2 xx 30 = 15`

`text(S)text(ince)\ ABCD\ text(is a parallelogram)`

`h` `= _|_ text(distance in part)\ text{(i)}`
  `= 20`
`:.\ text(Area of trapezium)` `=1/2 xx 20 (5 + 15)`
  `=200\  text(u²)`

Filed Under: 6. Linear Functions Tagged With: Band 2, Band 3, Band 4

Functions, EXT1* F1 2013 HSC 11g

Sketch the region defined by  `(x-2)^2 + ( y-3)^2 >= 4`.    (3 marks)

--- 10 WORK AREA LINES (style=lined) ---

Show Answers Only

Show Worked Solution

`text(The region is the exterior of a circle,)`

COMMENT: This past “Advanced” HSC question now fits into the Ext1 (new) syllabus.

`text(centre)\ text{(2,3)}\ text(and radius 2.)`
 

Filed Under: 4. Real Functions, Functions and Other Graphs, Inequalities (Ext1-2027), Inequalities (Ext1) Tagged With: Band 4, num-title-ct-extension, num-title-qs-hsc, smc-1033-40-Regions, smc-6643-40-Regions

Calculus, 2ADV C1 2013 HSC 11b

Evaluate  `lim_(x->2) ((x-2)(x+2)^2)/(x^2-4)`.   (2 marks)

--- 5 WORK AREA LINES (style=lined) ---

Show Answers Only

 `4`

Show Worked Solution

`lim_(x ->2) ((x-2)(x+2)^2)/(x^2-4)`

COMMENT: This question has been simplified as students no longer need to factorise the difference between 2 cubes (`x^3-2^3`).

`=lim_(x->2) ( (x -2)(x+2)^2)/( (x-2)(x+2)`

`=lim_(x->2) (x+2)`

`=4`

Filed Under: Standard / 1st Principles, Standard Differentiation (Adv-2027), Standard Differentiation (Y11) Tagged With: Band 4, smc-1069-50-Other, smc-6436-50-Other

Functions, 2ADV F1 2013 HSC 3 MC

Which inequality defines the domain of the function  `f(x) = 1/sqrt(x+3)` ?

  1. `x > -3`  
  2. `x >= -3`  
  3. `x < -3`  
  4. `x <= -3` 
Show Answers Only

`A`

Show Worked Solution

`text(Given)\ f(x) = 1/sqrt(x+3)`

`(x + 3)` `> 0`
`x` `> -3`


`:.\ text(The domain of)\ f(x)\ text(is)\ \ \ f(x)> -3`

`=>  A`

Filed Under: 4. Real Functions, Functions and Other Graphs, Further Functions and Relations (Y11), Other Functions and Relations (Adv-2027) Tagged With: Band 4, num-title-ct-patha, num-title-qs-hsc, smc-4244-10-Domain, smc-4244-70-Square root, smc-6216-40-Square-Root Functions, smc-6218-40-Square-Root Functions, smc-987-40-Square-Root Functions

Trigonometry, 2ADV T1 2013 HSC 2 MC

The diagram shows the line  `l`.

2013 2 mc

 What is the slope of the line  `l`? 

  1. `sqrt3`  
  2. `- sqrt3`  
  3. `1/sqrt3`  
  4. `- 1/sqrt3`  
Show Answers Only

`B`

Show Worked Solution

`text(Gradient is negative)`

`text{(slopes from top left to bottom right)}`

`tan60^@ = sqrt3`

`:.\ text(Gradient is)\ – sqrt3`

`=>  B`

Filed Under: 6. Linear Functions, Exact Trig Ratios and Other Identities, Trig Ratios, Sine and Cosine Rules (Adv-2027), Trig Ratios, Sine and Cosine Rules (Y11) Tagged With: Band 4, smc-6392-20-Trig Ratios, smc-980-20-Trig Ratios

Probability, 2ADV S1 2013 HSC 5 MC

A bag contains 4 red marbles and 6 blue marbles. Three marbles are selected at random without replacement.

What is the probability that at least one of the marbles selected is red?

  1. `1/6`  
  2. `1/2`  
  3. `5/6`  
  4. `29/30`  
Show Answers Only

`C`

Show Worked Solution
`text{P(at least 1 red)}` `= 1-Ptext{(none red)}`
  `= 1-P(B_1) xx P(B_2) xx P(B_3)`
  `= 1-6/10 xx 5/9 xx 4/8`
  `= 1-120/720`
  `= 1-1/6`
  `= 5/6`

`=>  C`

Filed Under: 3. Probability, Multi-Stage Events (Adv-2027), Multi-Stage Events (Y11) Tagged With: Band 4, smc-6469-30-Complementary Probability, smc-989-30-Complementary Probability

Calculus, 2ADV C2 2013 HSC 4 MC

What is the derivative of  `x/cosx`?

  1. `(cosx+xsinx)/(cos^2 x)`  
  2. `(cosx-xsinx)/(cos^2 x)`  
  3. `(xsinx-cosx)/(cos^2 x)`
  4. `(-xsinx-cosx)/(cos^2 x)`
Show Answers Only

`A`

Show Worked Solution

`y = x/cosx`

`text(Let)\ \ \ \ ` `u = x\ \ \ \ \ \ \ ` `u prime = 1`
  `v = cosx\ \ \ \ \ \ \ ` `v prime =-sin x`


`:.\ dy/dx` `= (vu prime\-uv prime)/v^2`
  `= (cosx  1-x (- sinx))/(cosx)^2`
  `= (cosx + xsinx)/(cos^2x)`

 
`=>  A`

Filed Under: Differentiation and Integration, Trig Differentiation, Trig Differentiation (Y12) Tagged With: Band 4, smc-968-20-Cos, smc-968-50-Quotient Rule

Financial Maths, STD2 F1 2010 HSC 23d

Warrick has a net income of $590 per week. He has created a budget to help manage his money.

       2010 23d

  1. Find the value of `X`, the amount that Warrick allocates towards electricity each week.    (1 mark)

    --- 1 WORK AREA LINES (style=lined) ---

  2. Warrick has an unexpectedly high telephone and internet bill. For the last three weeks, he has put aside his savings as well as his telephone and internet money to pay the bill.


    How much money has he put aside altogether to pay the bill?    (1 mark)

    --- 2 WORK AREA LINES (style=lined) ---

  3. The bill for the telephone and internet is $620. It is due in two weeks time. Warrick realises he has not put aside enough money to pay the bill.


    How could Warrick reallocate non-essential funds in his budget so he has enough money to pay the bill? Justify your answer with suitable reasons and calculations.   (3 marks)

    --- 6 WORK AREA LINES (style=lined) ---

Show Answers Only
  1. `$25`
  2. `text(Warwick has put aside $240 to pay the bill.)`
  3. `text(Warwick could reallocate funds for Entertainment and`
  4.  

    `text(Clothes and Gifts to pay the bill.)`

Show Worked Solution
a.    `X` `= 590 ` `-(175 + 45 + 10 + 15 + 90`
      `+ 40 + 30 + 70 + 50 + 40)`
    `= 590-565`
    `= $25`


b.    `text(Weekly Amount)` `= 40 + 40`
    `= 80`
`text{Total (3 weeks)}` `= 3 xx 80`
  `= 240`

 
`:.\ text(Warwick has put aside $240 to pay the bill.)`


c.    `text(Amount required less amount put aside)`
  `= 620\-240`
  `= $380`

 
`text(Extra 2 weeks of savings and telephone)`

`= 2 xx (40 + 40)`

`= $160`
 

`:.\ text(Funds to be reallocated)`

`= 380\-160`

`= 220\ text(over 2 weeks)`

`= $110\ text(per week)`
 

`text(Non essential items are Entertainment)`

`text(and Clothes and Gifts)`

`text(Amount)` `= 70 + 50`
  `= $120\ text(per week)`


`:.\ text(Warwick could reallocate funds for Entertainment)`

`text(and Clothes and Gifts to pay the bill.)`

Filed Under: Budgeting (Std1-2027), Budgeting (Std2-2027), Earning Money and Budgeting (Std 1), Earning Money and Budgeting (Std 2), FM1 - Earning money Tagged With: Band 1, Band 3, Band 4, smc-1126-30-Budgeting, smc-6279-10-Personal Budget, smc-6518-10-Personal Budget, smc-810-30-Budgeting

Financial Maths, STD2 F4 2011 HSC 28b

Norman and Pat each bought the same type of tractor for $60 000 at the same time. The value of their tractors depreciated over time.

The salvage value `S`, in dollars, of each tractor, is its depreciated value after `n` years.

Norman drew a graph to represent the salvage value of his tractor.
 

 2011 28b

  1. Find the gradient of the line shown in the graph.   (1 mark)

    --- 2 WORK AREA LINES (style=lined) ---

  2. What does the value of the gradient represent in this situation?   (1 mark)

    --- 2 WORK AREA LINES (style=lined) ---

  3. Write down the equation of the line shown in the graph.   (1 mark)

    --- 3 WORK AREA LINES (style=lined) ---

  4. Find all the values of `n` that are not suitable for Norman to use when calculating the salvage value of his tractor. Explain why these values are not suitable.   (2 marks)

    --- 4 WORK AREA LINES (style=lined) ---

Pat used the declining balance formula for calculating the salvage value of her tractor. The depreciation rate that she used was 20% per annum.

  1. What did Pat calculate the salvage value of her tractor to be after 14 years?   (2 marks)

    --- 4 WORK AREA LINES (style=lined) ---

  2. Using Pat’s method for depreciation, describe what happens to the salvage value of her tractor for all values of `n` greater than 15.   (1 mark)

    --- 2 WORK AREA LINES (style=lined) ---

Show Answers Only
  1. `text(Gradient) =-4000`
  2. `text(The amount the tractor depreciates each year.)`
  3. `S = 60\ 000\-4000n`
  4. `text(It is unsuitable to use)`
    `n<0\ text(because time must be positive)`
    `n>15\ text(because the tractor has no more value after 15 years and)`
    `text(therefore can’t depreciate further.)`
  5. `text(After 14 years, the tractor is worth $2638.83)`
  6. `text(As)\ n\ text(increases above 15 years,)\ S\ text(decreases but remains)>0.`
  7.  
Show Worked Solution
♦♦♦ Mean mark 14%
COMMENT: The intercepts of both axes provide points where the gradient can be quickly found.
i.    `text(Gradient)` `= text(rise)/text(run)`
    `= (- 60\ 000)/15`
    `=-4000`


♦ Mean mark 37%

ii.   `text(The amount the tractor depreciates each year)`


♦♦ Mean mark 28%
COMMENT: Using the general form `y=mx+b` is quick here because you have the gradient (from part (i)) and the `y`-intercept is obviously `60\ 000`.
iii.   `text(S)text(ince)\ \ S = V_0\-Dn`
  `:.\ text(Equation of graph:)`
  `S = 60\ 000-4000n`


iv.   `text(It is unsuitable to use)` 

♦♦♦ Mean mark 20%
`n<0,\ text(because time must be positive:)`
`n>15,\ text(because it has no more value after 15)`
`text(years and therefore can’t depreciate further.)`


v.    `text(Using)\ S = V_0 (1-r)^n\ \ text(where)\ r = text(20%,)\ n = 14`
`S` `= 60\ 000 (1\-0.2)^14`
  `= 60\ 000 (0.8)^14`
  `= 2\ 638.8279…`


`:.\ text(After 14 years, the tractor is worth $2638.83`


♦ Mean mark 37%
vi.   `text(As)\ n\ text(increases above 15 years,)\ S\ text(decreases)`
  `text(but remains > 0.)`

Filed Under: Depreciation - Declining Balance (Std 1), Depreciation - Declining Balance (Std 2), Depreciation / Running costs, Other Linear Modelling Tagged With: Band 4, Band 5, Band 6, smc-1139-10-Find S, smc-1139-60-Depreciation Graphs, smc-813-10-Find S, smc-813-60-Depreciation Graphs

Statistics, STD2 S5 2011 HSC 27c

Two brands of light bulbs are being compared. For each brand, the life of the light bulbs is normally distributed.

2011 27c

  1. One of the Brand B light bulbs has a life of 400 hours. 


    What is the  `z`-score of the life of this light bulb?  (1 mark)

    --- 1 WORK AREA LINES (style=lined) ---

  2. A light bulb is considered defective if it lasts less than 400 hours. The following claim is made:


    ‘Brand A light bulbs are more likely to be defective than Brand B light bulbs.’


    Is this claim correct? Justify your answer, with reference to  `z`-scores or standard deviations or the normal distribution.   (2 marks)

    --- 4 WORK AREA LINES (style=lined) ---

Show Answers Only
  1. `-2`
  2. `text(The claim is incorrect.)`
Show Worked Solution

i.    `z text{-score of Brand B bulb (400 hrs)}`

`= (x-mu)/sigma`
`= (400\-500)/50`
`= –2`


ii.   `z text{-score of Brand A bulb (400 hours)}`

♦ Mean mark 42%
MARKER’S COMMENT: A number of students found drawing normal curves in their solution advantageous.
`=(400-450)/25`
`=–2`

 
`text(S)text(ince the)\ z text(-score for both brands is –2,)`

`text(they are equally likely to be defective.)`

`:.\ text(The claim is incorrect.)`

Filed Under: DS5/6 - Normal Distribution and Sampling, Normal Distribution (Y12), S5 The Normal Distribution (Y12) Tagged With: Band 4, Band 5, common-content, smc-819-10-Single z-score, smc-819-30-Comparisons of Data Sets, smc-995-10-Single z-score, smc-995-30-Comparisons of Data Sets

Measurement, STD2 M7 2011 HSC 24a

Part of the floor plan of a house is shown. The plan is drawn to scale.

2011 24a

  1. What is the width of the stairwell, in millimetres?   (1 mark)

    --- 2 WORK AREA LINES (style=lined) ---

  2. What are the internal dimensions of the bathroom, in millimetres?    (1 mark)

    --- 2 WORK AREA LINES (style=lined) ---

  3. What is the length `AB`, the internal length of the rumpus room, in millimetres?   (1 mark)

    --- 2 WORK AREA LINES (style=lined) ---

Show Answers Only
  1. `900\  text(mm)`
  2. `2000\  text(mm) xx 2000\  text(mm)`
  3. `9695\  text(mm)`
Show Worked Solution
i.      `900\  text(mm)`


ii.     `2000\  text(mm) xx 2000\  text(mm)`


iii.    `text(Length of Rumpus Room) = AB`
 `AB` `= 3600 + 90 + 2000 + 90 + 3915`
  `=9695\ text(mm)`

Filed Under: M5 Scale Drawings (Y12), Ratio and Scale (Std2), Similarity and Scale Tagged With: Band 3, Band 4, page-break-before-question, smc-1105-10-Floor Plans, smc-1187-50-Floor Plans

Probability, 2UG 2011 HSC 26a

The two spinners shown are used in a game.

2UG 2011 26a1

Each arrow is spun once. The score is the total of the two numbers shown by the arrows.
A table is drawn up to show all scores that can be obtained in this game.

2UG 2011 26a2

  1. What is the value of `X` in the table?   (1 mark)
  2. What is the probability of obtaining a score less than 4?   (1 mark)
  3. On Spinner `B`, a 2 is obtained. What is the probability of obtaining a score of 3?   (1 mark)
  4. Elise plays a game using the spinners with the following financial outcomes.  

⇒ Win `$12` for a score of `4`

⇒ Win nothing for a score of less than `4`

⇒ Lose `$3` for a score of more than `4`

It costs `$5` to play this game. Will Elise expect a gain or a loss and how much will it be?

Justify your answer with suitable calculations.   (3 marks)

Show Answers Only
  1. `5`
  2. `1/2`
  3.  
  4. `2/3`
  5.  
  6. `text(Loss of)\ $1.50`
  7.  
Show Worked Solution

(i)   `X=3+2=5`


(ii)   `P(text{score}<4)=6/12=1/2`


(iii)   `P(3)=2/3`


(iv)   `P(4)=4/12=1/3`

♦ Mean mark 34%
MARKER’S COMMENT: Better responses remembered to deduct the $5 cost to play and recognised the negative result as a loss.
`P(text{score}<4)` `=6/12=1/2`
`P(text{score}>4)` `=2/12=1/6`


`text(Financial Expectation)`

`=(1/3xx12)+(1/2xx0)-(1/6xx3)-5`
`=4-0.5-5`
`=-1.50`


`:.\ text(Elise should expect a loss of $1.50) `

Filed Under: Financial Expectation Tagged With: Band 3, Band 4, Band 5

Statistics, STD2 S1 2011 HSC 25d

Data was collected from 30 students on the number of text messages they had sent in the previous 24 hours. The set of data collected is displayed.
 

2UG 2011 25d

  1. What is the outlier for this set of data? (1 mark)

    --- 1 WORK AREA LINES (style=lined) ---

  2. What is the interquartile range of the data collected from the female students? (1 mark)

    --- 1 WORK AREA LINES (style=lined) ---

Show Answers Only
  1. `71`
  2. `9`
Show Worked Solution

a.   `text(Outlier is 71)`

♦♦ Mean mark 34%
COMMENT: Ensure you can quickly and accurately find quartile values using stem and leaf graphs!

b.   `text{Lower quartile = 9   (4th female data point)}`

`text{Upper quartile = 20   (11th female data point)}`

`:.\ text{Interquartile range (female)}=20-11=9`

Filed Under: Bar Charts, Histograms and Other Graphs (Std 1), Other Chart Types (Y12), Other Charts (Std 2), Other Charts (Std1-2027), Other Charts (Std2-2027), Stem & Leaf, Box & Whisker Tagged With: Band 4, Band 5, common-content, smc-1128-26-Back-to-back Stem and Leaf, smc-6311-20-Back-to-Back Stem-and-Leaf, smc-6531-20-Back-to-Back Stem-and-Leaf, smc-822-30-Back-to-Back Stem and Leaf, smc-998-30-Back-to-Back Stem and Leaf

Probability, STD2 S2 2011 HSC 25c

At another school, students who use mobile phones were surveyed. The set of data is shown in the table.

2UG 2011 25c

  1. How many students were surveyed at this school?  (1 mark)

    --- 1 WORK AREA LINES (style=lined) ---

  2. Of the female students surveyed, one is chosen at random. What is the probability that she uses pre-paid?  (1 mark)

    --- 2 WORK AREA LINES (style=lined) ---

Ten new male students are surveyed and all ten are on a plan. The set of data is updated to include this information.

  1. What percentage of the male students surveyed are now on a plan? Give your answer to the nearest per cent.  (1 mark)

    --- 2 WORK AREA LINES (style=lined) ---

Show Answers Only
  1. `580`
  2. `text(54%)`
  3. `text(42%)`
Show Worked Solution

i.   `text(# Students surveyed)=319+261=580`


ii.   `Ptext{(Female uses prepaid)}=text(# Females on prepaid)/text(Total females)`

  `=172/319`
  `=0.53918…`
  `=\ text{54%  (nearest %)}`


iii.   `text(% Males on plan)` `=text(# Males on plan + 10)/text(Total males + 10)`
  `=(103+10)/(261+10)`
  `=113/271`
  `=0.4169…`
  `=\ text{42%  (nearest %)}`

Filed Under: Relative Frequency, Relative Frequency (Std 1), Relative Frequency (Std 2), Relative Frequency (Y11), Summary Statistics (no graph) Tagged With: Band 2, Band 3, Band 4, common-content, smc-1133-10-Surveys/Two-Way Tables, smc-827-10-Surveys/Two-Way Tables, smc-990-10-Surveys/Two-Way Tables

Statistics, STD2 S1 2011 HSC 25b

The graph below displays data collected at a school on the number of students
in each Year group, who own a mobile phone.
 

2UG 2011 25b
 

  1. Which Year group has the highest percentage of students with mobile phones? (1 mark)

    --- 1 WORK AREA LINES (style=lined) ---

  2. Two students are chosen at random, one from Year 9 and one from Year 10.


    Which student is more likely to own a mobile phone?


    Justify your answer with suitable calculations. (2 marks)

    --- 4 WORK AREA LINES (style=lined) ---

  3. Identify a trend in the data shown in the graph. (1 mark)

    --- 2 WORK AREA LINES (style=lined) ---

Show Answers Only
  1. `text{Year 12 (100%)}`
  2. `text(Year 10)`
  3. `text(See Worked Solutions for detail)`
Show Worked Solution

a.   `text(Year 12 (100%))`

MARKER’S COMMENT: Many students ignore the instruction to use calculations and lose marks as a result.
 

b.     `text(% Ownership in Year 9)` `=55/70`
    `=\ text{78.6%  (1d.p.)}`
      `text(% Ownership in Year 10)` `=50/60`
    `=\ text{83.3%  (1d.p.)}`

  
`:.\ text(The Year 10 student is more likely to own a mobile phone.)`


c.   `text(% Ownership increases as students)`

 `text(progress from Year 7 to Year 12.)`

Filed Under: Bar Charts and Histograms, Bar Charts and Histograms (Std 2), Bar Charts and Histograms (Std1-2027), Bar Charts and Histograms (Std2-2027), Bar Charts and Histograms (Y12), Bar Charts, Histograms and Other Graphs (Std 1), Displaying Data, Relative Frequency Tagged With: Band 3, Band 4, common-content, num-title-ct-core, num-title-qs-hsc, smc-1128-10-Bar Charts, smc-5076-10-Column graphs and histograms, smc-6310-10-Bar Charts, smc-6530-10-Bar Charts, smc-821-10-Bar Charts, smc-997-10-Bar Charts

Statistics, STD2 S1 2011 HSC 25a

A study on the mobile phone usage of NSW high school students is to be conducted.

Data is to be gathered using a questionnaire.

The questionnaire begins with the three questions shown.

2UG 2011 25a

  1. Classify the type of data that will be collected in Q2 of the questionnaire.  (1 mark)

    --- 1 WORK AREA LINES (style=lined) ---

  2. Write a suitable question for this questionnaire that would provide discrete ordinal data.   (1 mark)

    --- 2 WORK AREA LINES (style=lined) ---

  3. An initial study is to be conducted using a stratified sample.


    Describe a method that could be used to obtain a representative stratified sample.  (1 mark)

    --- 2 WORK AREA LINES (style=lined) ---

  4. Who should be surveyed if it is decided to use a census for the study?  (1 mark)

    --- 2 WORK AREA LINES (style=lined) ---

Show Answers Only
  1. `text(Categorical)`
  2. `text(See Worked Solutions)`
  3. `text(See Worked Solutions)`
  4. `text(A census would involve all high school students in NSW.)`
Show Worked Solution

a.  `text(Categorical)`


b.  `text(How many outgoing calls do you make per day?)`

`text{(Ensure it can be answered with a numerical score.)}`


c.  `text(The method could be to work out how many)`

♦♦♦ Mean mark 7%. Toughest mark to get in the 2011 exam!
COMMENT: Know and be able to describe random, systematic and stratified sampling!

`text{students are in each year and ask 10% of the}`

`text{students in each year. (Note the sample of}`

`text{students in each year must be  proportional to}`

`text{their percentage in the population).}`


♦♦♦ Mean mark 18%.
MARKER’S COMMENT: A specific population needed (i.e. high school students).

d.  `text(A census would involve all high school)`

`text(students in NSW.)`

Filed Under: Classifying Data (Std 1), Classifying Data (Std 2), Data Classification, Investigation and Sampling Methods (Std1-2027), Data Classification, Investigation and Sampling Methods (Std2-2027), DS1 - Stats and society Tagged With: Band 4, Band 5, Band 6, common-content, smc-1127-10-Sampling Methods, smc-1127-20-Classifying Data, smc-1127-30-Other, smc-6309-10-Sampling Methods, smc-6309-20-Data Classification, smc-6309-30-Other, smc-6529-10-Sampling Methods, smc-6529-20-Data Classification, smc-6529-30-Other, smc-820-10-Sampling Methods, smc-820-20-Classifying Data, smc-820-30-Other

Financial Maths, STD2 F4 2010 HSC 28a

The table shows monthly home loan repayments with interest rate changes from February to October 2009.

 2010 28a

  1. What is the change in monthly repayments on a  $250 000  loan from February 2009 to April 2009?  (1 mark)

    --- 3 WORK AREA LINES (style=lined) ---

  2. Xiang wants to borrow  $307 000  to buy a house.


    Xiang’s bank approves loans for customers if their loan repayments are no more than 30% of their monthly gross salary.


    Xiang’s monthly gross salary is $6500.


    If she had applied for the loan in October 2009, would her bank have approved her loan?


    Justify your answer with suitable calculations.    (3 marks)

    --- 6 WORK AREA LINES (style=lined) ---

  3. Jack took out a loan at the same time and for the same amount as Xiang.


    Graphs of their loan balances are shown.
     
          2010 28a2

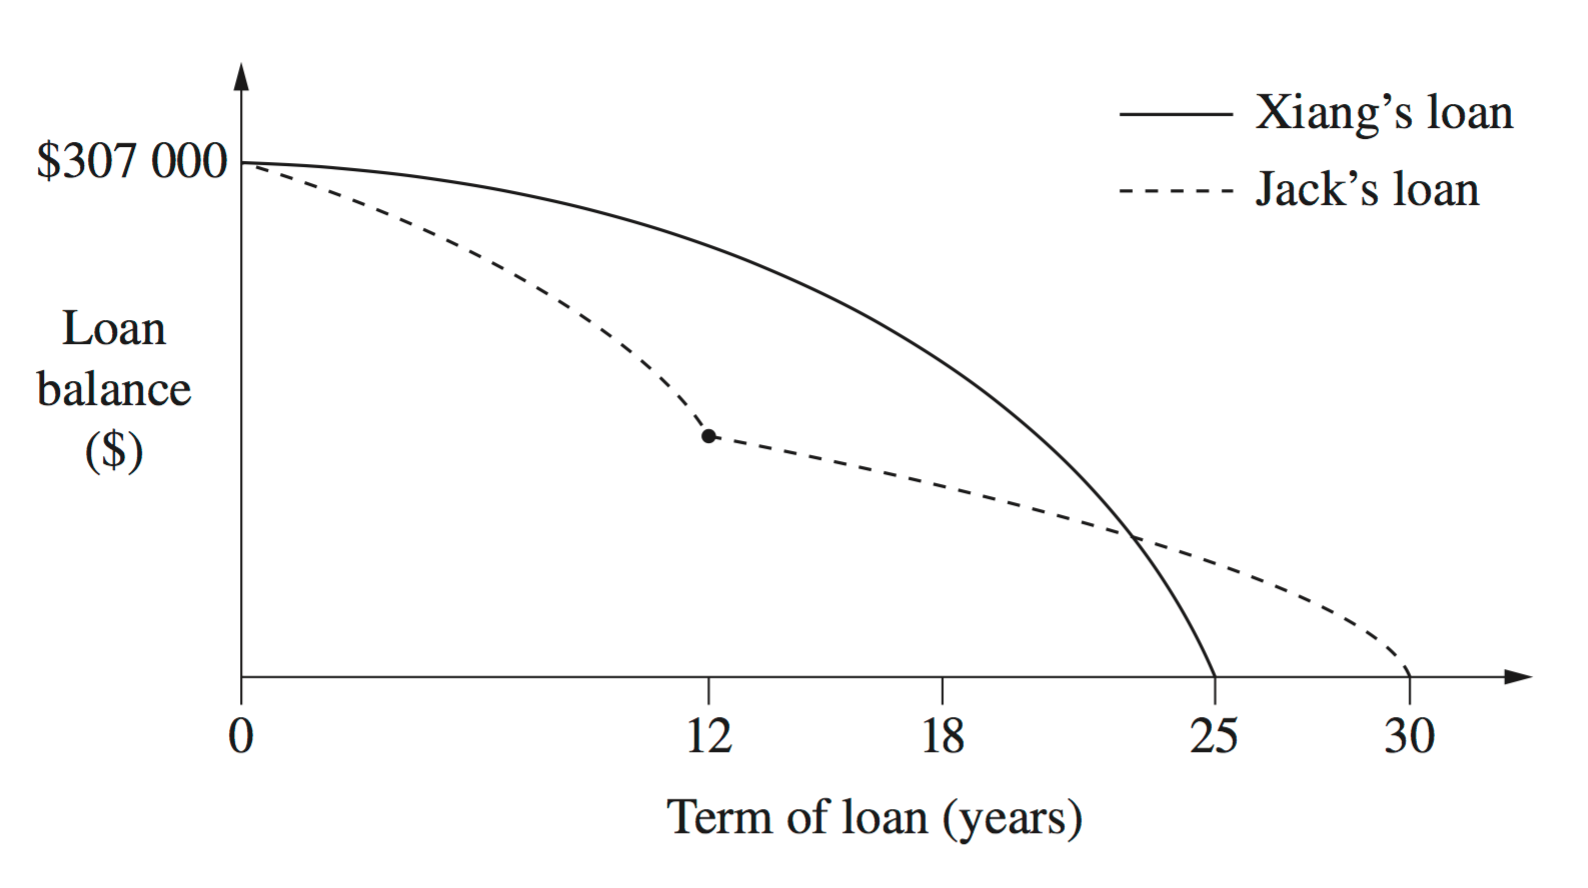
    Identify TWO differences between the graphs and provide a possible explanation for each difference, making reference to interest rates and/or loan repayments.   (2 marks)

    --- 5 WORK AREA LINES (style=lined) ---

Show Answers Only
  1. `text(Monthly repayments decrease by $15)`
  2. `text(S)text(ince repayments of 1987.29 > 1950, the loan)`
    `text(would not have been approved.)`
  3. `text(Differences)`
  4. `text(Jack’s loan balance falls more sharply for first 12 years)`
  5. `text(Jack’s loan balance falls less sharply between years 12-30.)`
  6.  
  7. `text(Explanation)`
  8.  
  9. `text(Jack made larger repayments for first 12 years, or)`
  10. `text(Jack made the same repayments but had a lower interest rate)`
  11. `text(for the first 12 years.)`
  12. `text(Jack made smaller repayments in years 12-30.)`
Show Worked Solution
i.    `text(Repayment)\ text{(Feb 09)}` `= 1588`
  `text(Repayment)\ text{(Apr 09)}` `= 1573`
`text(Difference) = 1588\-1573 = 15`
`:.\ text(Monthly repayments decrease by $15)`


♦ Mean mark 39%
MARKER’S COMMENT: Borrowing $307,000 can be achieved by borrowing $300,000, and then `7` times the table repayment value for borrowing $1000. 
ii.    `text(Loan) = $307\ 000`
`text{Repayments (Oct 09)}` `= 1942 + (7 xx 6.47)`
  `= 1942 + 45.29`
  `= $1987.29\ text(per month)`


`text(30% Gross salary)` `= 6500 xx\ text(30%)`
  `= $1950\ text(per month)`


`:.\ text(S)text(ince repayments of $1987.29 > $1950, the loan)`
`text(would not have been approved.)`


iii.  `text(Differences)`

`text(Jack’s loan balance falls more sharply for first 12 years)`

`text(Jack’s loan balance falls less sharply between years 12-30.)`

`text{Explanation(s)}`

♦ Mean mark 36%
MARKER’S COMMENT: Explanations were generally poor and many failed to refer directly to the graphs shown, or reference Xiang or Jack directly.

`text(Jack made larger repayments for 1st 12 years, or)`

`text(Jack made the same repayments but had a)`

`text(lower interest rate for the first 12 years.)`

`text(Jack made smaller repayments in years 12-30.)`

Filed Under: FM4 - Credit and Borrowing, Loans (Std 1), Loans and Credit Cards (Std 2) Tagged With: Band 4, Band 5, page-break-before-question, smc-1140-30-Other Loan Tables, smc-1140-50-Loan Graphs, smc-814-30-Other Loan Tables, smc-814-50-Loan Graphs

Probability, STD2 S2 2013 HSC 30b

In a class there are 15 girls (G) and 7 boys (B). Two students are chosen at random to be class representatives.

  1. Complete the tree diagram below.    (2 marks)


    --- 0 WORK AREA LINES (style=lined) ---

  2. What is the probability that the two students chosen are of the same gender?    (2 marks)

    --- 4 WORK AREA LINES (style=lined) ---

Show Answers Only
  1.  
  2. `6/11`
Show Worked Solution

i.  

ii.    `Ptext{(same gender)}` `=P(G,G) + P(B,B)`
    `=(15/22 xx 14/21) + (7/22 xx 6/21)`
    `=210/462 + 42/462`
    `=252/462`
    `=6/11`
♦ Mean mark (ii) 40%.

Filed Under: Multi-stage Events, Multi-Stage Events (Std 2), Single and Multi-Stage Events (Std 1) Tagged With: Band 4, Band 5, num-title-ct-corea, num-title-qs-hsc, smc-1135-10-Probability Trees, smc-4238-10-Dependent events, smc-4238-50-Probability trees, smc-829-10-Probability Trees

Probability, STD2 S2 2013 HSC 29c

Mary is designing a website that requires unique logins to be generated.

She plans to generate the logins using two capital letters from the alphabet followed by a series of numerals from 0 to 9 inclusive. All logins will have the same number of numerals. Repetition of letters and numerals is allowed.

What is the minimum number of numerals required for each login so that Mary can generate at least 3 million logins?

Justify your answer with suitable calculations.   (2 marks)

--- 4 WORK AREA LINES (style=lined) ---

Show Answers Only

 `4`

Show Worked Solution
♦ Mean mark 34%
COMMENT: Students can use their rough working to find an appropriate “number of numerals” where their answer should start.

`text(# Combinations must be > 3 million:)`

`text(If we have 3 numerals,)`

`text(# Combinations)` `=26 xx 26 xx 10 xx 10 xx 10`
  `=676\ 000 < 3\ 000\ 000`

`=> text(need more numeral(s) )`


`text(If we have 4 numerals,)`

`text(# Combinations)` `=26 xx 26 xx 10 xx 10 xx 10 xx 10`
  `=6760\ 000 > 3\ 000\ 000`


`:.\ text(Minimum number of numerals) = 4`


Filed Under: # Combinations, Combinations (Std 1), Combinations and Single Stage Events (Std 2) Tagged With: Band 4, smc-1134-20-Number Combinations, smc-1134-30-Letter Combinations, smc-828-20-Number Combinations, smc-828-30-Letter Combinations

Probability, STD2 S2 2011 HSC 24b

A die was rolled 72 times. The results for this experiment are shown in the table.
  

\begin{array} {|c|c|}
\hline
\rule{0pt}{2.5ex} \textit{Number obtained} \rule[-1ex]{0pt}{0pt} & \textit{Frequency} \\
\hline
\rule{0pt}{2.5ex} \ 1 \rule[-1ex]{0pt}{0pt} & 16 \\
\hline
\rule{0pt}{2.5ex} \ 2 \rule[-1ex]{0pt}{0pt} & 11 \\
\hline
\rule{0pt}{2.5ex} \ 3 \rule[-1ex]{0pt}{0pt} & \textbf{A} \\
\hline
\rule{0pt}{2.5ex} \ 4 \rule[-1ex]{0pt}{0pt} & 8 \\
\hline
\rule{0pt}{2.5ex} \ 5 \rule[-1ex]{0pt}{0pt} & 12 \\
\hline
\rule{0pt}{2.5ex} \ 6 \rule[-1ex]{0pt}{0pt} & 15 \\
\hline
\end{array}

  1. Find the value of  `A`.   (1 mark)

    --- 1 WORK AREA LINES (style=lined) ---

  2. What was the relative frequency of obtaining a 4.   (1 mark)

    --- 1 WORK AREA LINES (style=lined) ---

  3. If the die was unbiased, which number was obtained the expected number of times?   (1 mark)

    --- 1 WORK AREA LINES (style=lined) ---

Show Answers Only
  1. \(10\)
  2. \(\dfrac{1}{9}\)
  3. \(5\)
Show Worked Solution
i.     \(\text{Since die rolled 72 times}\)
\(\therefore\ A\) \(=72-(16+11+8+12+15)\)
  \(=72-62\)
  \(=10\)
♦ Mean mark 38%
IMPORTANT: Many students confused ‘relative frequency’ with ‘frequency’ and incorrectly answered 8.
ii.     \(\text{Relative frequency of 4}\) \(=\dfrac{8}{72}\)
  \(=\dfrac{1}{9}\)


iii.  \(\text{Expected frequency of any number}\)
\(=\dfrac{1}{6}\times 72\)
\(=12\)
 
\(\therefore\ \text{5 was obtained the expected number of times.}\)

Filed Under: Probability, Relative Frequency, Relative Frequency (Std 1), Relative Frequency (Std 2), Relative Frequency (Y11) Tagged With: Band 2, Band 4, Band 5, common-content, num-title-ct-core, num-title-qs-hsc, smc-1133-20-Games of Chance, smc-1133-30-Expected Frequency (np), smc-4225-35-Relative frequency, smc-827-20-Games of Chance, smc-827-40-Expected Frequency (np), smc-990-20-Games of Chance, smc-990-40-Expected Frequency (np)

Algebra, STD2 A2 2011 HSC 23b

Sticks were used to create the following pattern. 

The number of sticks used is recorded in the table.

\begin{array} {|l|c|}
\hline
\rule{0pt}{2.5ex} \text{Shape $(S)$} \rule[-1ex]{0pt}{0pt} & \;\;\; 1 \;\;\; & \;\;\; 2 \;\;\; & \;\;\; 3 \;\;\; \\
\hline
\rule{0pt}{2.5ex} \text{Number of sticks $(N)$}\; \rule[-1ex]{0pt}{0pt} & \;\;\; 5 \;\;\; & \;\;\; 8 \;\;\; & \;\;\; 11 \;\;\; \\
\hline
\end{array}

  1. Draw Shape 4 of this pattern.  (1 mark)

    --- 4 WORK AREA LINES (style=lined) ---

  2. How many sticks would be required for Shape 100?    (1 mark)

    --- 3 WORK AREA LINES (style=lined) ---

  3. Is it possible to create a shape in this pattern using exactly 543 sticks?


    Show suitable calculations to support your answer.    (2 marks)

    --- 5 WORK AREA LINES (style=lined) ---

Show Answers Only
  1. `text(See Worked Solutions.)`
  2. `302`
  3. `text(No)`
Show Worked Solution

  i.     `text(Shape 4 is shown below:)`

ii.     `text(S)text(ince)\ \ N=2+3S`

♦ Mean mark 48%.
MARKER’S COMMENT: Students should attempt to find a “rule” in such questions, and use this formula to solve the question, as per the Worked Solution.  
`text(If)\ \ S` `=100`,
`N` `=2+(3xx100)`
  `=302`


iii.    `543` `=2+3S`
  `3S` `=541`
  `S` `=180 1/3`


`text(S)text(ince S is not a whole number, 543 sticks)`

`text(will not create a figure.)`

Filed Under: AM1 - Algebra (Prelim), Linear Equations and Basic Graphs (Std 1), Linear Equations and Basic Graphs (Std 2) Tagged With: Band 1, Band 4, Band 5, smc-1118-30-Patterns, smc-792-30-Patterns

Statistics, STD2 S1 2011 HSC 17 MC

The heights of the players in a basketball team were recorded as 1.8 m, 1.83 m, 1.84 m, 1.86 m and 1.92 m. When a sixth player joined the team, the average height of the players increased by 1 centimetre.

What was the height of the sixth player?

  1.   1.85 m
  2.   1.86 m
  3.   1.91 m
  4.   1.93 m
Show Answers Only

`C`

Show Worked Solution
`text(Old Mean)` `=(1.8+1.83+1.84+1.86+1.92)-:5`
  `=9.25/5`
  `=1.85\ \ text(m)`


`text{S}text{ince the new mean = 1.86m  (given)}`

`text(New Mean)` `=text(Height of all 6 players) -: 6`
`:.1.86` `=(9.25+h)/6\ \ \ \ (h\ text{= height of new player})`
`h` `=(6xx1.86)-9.25`
  `=1.91\ \ text(m)`

`=> C`

Filed Under: Data Analysis, Measures of Central and Spread (Std1-2027), Measures of Centre and Spread (Std2-2027), Summary Statistics - No Graph (Std 2), Summary Statistics - No graph (Y12), Summary Statistics (no graph), Summary Statistics (Std 1) Tagged With: Band 4, common-content, num-title-ct-core, num-title-qs-hsc, smc-1131-10-Mean, smc-4224-25-Mean, smc-4224-50-Add/remove data, smc-6312-10-Mean, smc-6532-10-Mean, smc-824-10-Mean, smc-999-10-Mean

Statistics, STD2 S1 2011 HSC 14 MC

A data set of nine scores has a median of 7.

The scores  6, 6, 12 and 17  are added to this data set.

What is the median of the data set now?

  1. 6
  2. 7
  3. 8
  4. 9
Show Answers Only

`B`

Show Worked Solution

`text(S)text(ince an even amount of scores are added below and)`

`text(above the existing median, it will not change.)`

`=>B`

Filed Under: Data Analysis, Measures of Central and Spread (Std1-2027), Measures of Centre and Spread (Std2-2027), Summary Statistics - No Graph (Std 2), Summary Statistics - No graph (Y12), Summary Statistics (no graph), Summary Statistics (Std 1) Tagged With: Band 4, common-content, num-title-ct-core, num-title-qs-hsc, smc-1131-20-Median and Mode, smc-4224-20-Median, smc-4224-50-Add/remove data, smc-6312-20-Median and Mode, smc-6532-20-Median and Mode, smc-824-20-Median and Mode, smc-999-20-Median and Mode

Financial Maths, STD2 F5 2009 HSC 27a

The table shows the future value of a $1 annuity at different interest rates over different numbers of time periods. 
 

2UG-2009-27a

  1. What would be the future value of a $5000 per year annuity at 3% per annum for 6 years, with interest compounding yearly?   (1 mark)

    --- 1 WORK AREA LINES (style=lined) ---

  2. What is the value of an annuity that would provide a future value of  $407100  after 7 years at 5% per annum compound interest?   (1 mark)

    --- 1 WORK AREA LINES (style=lined) ---

  3. An annuity of $1000 per quarter is invested at 4% per annum, compounded quarterly for 2 years. What will be the amount of interest earned?    (3 marks)

    --- 6 WORK AREA LINES (style=lined) ---

Show Answers Only
  1. `$32\ 342`
  2. `$50\ 000`
  3. `$285.70`
Show Worked Solution

i.  `text(Table factor when)\ \ n = 6,\ \ \ r =\ 3text(%) \ => \ 6.4684`

`:.\ FV` `= 5000 xx 6.4684`
  `= $32\ 342`


ii.
  `text(Table factor when)\ \ n = 7,\ \ \ r =\ text(5%)` 

♦ Mean mark 45%
MARKER’S COMMENT: A common error was to multiply $407 100 by 8.1420 rather than divide.

`=> 8.1420`

`text(Let)\ \ A = text(annuity)`

`FV` `= A xx 8.1420`
`A` `= (FV)/8.1420`
  `= (407\ 100)/8.1420`
  `= $50\ 000`


iii.  `n=8\ \ \ (text(8 quarters in 2 years) )`

♦♦ Mean mark 31%
MARKER’S COMMENT: When questions asked for the interest paid on annuities, remember to subtract the total principal amounts contributed.

`r = text(4%)/4 =\ text{1%  per quarter}`

`:.\ text(Table factor) => 8.2857`

`FV` `=1000 xx 8.2857`
  `=8285.70`


`text(Interest)` `= FV (text(annuity) )\ – text(Principal)`
  `= 8285.70\ – (8 xx 1000)`
  `= 285.70`


`:.\ text(Interest earned is $285.70)`

Filed Under: F5 Annuities (Y12), FM5 - Annuities and Loan repayments, Modelling Investments and Loans (Y12) Tagged With: Band 4, Band 5, common-content, smc-1002-40-FV Annuity Table, smc-816-10-FV of $1 Annuity Table

Algebra, STD2 A4 2009 HSC 28a

Anjali is investigating stopping distances for a car travelling at different speeds. To model this she uses the equation
 

`d = 0.01s^2+ 0.7s`,
 

where `d` is the stopping distance in metres and `s` is the car’s speed in km/h.

The graph of this equation is drawn below.

2009 28a

  1. Anjali knows that only part of this curve applies to her model for stopping distances.


    In your writing booklet, using a set of axes, sketch the part of this curve that applies for stopping distances.  (1 mark)

  2. What is the difference between the stopping distances in a school zone when travelling at a speed of 40 km/h and when travelling at a speed of 70 km/h?   (2 marks)

    --- 4 WORK AREA LINES (style=lined) ---

Show Answers Only
  1.  
    2UG-2009-28a-Answer
  2. `54\ text(metres)`
Show Worked Solution
(i)

2UG-2009-28a-Answer

(ii) `text(When)\ \ s = 40`

♦ Mean mark 41%
COMMENT: Students could easily have used the graph for calculating `d` at `text(40 km/h)`, although the formula was required when the speed increased to `text(70 km/h)`.
`d` `= 0.01(40^2)+ 0.7 (40)`
  `= 16+28`
  `= 44\ text(m)`


`text(When)\ \ s = 70`

`d` `= 0.01 (70^2) +0.7(70)`
  `= 49 +49`
  `= 98\ text(m)`


`:.\ text(Difference)` `= 98\ -44`
  `= 54\ text(metres)`

Filed Under: Exponential/Quadratic (Projectile), Non-Linear: Exponential/Quadratics (Std 2) Tagged With: Band 4, Band 5, smc-830-20-Quadratics

Financial Maths, STD2 F4 2009 HSC 26c

Margaret borrowed $300 000 to buy an apartment. The interest rate is 6% per annum, compounded monthly. The repayments were set by the bank at $2200 per month for 20 years.

The loan balance sheet shows the interest charged and the balance owing for the first month.

2009 26c 

  1. What is the total amount that is to be paid for this loan over the 20 years?    (1 mark)

    --- 3 WORK AREA LINES (style=lined) ---

  2. Find the values of `A` and `B`.     (2 marks)

    --- 5 WORK AREA LINES (style=lined) ---

Show Answers Only
  1. `$528\ 000`
  2. `A = $1496.50, B = $298\ 596.50`
Show Worked Solution
♦ Mean mark 39%
MARKER’S COMMENT: 1 mark allocation flags the answer should not be too involved.

i.   `text(Monthly repayment) = $2200`

`text(# Repayments)\ = 20 xx 12 = 240`

`:.\ text(Total paid)` `= 2200 xx 240`
  `= $528\ 000`


ii.    `text(Interest rate monthly)\ = text(6%)/12=\ text(0.5%)`

`A` `= text(Principal at start of month) xx 0.5/100`
  `= 299\ 300 xx 0.5/100`
  `= $1496.50`


`B` `=\ text(Principal + interest – repayment)`
  `= 299\ 300 + 1496.50\-2200`
  `= $298\ 596.50`

Filed Under: FM4 - Credit and Borrowing, Loans (Std 1), Loans and Credit Cards (Std 2) Tagged With: Band 4, smc-1140-20-P+I-R Tables, smc-1140-40-Total Loan/Interest Payments, smc-814-20-P+I-R Tables, smc-814-40-Total Loan/Interest Payments

Measurement, STD2 M2 2009 HSC 26b

John lives in Denver and wants to ring a friend in Osaka.

  1. In Denver it is 9 pm Monday. Given Osaka has a UTC of +9 and Denver has a UTC of –7, what time and day is it in Osaka then?   (1 mark) 

    --- 2 WORK AREA LINES (style=lined) ---

  2. John’s friend in Osaka sent him a text message which happened to take 14 hours to reach him. It was sent at 10 am Thursday, Osaka time.


    What was the time and day in Denver when John received the text?    (2 marks)

    --- 4 WORK AREA LINES (style=lined) ---

Show Answers Only
  1. `1\ text(pm Tuesday)`
  2. `8\ text(am Thursday)`
Show Worked Solution
a.   `text{Denver is behind Osaka time by 16 hours.}`


`:.\ text(Time in Osaka)` `= 9\ text(pm Monday plus 16 hours)`
  `= 1\ text(pm Tuesday)`


♦ Mean mark 34%
b.   `text(Denver is 16 hours behind Osaka)`
   `:.\ text(John will receive the text at 10 am Thursday)`
   `text(less 16 hours plus 14 hours.)`
   `text{(i.e. 8 am Thursday.)}`

Filed Under: M2 Working with Time (Y11), M2 Working with Time (Y11), Time and Time Difference (Std1-2027), Time and Time Difference (Std2-2027) Tagged With: Band 4, Band 5, smc-1102-10-Time Differences, smc-6306-10-Time Differences, smc-6525-10-Time Differences, smc-776-10-Time Differences

Statistics, STD2 S1 2009 HSC 26a

In a school, boys and girls were surveyed about the time they usually spend on the internet over a weekend. These results were displayed in box-and-whisker plots, as shown below. 
 

2UG-2009-26a

  1. Find the interquartile range for boys.   (1 mark)

    --- 1 WORK AREA LINES (style=lined) ---

  2. What percentage of girls usually spend 5 or less hours on the internet over a weekend?  (1 mark)

    --- 1 WORK AREA LINES (style=lined) ---

  3. Jenny said that the graph shows that the same number of boys as girls usually spend between 5 and 6 hours on the internet over a weekend.


    Under what circumstances would this statement be true?    (1 mark)

    --- 2 WORK AREA LINES (style=lined) ---

Show Answers Only
  1. `4`
  2. `text(75% of girls spend 5 hours or less)`
  3. `text(5-6 hours for girls accounts for 25% of all girls.)`
  4. `text(5-6 hours for boys accounts for 25% of all boys,)`
  5. `text(as median to upper quartile is 25%.)`
     
  6. `=>\ text(This will be the same number only if the number of)`
  7. `text(all girls surveyed equals the number of boys surveyed.)`
Show Worked Solution
a.    `text(Interquartile range)` `= 6` `- 2`
    `= 4`


♦♦ Mean mark part (b): 31%
b.    `text(Upper quartile = 5`
  `:.\ text(75% of girls spend 5 or less hours)`


♦♦♦ Mean mark part (c): 9%
c.    `text(5-6 hours for girls accounts for 25% of all girls.)`
  `text(5-6 hours for boys accounts for 25% of all boys,)`
  `text{(median to the upper quartile represents 25%.)}`
  `=>\ text(This will only be the same number if the number of)`
  `text(all girls surveyed equals the number of boys surveyed.)`

Filed Under: Stem & Leaf, Box & Whisker, Summary Statistics - Box Plots (Std 2), Summary Statistics - Box Plots (Std2-2027), Summary Statistics - Box Plots (Y12) Tagged With: Band 4, Band 5, Band 6, common-content, smc-1000-20-Parallel Box-Plots, smc-6313-20-Parallel Box Plots, smc-825-20-Parallel Box-Plots

Statistics, STD2 S5 2009 HSC 25d

In Broken Hill, the maximum temperature for each day has been recorded. The mean of these maximum temperatures during spring is 25.8°C, and their standard deviation is 4.2° C. 

  1. What temperature has a `z`-score of  –1?    (1 mark)

    --- 1 WORK AREA LINES (style=lined) ---

  2. What percentage of spring days in Broken Hill would have maximum temperatures between 21.6° C and 38.4°C?


    You may assume that these maximum temperatures are normally distributed and that

  3.  

    • 68% of maximum temperatures have `z`-scores between –1 and 1
    • 95% of maximum temperatures have `z`-scores between –2 and 2
    • 99.7% of maximum temperatures have `z`-scores between –3 and 3.   (3 marks)

    --- 6 WORK AREA LINES (style=lined) ---

Show Answers Only
  1. `21.6^@`
  2. `text(83.85%)`
Show Worked Solution

i.   `mu = 25.8\ \ \ sigma = 4.2`

`text(Using)\ \ \ \ z` `= (x-mu)/sigma`
`-1` `= (x-25.8)/4.2`
`x` `- 25.8` `= -4.2`
`x` `= 21.6°`


`:.\ 21.6^@\ text(has a)\ z text(-score of)  -1` 


ii.    `z text(-score of)\ 21.6 = -1`

♦ Mean mark 41%
MARKER’S COMMENT: Many students failed to use the answer to (d)(i), costing them valuable exam time.

`text(Find)\ z text(-score of 38.4)`

`z\ (38.4)` `= (38.4\ – 25.8)/4.2=3`


`text(68% of scores are between)\ z= –1\ text(and 1)`

`=>\ text(34%)\ text(are between)\ z=–1\ text(and 0)`

`text(99.7% of scores are between)\ z= –3\ text(and 3)`

`=>\ text(49.85%)\ text(are between)\ z=0\ text(and 3)`


`:.\ text(% Temps between 21.6° and 38.4°)`

`=\ text(34% + 49.85%)`
`=\ text(83.85%)`


Filed Under: DS5/6 - Normal Distribution and Sampling, Normal Distribution (Y12), S5 The Normal Distribution (Y12) Tagged With: Band 4, Band 5, common-content, smc-819-10-Single z-score, smc-819-20-z-score Intervals, smc-995-10-Single z-score, smc-995-20-z-score Intervals

Measurement, 2UG 2009 HSC 25c

There is a lake inside the rectangular grass picnic area `ABCD`, as shown in the diagram.
 

2UG-2009-25c
 

  1. Use Simpson’s Rule to find the approximate area of the lake’s surface.   (3 marks)
  2. The lake is 60 cm deep. Bozo the clown thinks he can empty the lake using a four-litre bucket.
  3. How many times would he have to fill his bucket from the lake in order to empty the lake?  (Note that 1 m³ = 1000 L)`.    (2 marks)


Show Answers Only
  1. `508\ text(m²)`
  2. `text(76 200 times)`
Show Worked Solution
(i)     `text(Area of lake = Area of rectangle)\ – text(Area of grass)`
`text(Area of rectangle)` `= 24 xx 55`
  `= 1320\ text(m²)`


`text(Area of grass)` `~~ h/3 [y_0 + 4y_1 + y_2]\ \ \ text(… applied twice)`
  `~~ 12/3 [20 + 4 xx 5 + 10] + 12/3 [35 + 4 xx 22 + 30]`
  `~~ 4[50] + 4[153]`
  `~~ 200 + 612`
  `~~ 812\ text(m²)`


`:.\ text(Area of lake)` `~~ 1320\ – 812`
  `~~ 508\ text(m²)`


♦ Mean mark 44%
STRATEGY: Most students who did calculations in cm² and cm³ made errors. Keeping calculations in metres is much easier here.
(ii)    `V` `= Ah`
    `= 508 xx 0.6`
    `= 304.8\ text(m³)`
    `= 304\ 800\ text(L)\ \ \ text{(since 1 m³ = 1000  L)}`


`text(# Times to fill bucket)` `= (304\ 800)/4`
  `= 76\ 200`


`:.\ text(Bozo would have to fill his bucket)`

`text(76 200 times to empty the lake.)`

Filed Under: FS Resources, Simpson's Rule/Measurement Error Tagged With: Band 4, Band 5

Algebra, STD2 A1 2009 HSC 25a

Simplify  `5-2(x + 7)`.    (2 marks)

--- 4 WORK AREA LINES (style=lined) ---

Show Answers Only

 `-2x-9`

Show Worked Solution
♦ Mean mark 47%
`5-2(x + 7)` `= 5-2x-14`
  `= -2x-9`

Filed Under: AM1 - Algebra (Prelim), Distributive Laws, Substitution and Other Equations (Std 1), Substitution and Other Equations (Std 2), Substitution and Other Equations (Std1-2027), Substitution and Other Equations (Std2-2027) Tagged With: Band 4, num-title-ct-corea, num-title-qs-hsc, smc-1116-50-Other Equations, smc-6234-50-Other Equations, smc-6508-50-Other Equations, smc-789-50-Other Equations

Financial Maths, STD2 F4 2013 HSC 28e

Zheng has purchased a computer for $5000 for his company. He wants to compare two different methods of depreciation over two years for the computer.

Method 1: Straight-line with $1250 depreciation per annum.

Method 2: Declining balance with 35% depreciation per annum.

Which method gives the greatest depreciation over the two years? Justify your answer with suitable calculations.     (3 marks)

--- 6 WORK AREA LINES (style=lined) ---

Show Answers Only

 `text(Method 2)`

Show Worked Solution

`text(Method 1)`

`text(Depreciation over 2 years)` `=2xx 1250`
  `= $2500`


`text(Method 2)`

`text(Depreciation (Year 1) )` `=35text(%) xx 5000`
  `=$1750`
`text(Depreciation (Year 2) )` `=35text(%) xx (5000-1750)`
  `=$1137.50`


`text(Depreciation over 2 years)` `=1750 + 1137.50`
  `=$2887.50`


`:.\ text(Method 2 gives the greater depreciation.)`

Filed Under: Depreciation - Declining Balance (Std 1), Depreciation - Declining Balance (Std 2), Depreciation / Running costs Tagged With: Band 4, smc-1139-50-Declining Balance vs Straight Line, smc-813-50-Declining Balance vs Straight Line

Financial Maths, STD2 F4 2013 HSC 28d

Adhele has 2000 shares. The current share price is  $1.50  per share. Adhele is paid a dividend of  $0.30  per share. 

  1. What is the current value of her shares?   (1 mark)
  2. Calculate the dividend yield.    (1 mark)
Show Answers Only
  1. `$3000`
  2. `text(20%)`
Show Worked Solution
i.    `text(# Shares)=2000`
  `text(Share price) = $1.50`


`:.\ text(Current value)` `= 2000 xx 1.50`
  `=$3000`
♦♦♦ Mean mark 13%
MARKER’S COMMENT: A large majority of students had a poor understanding of the term dividend yield.
  

ii.    `text(Dividend yield)` `=\ text(Dividend)/text(Share price)`
    `= 0.30/1.50`
    `=20 text(%)`

Filed Under: Compound Interest and Shares (Std2), FM2 - Investing Tagged With: Band 4, Band 6, smc-817-40-Shares/Dividends

Statistics, STD2 S4 2013 HSC 28b

Ahmed collected data on the age (`a`) and height (`h`) of males aged 11 to 16 years.

He created a scatterplot of the data and constructed a line of best fit to model the relationship between the age and height of males.
 

  1. Determine the gradient of the line of best fit shown on the graph.   (1 mark)

    --- 2 WORK AREA LINES (style=lined) ---

  2. Explain the meaning of the gradient in the context of the data.   (1 mark)

    --- 2 WORK AREA LINES (style=lined) ---

  3. Determine the equation of the line of best fit shown on the graph.  (2 marks)

    --- 5 WORK AREA LINES (style=lined) ---

  4. Use the line of best fit to predict the height of a typical 17-year-old male.   (1 mark)

    --- 1 WORK AREA LINES (style=lined) ---

  5. Why would this model not be useful for predicting the height of a typical 45-year-old male?   (1 mark)

    --- 2 WORK AREA LINES (style=lined) ---

Show Answers Only
  1. `text(Gradient = 6)`
  2. `text(Males should grow 6 cm per)`


    `text(year between the ages 11-16.)`

  3. `h = 6a + 80`
  4. `text(182 cm)`
  5. `text(People slow and eventually stop growing)`
  6.  

    `text(after they become adults.)`

Show Worked Solution

i.    `text{Gradient}\ =(176-146)/(16-11)=30/5=6`
 

ii.   `text{Males should grow 6cm per year between the}`

`text{ages 11–16.}`
 

♦♦ Mean marks of 38%, 26% and 25% respectively for parts (i)-(iii).
MARKER’S COMMENT: Interpreting gradients has been consistently examined in recent history and almost always poorly answered. 

iii.   `text{Gradient = 6,  Passes through (11, 146)}`

`y-y_1` `=m(x-x_1)`
`h-146` `=6(a-11)`
`:. h` `=6a-66+146`
  `=6a + 80`


iv.   `text{Substitue}\ \ a=17\ \ \text{into equation from part (iii):}`

`h=(6 xx 17) +80=182`

`:.\ text{A typical 17 year old is expected to be 182cm.}`
  

v.    `text(People slow and eventually stop growing)`
  `text(after they become adults.)`

Filed Under: Bivariate Data Analysis (Y12), Life Expectancy, Other Linear Modelling, S3 Further Statistical Analysis (Y12), S4 Bivariate Data Analysis (Y12) Tagged With: Band 4, Band 5, common-content, smc-1001-10-Line of Best Fit, smc-1001-50-Gradient Interpretation, smc-1001-60-Limitations, smc-1113-10-Line of Best Fit, smc-1113-50-Gradient, smc-1113-60-Limitations, smc-785-10-Line of Best Fit, smc-785-50-Gradient Interpretation, smc-785-60-Limitations

Measurement, STD2 M2 2013 HSC 27e

Karin is in Athens, which is two hours ahead of Greenwich Mean Time. Marco is in New York, which is five hours behind Greenwich Mean Time.

  1. Karin is going to ring Marco at 10 pm on Tuesday, Athens time.


    What day and time will it be in New York when she rings?    (1 mark)

    --- 2 WORK AREA LINES (style=lined) ---

  2. Marco is going to fly from New York to Athens. His flight will leave on Wednesday at 9 am, New York time, and will take 11 hours.


    What day and time will it be in Athens when he arrives?    (2 marks)

    --- 4 WORK AREA LINES (style=lined) ---

Show Answers Only
  1. `text(3pm Tuesday)`
  2. `text(Marco arrives on Thurs at 3am)`
Show Worked Solution

a.    `text(Athens is Greenwich)\ +\ text(2 hours)`

`text(New York is Greenwich – 5 hours)`

`text(Athens is 7hrs ahead of New York)`

`=>\ text(10pm Tuesday in Athens) = text(3pm Tuesday in New York)`
 

`:.\ text(It will be 3pm Tuesday when Karin rings)`


b.    `text(Flight takes 11 hours)`

`text(If Marco leaves on Wed at 9am)`

`=>\ text(He arrives at 9am + 11 hrs + 7 hours)`
 

`:.\ text(Marco arrives on Thurs at 3am)`

Filed Under: M2 Working with Time (Y11), M2 Working with Time (Y11), Time and Time Difference (Std1-2027), Time and Time Difference (Std2-2027) Tagged With: Band 4, smc-1102-10-Time Differences, smc-6306-10-Time Differences, smc-6525-10-Time Differences, smc-776-10-Time Differences

Algebra, STD2 A4 2013 HSC 27a

Lucy went for a bike ride. She left home at 8 am and arrived back at home at 6 pm. A graph representing her journey is shown.

2013 27a

  1. What was the total distance that she rode during the day?   (1 mark)

    --- 2 WORK AREA LINES (style=lined) ---

  2. How much time did Lucy spend riding her bike during the day?     (1 mark)

    --- 2 WORK AREA LINES (style=lined) ---

Show Answers Only
  1. `70\ text(km)`
  2. `6.5\ text(hours)`
Show Worked Solution
a.    `text(Total distance)` `=35 +35`
    `= 70\ text(km)`


b.    `text(Time away from home) = 10\ text(hours)`
`text(Time resting)` `= 1 + 1.5+ 1`
  `= 3.5\ text(hours)`


`:.\ text(Time riding)` `=10-3.5`
  `=6.5\ text(hours)`

Filed Under: AM2 - Linear Relationships (Prelim), Non-Linear: Inverse and Other Problems (Std 2) Tagged With: Band 4, smc-795-20-Other Relationship

Statistics, STD2 S1 2013 HSC 26f

Jason travels to work by car on all five days of his working week, leaving home at 7 am each day. He compares his travel times using roads without tolls and roads with tolls over a period of 12 working weeks.

He records his travel times (in minutes) in a back-to-back stem-and-leaf plot.
 

2013 26f
 

  1. What is the modal travel time when he uses roads without tolls?  (1 mark)

    --- 1 WORK AREA LINES (style=lined) ---

  2. What is the median travel time when he uses roads without tolls?   (1 mark)

    --- 1 WORK AREA LINES (style=lined) ---

  3. Describe how the two data sets differ in terms of the spread and skewness of their distributions.   (2 marks)

    --- 5 WORK AREA LINES (style=lined) ---

Show Answers Only
  1. `52\ text(minutes)`
  2. `50.5\ text(minutes)`
  3. `text(Spread)`
  4. `text{Times without tolls have a tighter spread (range = 22)}`
  5. `text{than times with tolls (range = 55).}`
  6.  

    `text(Skewness)`

  7. `text(Times without tolls shows virtually no skewness while`
  8. `text(times with tolls are positively skewed.)`
Show Worked Solution

a.  `text(Modal time) = 52\ text(minutes)`

♦ Mean mark 36%
MARKER’S COMMENT: Finding a median proved challenging for many students. Take note!


b.  `text(30 times with no tolls)`

`text(Median)` `=\ text(Average of 15th and 16th)`
  `=(50 + 51)/2`
  `= 50.5\ text(minutes)`


♦ Mean mark 39%


 c.  `text(Spread)`

`text{Times without tolls have a much tighter}`

`text{spread (range = 22) than times with tolls}`

`text{(range = 55).}`

`text(Skewness)`

`text(Times without tolls shows virtually no skewness)`

`text(while times with tolls are positively skewed.)`

Filed Under: Bar Charts, Histograms and Other Graphs (Std 1), Data Analysis, Other Chart Types (Y12), Other Charts (Std 2), Other Charts (Std1-2027), Other Charts (Std2-2027), Stem & Leaf, Box & Whisker Tagged With: Band 4, Band 5, num-title-ct-core, num-title-qs-hsc, smc-1128-24-Stem and Leaf, smc-4224-15-Mode, smc-4224-20-Median, smc-4224-35-Describing datasets, smc-4224-40-Stem and Leaf, smc-6311-20-Back-to-Back Stem-and-Leaf, smc-6531-20-Back-to-Back Stem-and-Leaf, smc-822-30-Back-to-Back Stem and Leaf, smc-998-30-Back-to-Back Stem and Leaf

Statistics, STD2 S1 2013 HSC 26b

Write down a set of six data values that has a range of 12, a mode of 12 and a minimum value of 12.   (2 marks)

Show Answers Only

 `12, 12, 12, 16, 18, 24`

Show Worked Solution

`12, 12, 12, 16, 18, 24`

`text(NB. There are many correct solutions.)`


Filed Under: Data Analysis, Measures of Central and Spread (Std1-2027), Measures of Centre and Spread (Std2-2027), Summary Statistics - No Graph (Std 2), Summary Statistics - No graph (Y12), Summary Statistics (no graph), Summary Statistics (Std 1) Tagged With: Band 4, common-content, num-title-ct-core, num-title-qs-hsc, smc-1131-70-Other, smc-4224-10-Range, smc-4224-15-Mode, smc-6312-70-Other, smc-6532-70-Other, smc-824-70-Other, smc-999-70-Other

Measurement, STD2 M6 2013 HSC 26a

Triangle `PQR` is shown. 

2013 26a

Find the size of angle `Q`, to the nearest degree.    (2 marks)

--- 4 WORK AREA LINES (style=lined) ---

Show Answers Only

`110^@\ \ \ text{(nearest degree)}`

Show Worked Solution
♦ Mean mark 47%

`text(Using Cosine rule)`

`cos /_Q` `= (a^2 + b^2-c^2)/(2ab)`
  `= (53^2 + 66^2-98^2)/(2xx53xx66)`
  `=-0.3486…`


`:. /_Q` `= 110.4034…`
  `= 110^@\ \ \ text{(nearest degree)}`

Filed Under: Non-Right Angled Trig, Non-Right Angled Trig (Std2) Tagged With: Band 4, num-title-ct-pathc, num-title-qs-hsc, smc-4553-10-Cosine Rule, smc-804-10-Cosine Rule

Statistics, STD2 S5 2010 HSC 24c

The marks in a class test are normally distributed. The mean is 100 and the standard deviation is 10.

  1. Jason's mark is 115. What is his  `z`-score?  (1 mark)

    --- 1 WORK AREA LINES (style=lined) ---

  2. Mary has a `z`-score of 0. What mark did she achieve in the test?   (1 mark)

    --- 1 WORK AREA LINES (style=lined) ---

  3. What percentage of marks lie between 80 and 110?


    You may assume the following:


    • 68% of marks have a `z`-score between –1 and 1


    • 95% of marks have a `z`-score between  –2 and 2


    • 99.7% of marks have a `z`-score between –3 and 3.   (2 marks) 

    --- 4 WORK AREA LINES (style=lined) ---

Show Answers Only
  1. `1.5`
  2. `100`
  3. `81.5%`
Show Worked Solution

i.     ` text(Given) \ \ mu=100,\ \ sigma=10`

MARKER’S COMMENT: Too may students had calculator errors in this question, giving away easy marks. BE CAREFUL!

`text(If mark is 115,`

`ztext(-score)` `=(115-mu)/sigma`
  `=(115-100)/100`
  `=1.5`


ii.     `z text(-score = 0 when mark equals the mean)`

`:.\ text(Mary’s score was)\ 100`


♦ Mean mark 42%
iii.   `ztext(-score of)\ 110` `=(110-100)/10=1`
`ztext(-score of)\ 80` `=(80-100)/10=–2`


`text(68% of marks lie between)\ z= –1 \ text(and)\  1`

 `=>text(34%  lie between)\ z= 0\ text(and)\ 1`

`text(95%  of marks lie between)\ z= –2 \ text(and)\  2`

 `=> text(47.5%  lie between)\ z= –2\ text(and)\ 0`


`:.\ text(% marks between 80 and 110`

`=\ text(34% + 47.5%)`

`=\ text(81.5%)`

Filed Under: DS5/6 - Normal Distribution and Sampling, Normal Distribution (Y12), S5 The Normal Distribution (Y12) Tagged With: Band 4, Band 5, common-content, smc-819-10-Single z-score, smc-819-20-z-score Intervals, smc-995-10-Single z-score, smc-995-20-z-score Intervals

Algebra, STD2 A1 2010 HSC 24a

Fred tried to solve this equation and made a mistake in Line 2. 

\begin{array}{rl}
4(y+2)-3(y+1)= -3\ & \ \ \ \text{Line 1} \\
4y+8-3y+3= -3\ &\ \ \ \text{Line 2} \\
y+11 =-3\ &\ \ \ \text{Line 3} \\
y =-14& \ \ \ \text{Line 3}
\end{array}

Copy the equation in Line 1.

  1. Rewrite Line 2 correcting his mistake.   (1 mark)

    --- 1 WORK AREA LINES (style=lined) ---

  2. Continue your solution showing the correct working for Lines 3 and 4 to solve this equation for `y`.   (1 mark)

    --- 2 WORK AREA LINES (style=lined) ---

Show Answers Only
  1.  `4y+8+3y-3=-3`
  2. `y+5=-3`


    `y=-8`

Show Worked Solution
a.     `4(y+2)-3(y+1)` `=-3\ \ \ \ \ \ \ text(Line)\ 1`
  `4y+8-3y-3` `=-3\ \ \ \ \ \  text(Line)\ 2`


b.     `y+5` `=-3\ \ \ \ \ \ \ text(Line)\ 3`
  `y` `=-8\ \ \ \ \ \ \ text(Line)\ 4`

Filed Under: AM1 - Algebra (Prelim), Linear, Substitution and Other Equations (Std 1), Substitution and Other Equations (Std 2), Substitution and Other Equations (Std1-2027), Substitution and Other Equations (Std2-2027) Tagged With: Band 4, num-title-ct-corea, num-title-qs-hsc, smc-1116-40-Find the Mistake, smc-6234-40-Find the Mistake, smc-6508-40-Find the Mistake, smc-789-40-Find the Mistake

Measurement, STD2 M7 2010 HSC 23b

The elevation and floor plan of a building are shown.

2010 23b

Calculate the area of the floor of this building in square metres.   (2 marks)

--- 4 WORK AREA LINES (style=lined) ---

Show Answers Only

`46\ text(m²)`

Show Worked Solution
MARKER’S COMMENT: Less errors were made by students who converted to metres FIRST, before calculating the area.
`text(Floor Area)` `=text(Area)\ 1+text(Area)\ 2`
  `=(8xx5)+(2xx3) \ \ \ \ text{(1 m = 1000 mm)}`
  `=46\ text(m²)`

Filed Under: M5 Scale Drawings (Y12), Ratio and Scale (Std2), Similarity and Scale Tagged With: Band 4, smc-1105-10-Floor Plans, smc-1187-50-Floor Plans

Algebra, STD2 A1 2010 HSC 18 MC

Which of the following correctly express  `x`  as the subject of  `a=(nx)/5` ?

  1. `x=(an)/5`
  2. `x=(5a)/n`
  3. `x=(a-5)/n`
  4. `x=5a-n`
Show Answers Only

`B`

Show Worked Solution
`a` `=(nx)/5`
`nx` `=5a`
`x` `=(5a)/n`

 
`=>  B`

Filed Under: Formula Rearrange, Formula Rearrange (Std 1), Formula Rearrange (Std 2), Formula Rearrange (Std1-2027), Formula Rearrange (Std2-2027), Linear Tagged With: Band 4, num-title-ct-pathc, num-title-qs-hsc, smc-1200-10-Linear, smc-1201-10-Linear, smc-4362-20-Formula rearrange, smc-6236-10-Linear, smc-6511-10-Linear

Measurement, STD2 M2 2010 HSC 15 MC

In this diagram of the Earth, `O` represents the centre and `B` lies on both the Equator and the Greenwich Meridan.

What is the latitude and longitude of point A?

  1.    30°N  110°E
  2.    30°N  110°W
  3.    60°N  110°E
  4.    60°N  110°W
Show Answers Only

`A`

Show Worked Solution

 `text(S)text(ince A is)  30^circ\  text(North of the Equator)`

   `=> text(Latitude is)  30^circN`

  `text(S)text(ince A is)  110^circ\  text(East of Greenwich)`

    `=>text(Longitude is)  110^circE`
 

`:. A\ text(is) \ \  30^circN  110^circE`

`=>  A`

Filed Under: M2 Working with Time (Y11), Position on the Earth's Surface (Std1-2027), Positions on the Earth's Surface (Std2-2027) Tagged With: Band 4, smc-6305-20-Earth Coordinates, smc-6524-20-Earth Coordinates, smc-776-30-Earth Coordinates

Statistics, STD2 S1 2009 HSC 24c

The Australian Bureau of Statistics provides the NSW government with data on the age of residents living in different areas across the state. After analysing this data, the government makes decisions relating to the provision of services or facilities.

Give an example of a possible decision the government might make and describe how the data might justify this decision.     (2 marks)

--- 4 WORK AREA LINES (style=lined) ---

Show Answers Only

`text(The data might show that a large number of retirees live in a)`

`text(particular area. The government could decide to increase)`

`text(public transport in the area as the older retirees get, the more)`

`text(they rely on public transport.)`

Show Worked Solution

`text{One example (of many):}`

`text(The data might show that a large number of retirees live in a)`

`text(particular area. The government could decide to increase)`

`text(public transport in the area as the older retirees get, the more)`

`text(they rely on public transport.)`

Filed Under: Classifying Data (Std 1), Classifying Data (Std 2), Data Classification, Investigation and Sampling Methods (Std1-2027), Data Classification, Investigation and Sampling Methods (Std2-2027), DS1 - Stats and society Tagged With: Band 4, common-content, smc-1127-30-Other, smc-6309-30-Other, smc-6529-30-Other, smc-820-30-Other

Statistics, STD2 S1 2009 HSC 24b

Tayvan is an international company that reports its profits in the USA, Belgium and India at the end of each quarter. The profits for 2008 are shown in the area chart.

2009 24b

  1. What was the total profit for Tayvan on June 30?   (1 mark)
  2. What was Tayvan’s profit in Belgium on March 31?     (1 mark)
Show Answers Only
  1. `$8\ 000\ 000\ \ text{(from graph)}`
  2. `$4\ 000\ 000`
Show Worked Solution
MARKER’S COMMENT: Area charts provide cumulative totals. Many students did not know this and incorrectly answered 14 million.
(i)     `$8\ 000\ 000\ \ \ text{(from graph)}`


(ii)    `text{Belgium profit (30 March)}`
  `= $5\ 000\ 000-$1\ 000\ 000` 
  `= $4\ 000\ 000`

Filed Under: Other Graphs Tagged With: Band 3, Band 4

Statistics, STD2 S1 2009 HSC 24a

The diagram below shows a stem-and-leaf plot for 22 scores. 
 

2UG-2009-24a
 

  1.  What is the mode for this data?   (1 mark)

    --- 1 WORK AREA LINES (style=lined) ---

  2.  What is the median for this data?     (1 mark)

    --- 1 WORK AREA LINES (style=lined) ---

Show Answers Only
  1. `78`
  2. `46`
Show Worked Solution

a.   `text(Mode) = 78`


b.    `22\ text(scores)`

`=>\ text(Median is the average of 11th and 12th scores)`
 

`:.\ text(Median)` `= (45 + 47)/2`
  `= 46`

Filed Under: Bar Charts, Histograms and Other Graphs (Std 1), Data Analysis, Other Chart Types (Y12), Other Charts (Std 2), Other Charts (Std1-2027), Other Charts (Std2-2027), Stem & Leaf, Box & Whisker Tagged With: Band 3, Band 4, common-content, num-title-ct-core, num-title-qs-hsc, smc-1128-24-Stem and Leaf, smc-4224-15-Mode, smc-4224-20-Median, smc-4224-40-Stem and Leaf, smc-6311-10-Stem-and-Leaf, smc-6531-10-Stem-and-Leaf, smc-822-20-Stem and Leaf, smc-998-20-Stem and Leaf

Financial Maths, STD2 F1 2009 HSC 23d

The tables below show information about fees for MyBank accounts. 

2009 23d

  1. Li has a Cheap Access Account. During September, he made


        • five withdrawals using internet banking
        • two cash withdrawals from a MyBank ATM
        • four EFTPOS purchases
        • two cash withdrawals at other ATMs.


    What was the total amount that Li paid in bank fees for the month of September?  (3 marks)

    --- 6 WORK AREA LINES (style=lined) ---

  2. In October, what is the maximum that Li could pay in withdrawal fees to ensure that a Cheap Access Account costs him no more than a Free Access Account?    (1 mark)

    --- 2 WORK AREA LINES (style=lined) ---

Show Answers Only
  1. `$12.50`
  2. `$3`
Show Worked Solution
a.    `text(Withdrawals from internet)` `5 xx 0.30` `= 1.50`
  `text(Withdrawals from MyBank ATM)` `2 xx 0.50` `= 1.00`
  `text(EFTPOS purchases)` `4 xx 0.50` `=2.00`
  `text(Withdrawal from other ATMs)` `2 xx 2.00` `=4.00`
  `text(Account Fee)` `1 xx 4.00` `= 4.00`


`:.\ text(Total bank fees in Sep)`

`= 1.50 + 1.00 + 2.00 + 4.00 + 4.00`

`= $12.50`


b.   `text(Monthly account fee (Cheap Access) ) = $4`

♦ Mean mark 47%
MARKER’S COMMENT: Many students misinterpreted this question. Read carefully!

`text(Monthly account fee (Free Access) ) =$7`

`text(Difference) = 7 -4 = $3`

 
`:.\ text(Maximum Li could pay in withdrawal fees)`

`text(is $3 to ensure Cheap Access costs no more.)`

Filed Under: Budgeting (Std1-2027), Budgeting (Std2-2027), Earning Money and Budgeting (Std 1), Earning Money and Budgeting (Std 2), FM1 - Earning money Tagged With: Band 4, smc-1126-30-Budgeting, smc-6279-10-Personal Budget, smc-6518-10-Personal Budget, smc-810-30-Budgeting

Measurement, STD2 M1 2009 HSC 23c

The diagram shows the shape and dimensions of a terrace which is to be tiled.
 

  1. Find the area of the terrace.   (2 marks)

    --- 5 WORK AREA LINES (style=lined) ---

  2. Tiles are sold in boxes. Each box holds one square metre of tiles and costs $55. When buying the tiles, 10% more tiles are needed, due to cutting and wastage.


    Find the total cost of the boxes of tiles required for the terrace.   (2 marks)

    --- 4 WORK AREA LINES (style=lined) ---

Show Answers Only

a.    `13.77\ text(m²)`

b.   `$880`

Show Worked Solution
a.
`text(Area)` `=\ text(Area of big square – Area of 2 cut-out squares`
  `= (2.7 + 1.8) xx (2.7 + 1.8)\-2 xx (1.8 xx 1.8)`
  `= 20.25\-6.48`
  `= 13.77\ text(m²)`


b. `text(Tiles required)` `= (13.77 +10 text{%}) xx 13.77`
    `= 15.147\ text(m²)`


 `=>\ text(16 boxes are needed)`

`:.\ text(Total cost of boxes)` `=16 xx $55`
  `= $880`

Filed Under: Area and Surface Area, M4 Rates (Y12), MM1 - Units of Measurement, MM2 - Perimeter, Area and Volume (Prelim), Perimeter and Area (Std 1), Perimeter and Area (Std1-2027), Perimeter and Area (Std2-2027), Perimeter, Area and Volume (Std 2), Rates (Std2) Tagged With: Band 4, num-title-ct-corea, num-title-qs-hsc, smc-1104-15-General rate problems, smc-1121-10-Perimeter and Area, smc-4234-10-Area (std), smc-6483-20-Composite Areas, smc-6520-20-Composite areas, smc-798-10-Perimeter and Area, smc-805-60-Other rate problems

Measurement, STD2 M6 2009 HSC 23a

The point `A` is 25 m from the base of a building. The angle of elevation from `A` to the top of the building is 38°.
 

  1. Show that the height of the building is approximately 19.5 m.   (1 mark)

    --- 2 WORK AREA LINES (style=lined) ---

  2. A car is parked 62 m from the base of the building.


    What is the angle of depression from the top of the building to the car?


    Give your answer to the nearest minute.   (2 marks)

    --- 5 WORK AREA LINES (style=lined) ---

Show Answers Only

i.    `text{Proof  (See Worked Solutions)}`

ii.   `17°28^{′}`

Show Worked Solution

i.  `text(Need to prove height (h) ) ~~ 19.5\ text(m)`

`tan 38^@` `= h/25`
`h` `= 25 xx tan38^@`
  `= 19.5321…`
  `~~ 19.5\ text(m)\ \ text(… as required.)`


ii.  

`text(Let)\ \ /_ \ text(Elevation (from car) ) = theta`

♦♦ Mean mark 33%
MARKER’S COMMENT: If >30 “seconds”, round to the higher “minute”.
`tan theta` `= h/62`
  `= 19.5/62`
  `= 0.3145…`
`:. theta` `= 17.459…`
  `= 17°27^{′}33^{″}..`
  `=17°28^{′}\ \ text{(nearest minute)}`


`:./_ \ text(Depression to car) =17°28^{′}\ \ text{(alternate to}\ theta text{)}`

Filed Under: M3 Right-Angled Triangles (Y12), Pythagoras and basic trigonometry, Pythagoras and Right-Angled Trig (Std2), Right-Angled Trig Tagged With: Band 4, Band 5, num-title-ct-coreb, num-title-qs-hsc, smc-1103-20-Right-angled Trig, smc-1103-30-Angle of Depression, smc-1103-40-Angle of Elevation, smc-4552-40-Real world applications, smc-4552-50-Angle of depression, smc-4552-60-Angle of elevation, smc-802-20-Right-Angled Trig, smc-802-30-Angle of Depression, smc-802-40-Angle of Elevation

Measurement, STD2 M1 2009 HSC 19 MC

Two identical spheres fit exactly inside a cylindrical container, as shown.
 

The diameter of each sphere is 12 cm.

What is the volume of the cylindrical container, to the nearest cubic centimetre?

  1. `1357\ text(cm)^3`
  2. `2714\ text(cm)^3`
  3. `5429\ text(cm)^3`
  4. `10\ 857\ text(cm)^3`
Show Answers Only

`B`

Show Worked Solution

`text(S)text(ince diameter sphere = 12 cm) `

`=>\ text(Radius of cylinder = 6 cm)`

`text(Height of cylinder)` `= 2 xx text(diameter of sphere)`
  `= 2 xx 12`
  `= 24\ text(cm)`
   
`:.\ text(Volume cylinder)` `= pi r^2 h`
  `= pi xx 6^2 xx 24`
  `= 2714.336…\ text(cm³)`

 
`=>  B`

Filed Under: MM2 - Perimeter, Area and Volume (Prelim), Perimeter, Area and Volume (Std 2), Volume, Mass and Capacity (Std1-2027), Volume, Mass and Capacity (Std2-2027) Tagged With: Band 4, smc-6304-50-Volume (Circular Measure), smc-6521-50-Volume (Circular Measure), smc-798-50-Volume (Circular Measure)

Data, 2UG 2009 HSC 18 MC

Huong used the ‘capture–recapture’ technique to estimate the number of trout living in a dam.

• She caught, tagged and released 20 trout.

• Later she caught 36 trout at random from the same dam.

• She found that 8 of these 36 trout had been tagged.

What estimate should Huong give for the total number of trout living in this dam, based on her use of the ‘capture–recapture’ technique?

(A)   `56` 

(B)   `90` 

(C)  `160` 

(D)  `162` 

Show Answers Only

`B`

Show Worked Solution
TIP: Work out a set structure to answer these types of questions efficiently. One example is shown in the Worked Solution where the Capture and Recapture are both stated as fractions <1 and then equated.

`text(Let population) = P`

`text(Capture) = 20/P`

`text(Recapture) = 8/36`

`=> 20/P` `= 8/36`
`8P` `= 36 xx 20`
`P` `= (36 xx 20)/8`
  `= 90`

`=>  B`

Filed Under: DS5/6 - Normal Distribution and Sampling Tagged With: Band 4

  • « Previous Page
  • 1
  • …
  • 110
  • 111
  • 112
  • 113
  • 114
  • Next Page »

Copyright © 2014–2025 SmarterEd.com.au · Log in