- Express `2 cos theta + 2 cos (theta + pi/3)` in the form `R cos (theta + alpha)`,
where `R > 0` and `0 < alpha < pi/2`. (3 marks)
--- 12 WORK AREA LINES (style=lined) ---
- Hence, or otherwise, solve `2 cos theta + 2 cos (theta + pi/3) = 3`,
- for `0 < theta < 2pi`. (2 marks)
--- 8 WORK AREA LINES (style=lined) ---
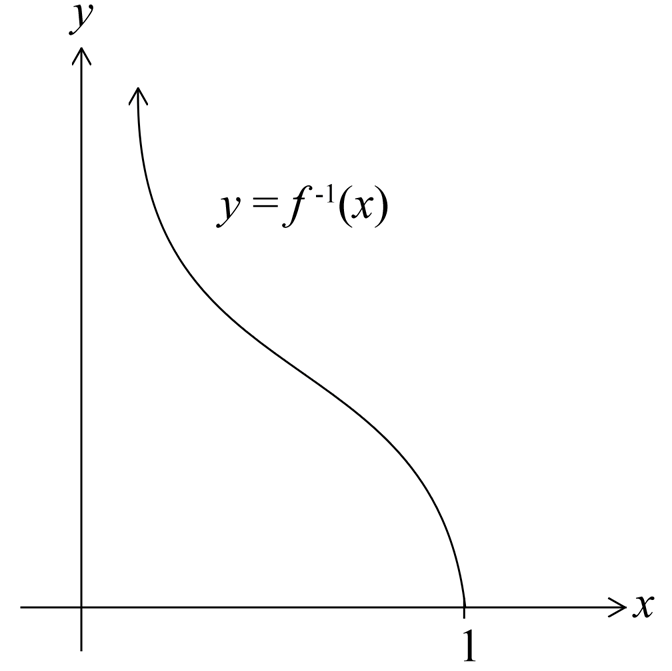
Inverse Functions, EXT1 2010 HSC 3b
Let `f(x) = e^(-x^2)`. The diagram shows the graph `y = f(x)`.

- The graph has two points of inflection.
- Find the `x` coordinates of these points. (3 marks)
- Explain why the domain of `f(x)` must be restricted if `f(x)` is to have an inverse function. (1 mark)
- Find a formula for `f^(-1) (x)` if the domain of `f(x)` is restricted to `x ≥ 0`. (2 marks)
- State the domain of `f^(-1) (x)`. (1 mark)
- Sketch the curve `y = f^(-1) (x)`. (1 mark)
- (1) Show that there is a solution to the equation `x = e^(-x^2)` between `x = 0.6` and `x = 0.7`. (1 mark)
- (2) By halving the interval, find the solution correct to one decimal place. (1 mark)
Show Answers Only
- `x = +- 1/sqrt2`
- `text(There can only be 1 value of)\ y`
- `text(for each value of)\ x.`
- `f^(-1)x = sqrt(ln(1/x))`
- `0 <= x <= 1`
- (1) `text(Proof)\ \ text{(See Worked Solutions)}`
- (2) `0.7\ text{(1 d.p.)}`

Show Worked Solution
| (i) | `y` | `= e^(-x^2)` |
| `dy/dx` | `= -2x * e^(-x^2)` | |
| `(d^2y)/(dx^2)` | `= -2x (-2x * e^(-x^2)) + e ^(-x^2) (-2)` | |
| `= 4x^2 e^(-x^2)\ – 2e^(-x^2)` | ||
| `= 2e^(-x^2) (2x^2\ – 1)` |
`text(P.I. when)\ \ (d^2y)/(dx^2) = 0`
| `2e^(-x^2) (2x^2\ – 1)` | `= 0` |
| `2x^2\ – 1` | `= 0` |
| `x^2` | `= 1/2` |
| `x` | `= +- 1/sqrt2` |
COMMENT: It is also valid to show that `f(x)` is an even function and if a P.I. exists at `x=a`, there must be another P.I. at `x=–a`.
| `text(When)\ \ ` | `x < 1/sqrt2,` | `\ (d^2y)/(dx^2) < 0` |
| `x > 1/sqrt2,` | `\ (d^2y)/(dx^2) > 0` |
`=>\ text(Change of concavity)`
`:.\ text(P.I. at)\ \ x = 1/sqrt2`
| `text(When)\ \ ` | `x < – 1/sqrt2,` | `\ (d^2y)/(dx^2) > 0` |
| `x > – 1/sqrt2,` | `\ (d^2y)/(dx^2) < 0` |
`=>\ text(Change of concavity)`
`:.\ text(P.I. at)\ \ x = – 1/sqrt2`
| (ii) | `text(In)\ f(x), text(there are 2 values of)\ y\ text(for)` |
| `text(each value of)\ x.` | |
| `:.\ text(The domain of)\ f(x)\ text(must be restricted)` | |
| `text(for)\ \ f^(-1) (x)\ text(to exist).` |
| (iii) | `y = e^(-x^2)` |
`text(Inverse function can be written)`
| `x` | `= e^(-y^2),\ \ \ x >= 0` |
| `lnx` | `= ln e^(-y^2)` |
| `-y^2` | `= lnx` |
| `y^2` | `= -lnx` |
| `=ln(1/x)` | |
| `y` | `= +- sqrt(ln (1/x))` |
`text(Restricting)\ \ x>=0,\ \ =>y>=0`
`:. f^(-1) (x)=sqrt(ln (1/x))`
♦ Parts (iv) and (v) were poorly answered with mean marks of 39% and 49% respectively.
| (iv) | `f(0) = e^0 = 1` |
`:.\ text(Range of)\ \ f(x)\ \ text(is)\ \ 0 < y <= 1`
`:.\ text(Domain of)\ \ f^(-1) (x)\ \ text(is)\ \ 0 < x <= 1`
| (v) |
|
(vi)(1) `x = e^(-x^2)`
`text(Let)\ g(x) = x\ – e^(-x^2)`
| `g(0.6)` | `=0.6\ – e^(-0.6^2)` |
| `=0.6\ – 0.6977 < 0` | |
| `g(0.7)` | `=0.7\ – e^(-0.7^2)` |
| `=0.7\ – 0.6126 > 0` | |
| `=>g(x)\ text(changes sign)` | |
`:.\ g(x)\ \ text(has a root between 0.6 and 0.7)`
`:.\ x = e^(-x^2)\ \ text(has a solution between 0.6 and 0.7)`
♦ Mean mark 37%.
MARKER’S COMMENT: Better responses showed the change in sign between `g(0.65)` and `g(0.7)` as shown in the solution.
MARKER’S COMMENT: Better responses showed the change in sign between `g(0.65)` and `g(0.7)` as shown in the solution.
| (vi)(2) | `g(0.65)` | `=0.65\ – e^(-0.65^2)` |
| `=0.65\ – 0.655 < 0` |
`:.\ text(A solution lies between 0.65 and 0.7)`
`:.\ x = 0.7\ \ text{(1 d.p.)}`
Combinatorics, EXT1 A1 2010 HSC 3a
At the front of a building there are five garage doors. Two of the doors are to be painted red, one is to be painted green, one blue and one orange.
- How many possible arrangements are there for the colours on the doors? (1 mark)
--- 1 WORK AREA LINES (style=lined) ---
- How many possible arrangements are there for the colours on the doors if the two red doors are next to each other? (1 mark)
--- 2 WORK AREA LINES (style=lined) ---
Calculus, EXT1 C1 2011 HSC 7a
The diagram shows two identical circular cones with a common vertical axis. Each cone has height `h` cm and semi-vertical angle 45°.

The lower cone is completely filled with water. The upper cone is lowered vertically into the water as shown in the diagram. The rate at which it is lowered is given by
`(dl)/(dt) = 10`,
where `l` cm is the distance the upper cone has descended into the water after `t` seconds.
As the upper cone is lowered, water spills from the lower cone. The volume of water remaining in the lower cone at time `t` is `V` cm³.
- Show that `V = pi/3(h^3\ - l^3)`. (1 mark)
--- 4 WORK AREA LINES (style=lined) ---
- Find the rate at which `V` is changing with respect to time when `l = 2`. (2 marks)
--- 5 WORK AREA LINES (style=lined) ---
- Find the rate at which `V` is changing with respect to time when the lower cone has lost `1/8` of its water. Give your answer in terms of `h`. (2 marks)
--- 6 WORK AREA LINES (style=lined) ---
Statistics, EXT1 S1 2011 HSC 6c
A game is played by throwing darts at a target. A player can choose to throw two or three darts.
Darcy plays two games. In Game 1, he chooses to throw two darts, and wins if he hits the target at least once. In Game 2, he chooses to throw three darts, and wins if he hits the target at least twice.
The probability that Darcy hits the target on any throw is `p`, where `0 < p < 1`.
- Show that the probability that Darcy wins Game 1 is `2p- p^2`. (1 mark)
--- 4 WORK AREA LINES (style=lined) ---
- Show that the probability that Darcy wins Game 2 is `3p^2- 2p^3`. (1 mark)
--- 3 WORK AREA LINES (style=lined) ---
- Prove that Darcy is more likely to win Game 1 than Game 2. (2 marks)
--- 3 WORK AREA LINES (style=lined) ---
- Find the value of `p` for which Darcy is twice as likely to win Game 1 as he is to win Game 2. (2 marks)
--- 6 WORK AREA LINES (style=lined) ---
Trig Ratios, EXT1 2011 HSC 5a
In the diagram, `Q(x_0, y_0)` is a point on the unit circle `x^2 + y^2 = 1` at an angle `theta` from the positive `x`-axis, where `− pi/2 < theta < pi/2`. The line through `N(0, 1)` and `Q` intersects the line `y = –1` at `P`. The points `T(0, y_0)` and `S(0, –1)` are on the `y`-axis.

- Use the fact that `Delta TQN` and `Delta SPN` are similar to show that
- `SP = (2costheta)/(1\ - sin theta)`. (2 marks)
- Show that `(costheta)/(1\ - sin theta) = sec theta + tan theta`. (1 mark)
- Show that `/_ SNP = theta/2 + pi/4`. (1 mark)
- Hence, or otherwise, show that `sectheta + tantheta = tan(theta/2 + pi/4)`. (1 mark)
- Hence, or otherwise, solve `sec theta + tan theta = sqrt3`, where `-pi/2 < theta < pi/2`. (2 marks)
Show Worked Solution
| (i) |  |
♦ Mean mark 41%
MARKER’S COMMENT: When questions direct you to use a certain fact for a proof, use that fact!
MARKER’S COMMENT: When questions direct you to use a certain fact for a proof, use that fact!
`text(Show)\ SP = (2 cos theta)/(1\ – sin theta)`
`Delta SPN \ text(|||) \ Delta TQN\ \ \ text{(given)}`
`(SP)/(SN) = (TQ)/(TN)\ \ \ text{(corresponding sides of similar triangles)}`
`/_TQO = theta\ \ \ text{(alternate,}\ TQ\ text(||)\ x text{-axis)}`
| `sin theta` | `= (OT)/1 => OT = sin theta` | |
| `=>` | `TN` | `= 1\ – sin theta` |
| `cos theta` | `= (TQ)/1` | |
| `=>` | `TQ` | `= cos theta` |
| `SN` | `= 2\ \ \ text{(diameter of unit circle)}` |
| `:. (SP)/2` | `= cos theta/(1\ – sin theta)` |
| `SP` | `= (2 cos theta)/(1\ – sin theta)\ \ \ text(… as required)` |
(ii) `text(Show)\ \ costheta/(1\ – sin theta) = sec theta + tan theta`
♦ Mean mark 35%
| `text(RHS)` | `= 1/(costheta) + (sintheta)/(costheta)` |
| `=(1 + sin theta)/cos theta xx cos theta/cos theta` | |
| `= (costheta(1 + sintheta))/(cos^2theta)` | |
| `= (costheta(1 + sin theta))/(1\ – sin^2 theta)` | |
| `= (costheta(1 + sin theta))/((1 + sin theta)(1\ – sin theta)` | |
| `= costheta/(1\ – sin theta)\ \ \ text(… as required)` |
(iii) `text(Show)\ \ /_SNP = theta/2 + pi/4`
♦♦♦ Mean mark 11%
`/_TOQ = 90\ – theta`
`text(S)text(ince)\ ON = OQ = 1\ text{(unit circle)}`
`=> Delta ONQ\ text(is isosceles)`
| `:.\ /_SNP` | `= 1/2 (180\ – (90\ – theta))\ \ \ \ text{(angle sum of}\ Delta ONQ text{)}` |
| `= 90\ – 45 + theta/2` | |
| `= 45 + theta/2` | |
| `= pi/4 + theta/2\ \ \ text(… as required)` |
(iv) `text(Show)\ sec theta + tan theta = tan (theta/2 + pi/4)`
♦♦ Mean mark 28%
`text(S)text(ince)\ /_SNP = pi/4 + theta/2\ \ \ \ text{(} text(part)\ text{(iii)} text{)}`
`=> tan\ /_SNP = tan (pi/4 + theta/2)`
| `text(Also,)\ tan\ /_SNP` | `= (SP)/(SN)` |
| `= ((2costheta)/(1\ – sin theta))/2` | |
| `= (cos theta)/(1\ – sin theta)` | |
| `= sec theta + tan theta\ \ \ \ text{(part (ii))}` |
`:.\ sec theta + tan theta = tan (pi/4 + theta/2)\ \ \ text(… as required)`
♦ Mean mark 45%
| (v) | `sec theta + tan theta` | `= sqrt3,\ \ \ (-pi/2 < theta < pi/2)` |
| `tan (pi/4 + theta/2)` | `= sqrt3\ \ \ \ text{(part (iv))}` | |
| `tan (pi/3)` | `= sqrt 3` |
`text(S)text(ince tan is positive in)\ 1^text(st) // 3^text(rd)\ text(quads)`
| `theta/2 + pi/4` | `= pi/3,\ (4pi)/3` |
| `theta/2` | `= pi/12\ \ \ \ (-pi/2 < theta < pi/2)` |
| `:.\ theta` | `= pi/6\ text(radians)` |
Plane Geometry, EXT1 2011 HSC 4b
In the diagram, the vertices of `Delta ABC` lie on the circle with centre `O`. The point `D` lies on `BC` such that `Delta ABD` is isosceles and `/_ABC = x`.

Copy or trace the diagram into your writing booklet.
- Explain why `/_AOC = 2x`. (1 mark)
- Prove that `ACDO` is a cyclic quadrilateral. (2 marks)
- Let `M` be the midpoint of `AC` and `P` the centre of the circle through `A, C, D` and `O`.
- Show that `P, M` and `O` are collinear. (1 mark)
Show Worked Solution
| (i) |  |
`/_AOC = 2x`
`text{(angles at circumference and}`
`text{centre on arc}\ AC text{)}`
♦ Mean mark 38%
STRATEGY: Proving part (ii) by showing opposite angles are supplementary also worked but was more time consuming.
STRATEGY: Proving part (ii) by showing opposite angles are supplementary also worked but was more time consuming.
(ii) `text(Prove)\ ACDO\ text(is cyclic)`
`text(S)text(ince)\ Delta ADB\ text(is isosceles)`
`/_DAB = x\ \ \ text{(opposite equal sides in}\ Delta DBA text{)}`
| `=> /_ADB` | `= 180\ – 2x\ \ \ text{(angle sum of}\ Delta DAB text{)}` |
| `=> /_CDA` | `= 2x\ \ \ text{(}CDB\ text{is a straight angle)}` |
`text(S)text(ince chord)\ AC\ text(subtends)\ /_CDA = 2x`
`text(and)\ /_COA = 2x,`
`:.\ text(Quadrilateral)\ ACDO\ text(must be cyclic.)`
| (iii) |  |
`text(Need to show)\ OM\ text(passes through)\ P,\ text(centre)`
♦♦♦ Mean mark 7%. 2nd hardest question in the 2011 paper!
`text(of circle through)\ ACDO.`
| `AM` | `= CM\ text{(} M\ text(is midpoint) text{)}` |
| `OC` | `= OA\ text{(radii)}` |
`OM\ text(is common)`
`:.\ Delta OAM -= Delta OCM\ \ \ text{(SSS)}`
| `:. /_CMO = /_AMO\ \ \ ` | `text{(corresponding angles of}` |
| `\ \ text{congruent triangles)}` |
`text(S)text(ince)\ ∠AMC\ text(is straight angle)`
`/_CMO = /_AMO = 90°`
`:.OM\ text(is perpendicular bisector)`
`text(of chord)\ AC.`
`:. OM\ text(passes through)\ P.`
`:.\ P, M,\ text(and)\ O\ text(are collinear.)`
Quadratic, EXT1 2011 HSC 3b
The diagram shows two distinct points `P(t, t^2)` and `Q(1\ - t, (1\ - t)^2)` on the parabola `y = x^2`. The point `R` is the intersection of the tangents to the parabola at `P` and `Q`.

- Show that the equation of the tangent to the parabola at `P` is `y = 2tx\ – t^2`. (2 marks)
- Using part `text{(i)}`, write down the equation of the tangent to the parabola at `Q`. (1 mark)
- Show that the tangents at `P` and `Q` intersect at
`R (1/2, t\ - t^2)`. (2 marks) - Describe the locus of `R` as `t` varies, stating any restriction on the `y`-coordinate. (2 marks)
Show Worked Solution
| (i) |  |
`text(Show tangent at)\ P\ text(is)\ y = 2tx\ – t^2`
| `y` | `= x^2` |
| `dy/dx` | `= 2x` |
`x=t\ \ \ \ text(at)\ P`
`dy/dx = 2t`
`text(Find equation with)\ \ m = 2t\ \ text(through)\ \ P(t, t^2)`
| `y\ – y_1` | `= m(x\ – x_1)` |
| `y\ – t^2` | `= 2t ( x\ – t)` |
| `y` | `= 2tx\ – 2t^2 + t^2` |
| `= 2tx\ – t^2\ text(… as required)` |
(ii) `text(T)text(angent at)\ Q\ text(has equation)`
MARKER’S COMMENT: Many students derived this equation rather than substituting the new parameter, costing them valuable time. This is a benefit of using the parametric approach.
`y = 2(1\ – t)x\ – (1\ – t)^2`
(iii) `text(Need to show)\ R(1/2,\ t\ – t^2)`
`R\ text(is at intersection of tangents)`
| `2tx\ – t^2` | `= 2(1\ – t)x\ – (1\ – t)^2` |
| `2tx\ – t^2` | `= 2x\ – 2tx\ – 1 + 2t\ – t^2` |
| `4tx\ – 2x` | `= -1 + 2t\ – t^2 + t^2` |
| `2x(2t\ – 1)` | `= 2t\ – 1` |
| `2x` | `= 1` |
| `x` | `= 1/2` |
`text(Using)\ \ y = 2tx – t^2\ \ text(when)\ \ x = 1/2`
| `y` | `= 2t(1/2)\ – t^2` |
| `= t\ – t^2` |
`:.\ R(1/2, t\ – t^2)\ text(… as required)`
(iv) `text(Locus of)\ R`
♦♦ Mean mark of 22%.
MARKER’S COMMENT: Many students stated the locus as `y=t-t^2` rather than realising it had to be a straight line since `x=½`, and that `y=t-t^2` simply restricted the values of `y`.
MARKER’S COMMENT: Many students stated the locus as `y=t-t^2` rather than realising it had to be a straight line since `x=½`, and that `y=t-t^2` simply restricted the values of `y`.
`text(S)text(ince)\ x = 1/2\ text(is a constant)`
`R\ text(is a vertical line)`
`text(Now,)\ y = t\ – t^2 = t(1\ – t)`

`text(Graphically,)\ \ y\ \ text(has a maximum at)\ \ t = 1/2`
`text(Max)\ \ y = 1/2\ – (1/2)^2 = 1/4`
`=> y < 1/4\ \ text{(tangents can’t meet on parabola)}`
`:.\ text(Locus of)\ R\ text(is vertical line)\ x = 1/2,\ \ y<1/4`
Mechanics, EXT2* M1 2011 HSC 3a
The equation of motion for a particle undergoing simple harmonic motion is
`(d^2x)/(dt^2) = -n^2 x`,
where `x` is the displacement of the particle from the origin at time `t`, and `n` is a positive constant.
- Verify that `x = A cos nt + B sin nt`, where `A` and `B` are constants, is a solution of the equation of motion. (1 mark)
--- 5 WORK AREA LINES (style=lined) ---
- The particle is initially at the origin and moving with velocity `2n`.
Find the values of `A` and `B` in the solution `x = A cos nt + B sin nt`. (2 marks)
--- 6 WORK AREA LINES (style=lined) ---
- When is the particle first at its greatest distance from the origin? (1 mark)
--- 5 WORK AREA LINES (style=lined) ---
- What is the total distance the particle travels between `t = 0` and `t = (2pi)/n`? (1 mark)
--- 6 WORK AREA LINES (style=lined) ---
L&E, EXT1 2011 HSC 1f
What is the range of the function `f(x) = ln(x^2 + e)`? (1 mark)
Calculus, EXT1 C1 2012 HSC 14c
A plane `P` takes off from a point `B`. It flies due north at a constant angle `alpha` to the horizontal. An observer is located at `A`, 1 km from `B`, at a bearing 060° from `B`.
Let `u` km be the distance from `B` to the plane and let `r` km be the distance from the observer to the plane. The point `G` is on the ground directly below the plane.

- Show that `r = sqrt(1 + u^2 - u cos alpha)`. (3 marks)
--- 10 WORK AREA LINES (style=lined) ---
- The plane is travelling at a constant speed of 360 km/h.
- At what rate, in terms of `alpha`, is the distance of the plane from the observer changing 5 minutes after take-off? (2 marks)
--- 6 WORK AREA LINES (style=lined) ---
Mechanics, EXT2* M1 2012 HSC 14b
A firework is fired from `O`, on level ground, with velocity `70` metres per second at an angle of inclination `theta`. The equations of motion of the firework are
`x = 70t cos theta\ \ \ \ `and`\ \ \ y = 70t sin theta\ – 4.9t^2`. (Do NOT prove this.)
The firework explodes when it reaches its maximum height.

- Show that the firework explodes at a height of `250 sin^2 theta` metres. (2 marks)
--- 6 WORK AREA LINES (style=lined) ---
- Show that the firework explodes at a horizontal distance of `250 sin 2 theta` metres from `O`. (1 mark)
--- 4 WORK AREA LINES (style=lined) ---
- For best viewing, the firework must explode at a horizontal distance between 125 m and 180 m from `O`, and at least 150 m above the ground.
For what values of `theta` will this occur? (3 mark)
--- 8 WORK AREA LINES (style=lined) ---
Plane Geometry, EXT1 2012 HSC 14a
The diagram shows a large semicircle with diameter `AB` and two smaller semicircles with diameters `AC` and `BC`, respectively, where `C` is a point on the diameter `AB`. The point `M` is the centre of the semicircle with diameter `AC`.
The line perpendicular to `AB` through `C` meets the largest semicircle at the point `D`. The points `S` and `T` are the intersections of the lines `AD` and `BD` with the smaller semicircles. The point `X` is the intersection of the lines `CD` and `ST`.

Copy or trace the diagram into your writing booklet.
- Explain why `CTDS` is a rectangle. (1 mark)
- Show that `Delta MXS` and `Delta MXC` are congruent. (2 marks)
- Show that the line `ST` is a tangent to the semicircle with diameter `AC`. (1 mark)
Show Worked Solution
| (i) |
|

`/_SDT = 90°\ text{(angle in semi-circle)}`
♦ Mean mark 49%
`/_ ASC = 90°\ \ text{(angle in semi-circle)}`
`=> /_ CSD = 90°\ \ text{(} /_ ASD\ text{is a straight angle)}`
`text(Similarly)`
`/_CTB = /_CTD=90°`
`/_SCT = 90°\ \ text{(angle sum of quadrilateral}\ CTDS text{)}`
`text(S)text(ince all angles are right angles,)`
`CTDS\ text(is a rectangle)`
(ii) `ST\ text(and)\ DC\ text(are diagonals of rectangle)`
`text(S)text(ince they bisect and are equal)`
`=> XS = XC`
`SM = CM\ text{(radii)}`
`MX\ text(is common)`
`:.\ Delta MXS -= Delta MXC\ text{(SSS)}`
♦ Mean mark part (iii) 41%
STRATEGY: The congruency proof in part (ii) provided the critical information to answer this efficiently. Keep previous parts of questions front and centre of your mind when working on a solution.
STRATEGY: The congruency proof in part (ii) provided the critical information to answer this efficiently. Keep previous parts of questions front and centre of your mind when working on a solution.
(iii) `/_ XSM = /_ XCM = 90°`
`text{(corresponding angles of congruent triangles)}`
`text(S)text(ince)\ MS _|_ ST\ text(at circumference)`
`text(and)\ MS\ text(is a radius,)`
`=> ST\ text(is a tangent)`
Geometry and Calculus, EXT1 2012 HSC 13d
The concentration of a drug in the blood of a patient `t` hours after it was administered is given by
`C(t) = 1.4te^(–0.2t),`
where `C(t)` is measured in `text(mg/L)`.
- Initially the concentration of the drug in the blood of the patient increases until it reaches a maximum, and then it decreases. Find the time when this maximum occurs. (3 marks)
- Taking `t = 20` as a first approximation, use one application of Newton’s method to find approximately when the concentration of the drug in the blood of the patient reaches `0.3\ text(mg/L)`. (2 marks)
Mechanics, EXT2* M1 2012 HSC 13c
A particle is moving in a straight line according to the equation
`x = 5 + 6 cos 2t + 8 sin 2t`,
where `x` is the displacement in metres and `t` is the time in seconds.
- Prove that the particle is moving in simple harmonic motion by showing that `x` satisfies an equation of the form `ddot x = -n^2 (x\ - c)`. (2 marks)
--- 6 WORK AREA LINES (style=lined) ---
- When is the displacement of the particle zero for the first time? (3 marks)
--- 8 WORK AREA LINES (style=lined) ---
Show Worked Solution
i. `text(Prove)\ ddot x = -n^2(x\ – c)`
| `x` | `= 5 + 6 cos 2t + 8 sin 2t` |
| `dot x` | `= -12 sin 2t + 16 cos 2t` |
| `ddot x` | `= – 24 cos 2t\ – 32 sin 2t` |
| `= -4 (6 cos 2t + 8 sin 2t)` | |
| `= -2^2 (5 + 6 cos 2t + 8 sin 2t\ – 5)` | |
| `= -2^2 (x\ – 5)\ \ \ text(… as required)` |
ii. `text(Find)\ \ t\ \ text(when)\ \ x=0\ \ text(for 1st time:)`
♦ Mean mark 42%.
IMPORTANT: The critical insight required to solve `x=0` is to realise that the cosine of the difference between 2 angles, i.e. `cos (2t- theta)`, applies.
IMPORTANT: The critical insight required to solve `x=0` is to realise that the cosine of the difference between 2 angles, i.e. `cos (2t- theta)`, applies.
| `5 + 6 cos 2t + 8 sin 2t` | `= 0` |
| `6 cos 2t + 8 sin 2t` | `= -5` |
| `6/10 cos 2t+ 8/10 sin 2t` | `=-1/2` |

| `=>cos theta=6/10\ \ text(and)\ \ sin theta=8/10` | |
| `cos 2t cos theta+sin 2t sin theta` | `=- 1/2` |
| `cos(2t\ – theta)` | `= – 1/2` |
`text(S)text(ince)\ \ cos\ pi/3 = 1/2\ \ text(and)\ cos\ text(is negative)`
`text(in the 2nd and 3rd quadrants,)`
`=>2t\ – theta = pi\ – pi/3,\ pi + pi/3`
`text(We need the 1st time)\ \ x = 0`
| `text(S)text(ince)\ \ cos theta` | `= 6/10` |
| `theta` | `= 0.9273…` |
| `:.\ 2t\ – 0.9273…` | `= (2pi)/3` |
| `2t` | `= (2pi)/3 + 0.9273…` |
| `t` | `= 1/2 ((2pi)/3 + 0.9273…)` |
| `= 1.5108…` | |
| `= 1.5\ text(seconds)\ text{(1 d.p.)}` |
Quadratic, EXT1 2012 HSC 12d
Let `A(0, –k)` be a fixed point on the `y`-axis with `k > 0`. The point `C(t, 0)` is on the `x`-axis. The point `B(0, y)` is on the `y`-axis so that `Delta ABC` is right-angled with the right angle at `C`. The point `P` is chosen so that `OBPC` is a rectangle as shown in the diagram.

- Show that `P` lies on the parabola given parametrically by (2 marks)
- `x = t\ \ ` and`\ \ y = (t^2)/k`.
- Write down the coordinates of the focus of the parabola in terms of `k`. (1 mark)
Statistics, EXT1 S1 2012 HSC 12c
Kim and Mel play a simple game using a spinner marked with the numbers 1, 2, 3, 4 and 5.

The game consists of each player spinning the spinner once. Each of the five numbers is equally likely to occur.
The player who obtains the higher number wins the game.
If both players obtain the same number, the result is a draw.
- Kim and Mel play one game. What is the probability that Kim wins the game? (1 mark)
--- 5 WORK AREA LINES (style=lined) ---
- Kim and Mel play six games. What is the probability that Kim wins exactly three games? (2 marks)
--- 4 WORK AREA LINES (style=lined) ---
Calculus, 2ADV C3 2009 HSC 10
`text(Let)\ \ f(x) = x - (x^2)/2 + (x^3)/3`
- Show that the graph of `y = f(x)` has no turning points. (2 marks)
--- 4 WORK AREA LINES (style=lined) ---
- Find the point of inflection of `y = f(x)`. (1 mark)
--- 3 WORK AREA LINES (style=lined) ---
- i. Show that `1 - x + x^2 - 1/(1 + x) = (x^3)/(1 + x)` for `x != -1`. (1 mark)
--- 2 WORK AREA LINES (style=lined) ---
ii. Let `g(x) = ln (1 + x)`.
Use the result in part c.i. to show that `f prime (x) >= g prime (x)` for all `x >= 0`. (2 marks)
--- 5 WORK AREA LINES (style=lined) ---
- Sketch the graphs of `y = f(x)` and `y = g(x)` for `x >= 0`. (2 marks)
--- 8 WORK AREA LINES (style=lined) ---
- Show that `d/(dx) [(1 + x) ln (1 + x) - (1 + x)] = ln (1 + x)`. (2 marks)
--- 5 WORK AREA LINES (style=lined) ---
- Find the area enclosed by the graphs of `y = f(x)` and `y = g(x)`, and the straight line `x = 1`. (2 marks)
--- 5 WORK AREA LINES (style=lined) ---
Show Answers Only
- `text{Proof (See Worked Solutions)}`
- `(1/2, 5/12)`
- i. `text{Proof (See Worked Solutions)}`
ii. `text{Proof (See Worked Solutions)}`
-

- `text{Proof (See Worked Solutions)}`
- `1 5/12\ – 2ln2\ \ text(u²)`

Show Worked Solution
| a. | `f(x) = x\ – (x^2)/2 + (x^3)/3` |
♦♦ Mean mark 28% for all of Q10 (note that data for each question part is not available).
`text(Turning points when)\ f prime (x) = 0`
`f prime (x) = 1\ – x + x^2`
`x^2\ – x + 1 = 0`
| `text(S)text(ince)\ \ Delta` | `= b^2\ – 4ac` |
| `= (–1)^2\ – 4 xx 1 xx 1` | |
| `= -3 < 0 => text(No solution)` |
`:.\ f(x)\ text(has no turning points)`
| b. | `text(P.I. when)\ f″(x) = 0` |
| `f″(x)` | `= -1 + 2x = 0` |
| `2x` | `= 1` |
| `x` | `= 1/2` |
`text(Check for change in concavity)`
| `f″(1/4)` | `= -1/2 < 0` |
| `f″(3/4)` | `= 1/2 > 0` |
`=>\ text(Change in concavity)`
`:.\ text(P.I. at)\ \ x = 1/2`
| `f(1/2)` | `= 1/2\ – ((1/2)^2)/2 + ((1/2)^3)/3` |
| `= 1/2\ – 1/8 + 1/24` | |
| `= 5/12` |
`:.\ text(Point of Inflection at)\ (1/2, 5/12)`
| c.i. | `text(Show)\ 1\ – x + x^2\ – 1/(1 + x) = (x^3)/(1 + x),\ \ \ x != -1` | |
| `text(LHS)` | `= (1+x)/(1+x)\ – (x(1+x))/(1+x) + (x^2(1+x))/((1+x))\ – 1/(1+x)` |
| `= (1 + x\ – x\ – x^2 + x^2 + x^3\ – 1)/(1+x)` | |
| `= (x^3)/(1+x)\ \ \ text(… as required)` |
| c.ii. | `text(Let)\ g(x) = ln(1+x)` |
| `g prime (x) = 1/(1 + x)` |
| `f prime (x)\ – g prime (x)` | `= 1\ – x + x^2\ – 1/(1+x)` |
| `= (x^3)/(1 + x)\ \ text{(using part (i))}` |
`text(S)text(ince)\ (x^3)/(1 + x) >= 0\ text(for)\ x >= 0`
| `f prime (x)\ – g prime (x) >= 0` |
| `f prime (x) >= g prime (x)\ text(for)\ x >= 0` |
MARKER’S COMMENT: When 2 graphs are drawn on the same set of axes, you must label them.
| d. |
|
| e. | `text(Show)\ d/(dx) [(1 + x) ln (1 + x)\ – (1 + x)] = ln (1 + x)` |
| `text(Using)\ d/(dx) uv=uv′+vu′` |
| `text(LHS)` | `= (1+x) xx 1/(1 + x) + ln(1+x)xx1 + – 1` |
| `= 1+ ln(1+x)\ – 1` | |
| `= ln(1+x)` | |
| `=\ text(RHS … as required)` |
| f. | `text(Area)` | `= int_0^1 f(x)\ – g(x)\ dx` |
| `= int_0^1 (x\ – (x^2)/2 + (x^3)/3\ – ln(x+1))\ dx` | ||
| `= [x^2/2\ – x^3/6 + (x^4)/12\ – (1 + x) ln (1+x) + (1+x)]_0^1` | ||
| `text{(using part (e) above)}` | ||
| `= [(1/2 – 1/6 + 1/12 – (2)ln2 + 2) – (ln1 + 1)]` | ||
| `= 5/12\ – 2ln2 + 2\ – 1` | ||
| `= 1 5/12\ – 2 ln 2\ \ text(u²)` |
Calculus, 2ADV C3 2009 HSC 8a

The diagram shows the graph of a function `y = f(x)`.
- For which values of `x` is the derivative, `f^{′}(x)`, negative? (1 mark)
--- 1 WORK AREA LINES (style=lined) ---
- What happens to `f^{′}(x)` for large values of `x`? (1 mark)
--- 2 WORK AREA LINES (style=lined) ---
- Sketch the graph `y = f^{′}(x)`. (2 marks)
--- 7 WORK AREA LINES (style=lined) ---
Show Worked Solution
i. `f^{′}(x) < 0\ text(when)`
`-1 < x < 3`
♦♦ Exact data not available.
ii. `text(As)\ x -> oo,`
`f^{′}(x) -> 0`
♦♦ Exact data not available.
MARKER’S COMMENT: Poorly drawn graphs with axes not labelled and inaccurate scales were common.
MARKER’S COMMENT: Poorly drawn graphs with axes not labelled and inaccurate scales were common.
iii.

Trigonometry, 2ADV T3 2009 HSC 7b
Between 5 am and 5 pm on 3 March 2009, the height, `h`, of the tide in a harbour was given by
`h = 1 + 0.7 sin(pi/6 t)\ \ \ text(for)\ \ 0 <= t <= 12`
where `h` is in metres and `t` is in hours, with `t = 0` at 5 am.
- What is the period of the function `h`? (1 mark)
--- 2 WORK AREA LINES (style=lined) ---
- What was the value of `h` at low tide, and at what time did low tide occur? (2 marks)
--- 4 WORK AREA LINES (style=lined) ---
- A ship is able to enter the harbour only if the height of the tide is at least 1.35 m.
Find all times between 5 am and 5 pm on 3 March 2009 during which the ship was able to enter the harbour. (3 marks)
--- 6 WORK AREA LINES (style=lined) ---
Show Worked Solution
i. `h = 1 + 0.7 sin (pi/6 t)\ \ text(for)\ 0 <= t <= 12`
| `T` | `= (2pi)/n\ \ text(where)\ n = pi/6` |
| `= 2 pi xx 6/pi` | |
| `= 12\ text(hours)` |
`:.\ text(The period of)\ h\ text(is 12 hours.)`
ii. `text(Find)\ h\ text(at low tide)`
IMPORTANT: Using `sin x=–1` for a minimum here is very effective and time efficient. This property of trig functions is often very useful in harder questions.
`=> h\ text(will be a minimum when)`
`sin(pi/6 t) = -1`
| `:.\ h_text(min)` | `= 1 + 0.7(-1)` |
| `= 0.3\ text(metres)` |
`text(S)text(ince)\ \ sinx = -1\ \ text(when)\ \ x = (3pi)/2`
| `pi/6 t` | `= (3pi)/2` |
| `t` | `= (3pi)/2 xx 6/pi` |
| `= 9\ text(hours)` |
`:.\ text{Low tide occurs at 2pm (5 am + 9 hours)}`
iii. `text(Find)\ \ t\ \ text(when)\ \ h >= 1.35`
| `1 + 0.7 sin (pi/6 t)` | `>= 1.35` |
| `0.7 sin (pi/6 t)` | `>= 0.35` |
| `sin (pi/6 t)` | `>= 1/2` |
| `sin (pi/6 t)` | `= 1/2\ text(when)` |
| `pi/6 t` | `= pi/6,\ (5pi)/6,\ (13pi)/6,\ text(etc …)` |
| `t` | `= 1,\ 5\ \ \ \ \ \ (0 <= t <= 12)` |

`text(From the graph,)`
`sin(pi/6 t) >= 1/2\ \ \ text(when)\ \ 1 <= t <= 5`
`:.\ text(Ship can enter the harbour between 6 am and 10 am.)`
Calculus, 2ADV C1 2009 HSC 6c
The diagram illustrates the design for part of a roller-coaster track. The section `RO` is a straight line with slope 1.2, and the section `PQ` is a straight line with slope – 1.8. The section `OP` is a parabola `y = ax^2 + bx`. The horizontal distance from the `y`-axis to `P` is 30 m.

In order that the ride is smooth, the straight line sections must be tangent to the parabola at `O` and at `P`.
- Find the values of `a` and `b` so that the ride is smooth. (3 marks)
--- 6 WORK AREA LINES (style=lined) ---
- Find the distance `d`, from the vertex of the parabola to the horizontal line through `P`, as shown on the diagram. (2 marks)
--- 5 WORK AREA LINES (style=lined) ---
Trigonometry, 2ADV T1 2009 HSC 5c
The diagram shows a circle with centre `O` and radius 2 centimetres. The points `A` and `B` lie on the circumference of the circle and `/_AOB = theta`.

- There are two possible values of `theta` for which the area of `Delta AOB` is `sqrt 3` square centimetres. One value is `pi/3`.
Find the other value. (2 marks)
--- 4 WORK AREA LINES (style=lined) ---
- Suppose that `theta = pi/3`.
(1) Find the area of sector `AOB` (1 mark)
--- 3 WORK AREA LINES (style=lined) ---
(2) Find the exact length of the perimeter of the minor segment bounded by the chord `AB` and the arc `AB`. (2 marks)
--- 4 WORK AREA LINES (style=lined) ---
Probability, 2ADV S1 2009 HSC 5b
On each working day James parks his car in a parking station which has three levels. He parks his car on a randomly chosen level. He always forgets where he has parked, so when he leaves work he chooses a level at random and searches for his car. If his car is not on that level, he chooses a different level and continues in this way until he finds his car.
- What is the probability that his car is on the first level he searches? (1 mark)
--- 1 WORK AREA LINES (style=lined) ---
- What is the probability that he must search all three levels before he finds his car? (1 mark)
--- 2 WORK AREA LINES (style=lined) ---
- What is the probability that on every one of the five working days in a week, his car is not on the first level he searches? (1 mark)
--- 2 WORK AREA LINES (style=lined) ---
Plane Geometry, 2UA 2009 HSC 4c
In the diagram, `Delta ABC` is a right-angled triangle, with the right angle at `C`. The midpoint of `AB` is `M`, and `MP _|_ AC`.

Copy or trace the diagram into your writing booklet.
- Prove that `Delta AMP` is similar to `Delta ABC`. (2 marks)
- What is the ratio of `AP` to `AC`? (1 mark)
- Prove that `Delta AMC` is isosceles. (2 marks)
- Show that `Delta ABC` can be divided into two isosceles triangles. (1 mark)
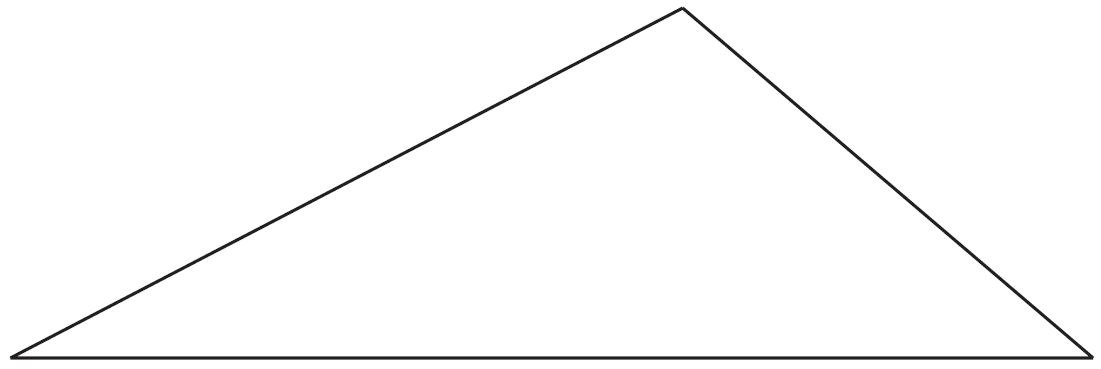
- Copy or trace this triangle into your writing booklet and show how to divide it into four isosceles triangles. (1 mark)

Show Answers Only
- `text(Proof)\ \ text{(See Worked Solutions)}`
- `text(Ratio)\ AP:AC = 1:2`
- `text(Proof)\ \ text{(See Worked Solutions)}`
- `text(Proof)\ \ text{(See Worked Solutions)}`


Show Worked Solution
| (i) | `text(Need to prove)\ Delta AMP\ text(|||)\ Delta ABC` |
| `/_ PAM\ text(is common)` | |
| `/_ MPA = /_BCA = 90°\ \ \ text{(given)}` | |
| `:.\ Delta AMP \ text(|||) \ Delta ABC\ \ \ text{(equiangular)}` |
| (ii) | `(AP)/(AC) = (AM)/(AB)\ \ \ ` | `text{(corresponding sides of}` |
| `text{similar triangles)}` |
| `text(S)text(ince)\ \ AB = 2 xx AM` |
| `(AP)/(AC) = 1/2` |
| `:.\ text(Ratio)\ AP:AC = 1:2` |
| (iii) |
|

| `AP = PC \ \ \ text{(from part (ii))}` |
| `PM\ text(is common)` |
| `/_APM = /_CPM = 90°\ \ text{(∠}\ APC\ text{is a straight angle)}` |
| `:.\ Delta AMP ~= Delta CMP\ text{(SAS)}` |
| `=> AM = CM\ \ ` | `text{(corresponding sides of}` |
| `text{congruent triangles)}` |
`:.\ Delta AMC\ text(is isosceles.)`
| (iv) | `text(S)text(ince)\ \ AM` | `= MC\ \ \ text{(part (iii))}` |
| `AM` | `= MB\ text{(given)}` | |
| `:. MC` | `= MB` |
| `:. Delta MCB\ text(is isosceles)` |
| `:. Delta ABC\ text(can be divided into 2 isosceles)` |
| `text(triangles)\ (Delta AMC\ text(and)\ Delta MCB text{)}` |
| (v) |
|
♦♦ Mean mark 25%.
MARKER’S COMMENT: Use a ruler, draw large diagrams and always pay careful attention to previous parts of the question!
MARKER’S COMMENT: Use a ruler, draw large diagrams and always pay careful attention to previous parts of the question!
| `/_AFB = /_CFB = 90°` |
| `DF\ text(bisects)\ AB` |
| `EF\ text(bisects)\ BC` |
| `text(From part)\ text{(iv)}\ text(we get 4 isosceles)` |
| `text(triangles as shown.)` |
Plane Geometry, 2UA 2010 HSC 10a
In the diagram `ABC` is an isosceles triangle with `AC = BC = x`. The point `D` on the interval `AB` is chosen so that `AD = CD`. Let `AD = a`, `DB = y` and `/_ADC = theta`.

- Show that `Delta ABC` is similar to `Delta ACD`. (2 marks)
- Show that `x^2 = a^2 + ay`. (1 mark)
- Show that `y = a(1 − 2 cos theta )`. (2 marks)
- Deduce that `y <= 3a`. (1 mark)
Show Worked Solution
MARKER’S COMMENT: When dealing with multiple triangles, the best performing students label all angles clearly and unambiguously.
| (i) |  |
`/_CAD\ text(is common)`
`/_CAD = /_ACD = /_DBC`
`text{(Angles opposite equal sides in}`
`\ \ text{isosceles}\ Delta ACD\ text(and)\ Delta ABC text{)}`
`/_ADC = /_ACB\ \ (180^@\ text(in)\ Delta text{)}`
`:.\ Delta ABC\ text(|||) \ Delta ACD\ \ \ text{(AAA)}\ \ \ text(… as required)`
♦♦ Mean mark 25%.
MARKER’S COMMENT: The similarity proof in part (i) should have immediately alerted students to using similar ratios of sides to solve part (ii). Many did not follow this obvious hint.
MARKER’S COMMENT: The similarity proof in part (i) should have immediately alerted students to using similar ratios of sides to solve part (ii). Many did not follow this obvious hint.
(ii) `text(Using similarity)`
| `(AC)/(AD)` | `= (AB)/(CB)` | `\ \ text{(corresponding sides of}` `\ \ \ \ text{similar triangles)}` |
| `x/a` | `= (a + y)/x` |
`:.\ x^2 = a^2 + ay\ \ \ text(… as required)`
(iii) `text(Show)\ \ y = a(1\ – 2 cos theta)`
`text(Using Cosine Rule:)`
| `cos theta` | `= (a^2 + a^2\ – x^2)/(2 xx a xx a)` |
| `2a^2costheta` | `= 2a^2\ – x^2` |
| `= 2a^2\ – (a^2 + ay)\ \ text{(from part (ii))}` | |
| `= a^2\ – ay` | |
| `ay` | `= a^2\ – 2a^2cos theta` |
| `y` | `= a\ – 2a cos theta` |
| `= a (1\ – 2 cos theta)\ \ \ \ text(… as required)` |
(iv) `text(S)text(ince)\ 1 <= cos theta <= 1`
♦♦♦ Parts (iii) and (iv) mean marks – 18% and just 4% respectively.
IMPORTANT: Limits of trig functions are often extremely useful in proving inequalities (see Worked Solutions).
IMPORTANT: Limits of trig functions are often extremely useful in proving inequalities (see Worked Solutions).
` -2 <= 2 cos theta <= 2`
` -1 <= 1\ – 2 cos theta <= 3`
| `y` | `=a(1\ – 2 cos theta)\ \ \ text{(from part (iii))}` |
| `:.\ y` | `<= a(3)` |
| `<= 3a\ \ …\ text(as required)` |
Calculus, 2ADV C3 2010 HSC 9b
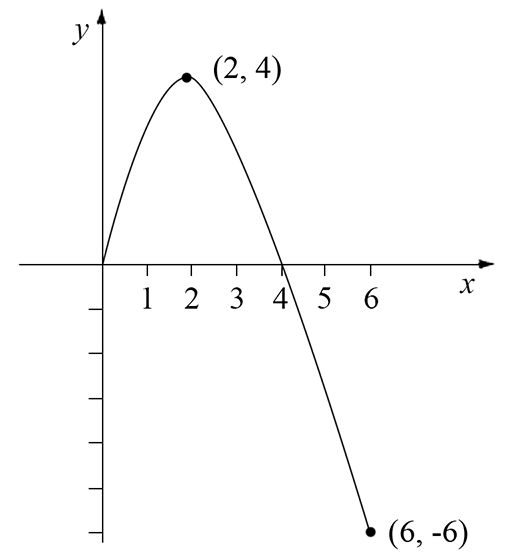
Let `y=f(x)` be a function defined for `0 <= x <= 6`, with `f(0)=0`.
The diagram shows the graph of the derivative of `f`, `y = f^{′}(x)`.

The shaded region `A_1` has area 4 square units. The shaded region `A_2` has area 4 square units.
- For which values of `x` is `f(x)` increasing? (1 mark)
--- 2 WORK AREA LINES (style=lined) ---
- What is the maximum value of `f(x)`? (1 mark)
--- 3 WORK AREA LINES (style=lined) ---
- Find the value of `f(6)`. (1 mark)
--- 3 WORK AREA LINES (style=lined) ---
- Draw a graph of `y =f(x)` for `0 <= x <= 6`. (2 marks)
--- 8 WORK AREA LINES (style=lined) ---
Show Answers Only
- `f(x)\ text(is increasing when)\ 0 <= x < 2`
- `text(MAX value of)\ f(x) = 4`
- `-6`
-
Show Worked Solution
| i. | `f(x)\ text(is increasing when)\ \ f^{′}(x) > 0` |
| `text(From the graph)` | |
| `f(x)\ text(is increasing when)\ 0 <= x < 2` |
| ii. | `f^{′}(x) = 0\ \ text(when)\ \ x=2` |
| `:.\ text(MAX at)\ \ x = 2` | |
| `int_0^2 f^{′}(x)\ dx = 4\ \ \ (text(given since)\ A_1 = 4 text{)}` | |
| `text(We also know)` |
| `int_0^2\ f^{′}(x)\ dx` | `= [f(x)]_0^2` |
| `= f(2)-f(0)` | |
| `= f(2)\ \ \ \ text{(since}\ f(0) = 0 text{)}` |
`=> f(2) = 4`
♦♦♦ Parts (ii) and (iii) proved particularly difficult for students with mean marks of 12% and 11% respectively.
`:.\ text(MAX value of)\ \ f(x) = 4`
| iii. | `int_0^4 f^{′}(x)` | `= A_1-A_2` |
| `=0` |
`text(We also know)`
| `int_0^4 f^{′}(x)\ dx` | `= int_2^4 f^{′}(x)\ dx + int_0^2 f^{′}(x)\ dx` |
| `=[f(x)]_2^4 + 4` | |
| `= f(4)-f(2) + 4\ \ \ (text(note)\ f(2)=4)` | |
| `=f(4)` |
`=> f(4) = 0`
`text(Gradient = – 3 from)\ \ x = 4\ \ text(to)\ \ x = 6`
| `:.\ f(6)` | `= -3 (6\ – 4)` |
| `= -6` |
♦♦ Mean mark 28%
EXAM TIP: Clearly identify THE EXTREMES when given a defined domain. In this case, the origin is obvious graphically, and the other extreme at `x=6`, is CLEARLY LABELLED!
EXAM TIP: Clearly identify THE EXTREMES when given a defined domain. In this case, the origin is obvious graphically, and the other extreme at `x=6`, is CLEARLY LABELLED!
| iv. |  |
Calculus, 2ADV C3 2010 HSC 8d
Let `f(x) = x^3-3x^2 + kx + 8`, where `k` is a constant.
Find the values of `k` for which `f(x)` is an increasing function. (2 marks)
--- 5 WORK AREA LINES (style=lined) ---
Probability, 2ADV S1 2010 HSC 8b
Two identical biased coins are tossed together, and the outcome is recorded.
After a large number of trials it is observed that the probability that both coins land showing heads is 0.36.
What is the probability that both coins land showing tails? (2 marks)
--- 5 WORK AREA LINES (style=lined) ---
Calculus, 2ADV C1 2010 HSC 7b
The parabola shown in the diagram is the graph `y = x^2`. The points `A (–1,1)` and `B (2, 4)` are on the parabola.

- Find the equation of the tangent to the parabola at `A`. (2 marks)
--- 4 WORK AREA LINES (style=lined) ---
- Let `M` be the midpoint of `AB`.
There is a point `C` on the parabola such that the tangent at `C` is parallel to `AB`.
Show that the line `MC` is vertical. (2 marks)
--- 4 WORK AREA LINES (style=lined) ---
- The tangent at `A` meets the line `MC` at `T`.
Show that the line `BT` is a tangent to the parabola. (2 marks)
--- 4 WORK AREA LINES (style=lined) ---
Show Worked Solution
| i. |  |
| `y` | `=x^2` |
| `dy/dx` | `= 2x` |
`text(At)\ \ A text{(–1,1)}\ => dy/dx = -2`
`text(T)text(angent has)\ \ m=text(–2),\ text(through)\ text{(–1,1):}`
| `y – y_1` | `= m(x\ – x_1)` |
| `y – 1` | `= -2 (x + 1)` |
| `y – 1` | `= -2x -2` |
| `2x + y + 1` | `= 0` |
`:.\ text(T)text(angent at)\ A\ text(is)\ \ 2x + y + 1 = 0`
♦ Mean mark 37%.
IMPORTANT: The critical understanding required for this question is that the gradient of `AB` needs to be equated to the gradient function (i.e. `dy/dx`).
IMPORTANT: The critical understanding required for this question is that the gradient of `AB` needs to be equated to the gradient function (i.e. `dy/dx`).
ii. `Atext{(–1,1)}\ \ \ B(2,4)`
| `M` | `= ((-1+2)/2 , (1+4)/2)` |
| `= (1/2, 5/2)` |
| `m_(AB)` | `= (y_2 – y_1)/(x_2 – x_1)` |
| `= (4 – 1)/(2 + 1)=1` |
| `text(When)\ \ dy/dx` | `= 1` |
| `2x` | `= 1` |
| `x` | `= 1/2` |
`:.\ C \ (1/2, 1/4)`
`=>M\ text(and)\ C\ text(both have)\ x text(-value)=1/2`
`:. MC\ text(is vertical … as required)`
iii. `T\ text(is point on tangent when) \ x=1/2`
♦♦ Mean mark 29%.
`text(T)text(angent)\ \ \ 2x + y + 1 = 0`
`text(At)\ x = 1/2`
`2 xx (1/2) + y + 1=0`
`=> y=–2`
`:.\ T (1/2, –2)`
`text (Given)\ \ B (2, 4)`
| `m_(BT)` | `= (4+2)/(2\ – 1/2)` |
| `=4` |
`text(At)\ \ B(2,4),\ text(find gradient of tangent:)`
`dy/dx = 2x=2 xx2=4`
`:.m_text(tangent) = 4=m_(BT)`
`:.BT\ text(is a tangent)`
Trigonometry, 2ADV T1 2010 HSC 6b
The diagram shows a circle with centre `O` and radius 5 cm.
The length of the arc `PQ` is 9 cm. Lines drawn perpendicular to `OP` and `OQ` at `P` and `Q` respectively meet at `T`.

- Find `/_POQ` in radians. (1 mark)
--- 2 WORK AREA LINES (style=lined) ---
- Prove that `Delta OPT` is congruent to `Delta OQT`. (2 marks)
--- 2 WORK AREA LINES (style=lined) ---
- Find the area of the shaded region. (2 marks)
--- 5 WORK AREA LINES (style=lined) ---
Show Worked Solution
| i. | `text(Length of Arc)` | `= r theta` |
| `9` | `= 5 xx /_POQ` | |
| `:.\ /_ POQ` | `= 9/5\ text(radians)` |
| ii. |  |
`text(Prove)\ Delta OPT ~= Delta OQT`
`OT\ text(is common)`
MARKER’S COMMENT: Know the difference between the congruency proof of `RHS` and `SAS`. Incorrect identification will lose a mark.
`/_OPT = /_OQT = 90°\ \ \ text{(given)}`
`OP = OQ\ \ \ text{(radii)}`
`:.\ Delta OPT ~= Delta OQT\ \ \ text{(RHS)}`
| iii. |  |
| `/_POT ` | `= 1/2 xx /_POQ\ \ \ text{(from part (ii))}` |
| `=1/2 xx 9/5` | |
| `= 9/10\ text(radians)` |
♦♦ Mean mark below 30%.
MARKER’S COMMENT: Many students struggled to work in radians. Make sure you understand this concept.
MARKER’S COMMENT: Many students struggled to work in radians. Make sure you understand this concept.
| `tan /_ POT` | `= (PT)/(OP)` |
| `tan (9/10)` | `= (PT)/5` |
| `PT` | `= 5 xx tan(9/10)` |
| `=6.3007…` | |
| `=6.3\ text(cm)\ \ text{(to 1 d.p.)}` |
| iv. | `text(Shaded Area = Area)\ OQTP\ – text(Area Sector)\ OQP` |
♦ Mean mark 35%.
| `text(Area)\ OQTP` | `= 2 xx text(Area)\ Delta OPT` |
| `=2 xx 1/2 xx OP xx PT` | |
| `= 5 xx 6.3007` | |
| `~~ 31.503…` | |
| `~~31.5\ text(cm²)` |
| `text(Area Sector)\ OQP` | ` = 1/2 r^2 theta` |
| `= 1/2 xx 25 xx 9/5` | |
| `= 22.5\ text(cm²)` |
| `:.\ text(Shaded Area)` | `= 31.503\ – 22.5` |
| `=9.003…` | |
| `=9.0\ text(cm²)\ \ \ text{(to 1 d.p.)}` |
Calculus, 2ADV C3 2010 HSC 6a
Let `f(x) = (x + 2)(x^2 + 4)`.
- Show that the graph `y=f(x)` has no stationary points. (2 marks)
--- 5 WORK AREA LINES (style=lined) ---
- Find the values of `x` for which the graph `y=f(x)` is concave down, and the values for which it is concave up. (2 marks)
--- 5 WORK AREA LINES (style=lined) ---
- Sketch the graph `y=f(x)`, indicating the values of the `x` and `y` intercepts. (2 marks)
--- 8 WORK AREA LINES (style=lined) ---
Show Answers Only
- `text(Proof) text{(See Worked Solutions)}`
- `f(x)\ text(is concave down when)\ x < -2/3`
`f(x)\ text(is concave up when)\ x > -2/3`
-
Show Worked Solution
i. `text(Need to show no S.P.’s)`
| `f(x)` | `= (x+2)(x^2 + 4)` |
| `=x^3 + 2x^2 + 4x + 8` | |
| `f prime (x)` | `= 3x^2 + 4x + 4` |
`text(S.P.s occur when)\ \ f prime (x) =0,`
`3x^2 + 4x + 4 =0`
| `Delta` | `= b^2\ – 4ac` |
| `=4^2\ – (4 xx 3 xx 4)` | |
| `=16\ – 48` | |
| `= -32 < 0` |
`text(S)text(ince)\ \ Delta < 0,\ \ text(No Solution)`
`:.\ text(No S.P.’s for)\ \ f(x)`
ii. `f(x)\ text(is concave down when)\ f″(x) < 0`
MARKER’S COMMENT: The significance of the sign of the second derivative was not well understood by most students.
`f″(x) = 6x + 4`
| `=> 6x + 4` | `< 0` |
| `6x` | `< -4` |
| `x` | `< -2/3` |
`:.\ f(x)\ text(is concave down when)\ x < -2/3`
`f(x)\ text(is concave up when)\ f″(x) > 0`
`f″(x) = 6x + 4`
| `=> 6x + 4` | `> 0` |
| `6x` | `> -4` |
| `x` | `> -2/3` |
`:. f(x)\ text(is concave up when)\ x > -2/3`
♦♦ Mean mark 33%.
MARKER’S COMMENT: Students are reminded to bring a ruler to the exam and use it to draw the axes for graphing and to help with an appropriate scale.
MARKER’S COMMENT: Students are reminded to bring a ruler to the exam and use it to draw the axes for graphing and to help with an appropriate scale.
iii. `y text(-intercept) =2 xx4=8`
`x text(-intercept)=–2`

Calculus, 2ADV C4 2010 HSC 5b
- Prove that `sec^2 x + secx tanx = (1 + sinx)/(cos^2x)`. (1 mark)
--- 4 WORK AREA LINES (style=lined) ---
- Hence prove that `sec^2 x + secx tanx = 1/(1 - sinx)`. (1 mark)
--- 4 WORK AREA LINES (style=lined) ---
- Hence, use the identity `int sec ax tan ax\ dx=1/a sec ax` to find the exact value of
`int_0^(pi/4) 1/(1 - sinx)\ dx`. (2 marks)
--- 4 WORK AREA LINES (style=lined) ---
Calculus, 2ADV C3 2011 HSC 9c
The graph `y = f(x)` in the diagram has a stationary point when `x = 1`, a point of inflection when `x = 3`, and a horizontal asymptote `y = –2`.

Sketch the graph `y = f^{′}(x)` , clearly indicating its features at `x = 1` and at `x = 3`, and the shape of the graph as `x -> oo`. (3 marks)
Show Answers Only

Show Worked Solution
♦ Mean mark 43%
IMPORTANT: Examiners regularly ask questions that require the graphing of an `f ^{′}(x)` given the `f(x)` graph and vice-versa. KNOW IT!
IMPORTANT: Examiners regularly ask questions that require the graphing of an `f ^{′}(x)` given the `f(x)` graph and vice-versa. KNOW IT!
Plane Geometry, 2UA 2012 HSC 16a
The diagram shows a triangle `ABC` with sides `BC = a` and `AC = b`. The points `D`, `E` and `F` lie on the sides `AC`, `AB` and `BC`, respectively, so that `CDEF` is a rhombus with sides of length `x`.

- Prove that `Delta EBF` is similar to `Delta AED`. (2 marks)
- Find an expression for `x` in terms of `a` and `b`. (2 marks)
Show Worked Solution
| (i) |  |
`text(S)text(ince)\ CDEF\ text(is a rhombus)`
♦ Mean mark 47%.
`=> BC\ |\| \ ED\ \ text(and)\ \ EF \ |\|\ CD`
| `/_ FCD` | `=/_ EDA\ text{(corresponding angles,}\ BC\ text(||)\ ED text{)}` |
| `/_FCD` | `=/_BFE\ text{(corresponding angles,}\ EF\ text(||)\ CD text{)}` |
| `=>/_EDA` | `=/_BFE` |
| `/_FBE` | `=/_DEA\ text{(corresponding angles,}\ BC\ text(||)\ ED text{)}` |
`:.\ Delta EBF\ text(|||)\ Delta AED\ \ text{(equiangular) … as required}`
(ii) `text(In)\ Delta AED,\ DA = b\ – x\ \ \ text(and)\ \ \ ED = x`
♦ Mean mark 31%.
`text(In)\ Delta EBF,\ FE = x\ \ text(and)\ \ FB = a\ – x`
`text(Using similarity)`
`(DA)/(ED) = (EF)/(FB)`
| `(b\ – x)/x` | `= x/(a\ – x)` |
| `x^2` | `= (b\ – x)(a\ – x)` |
| `x^2` | `= ab\ – bx\ – ax + x^2` |
| `0` | `= ab\ – x (a + b)` |
| `x (a + b)` | `= ab` |
| `x` | `= (ab)/(a+b)` |
Calculus, 2ADV C3 2012 HSC 14a
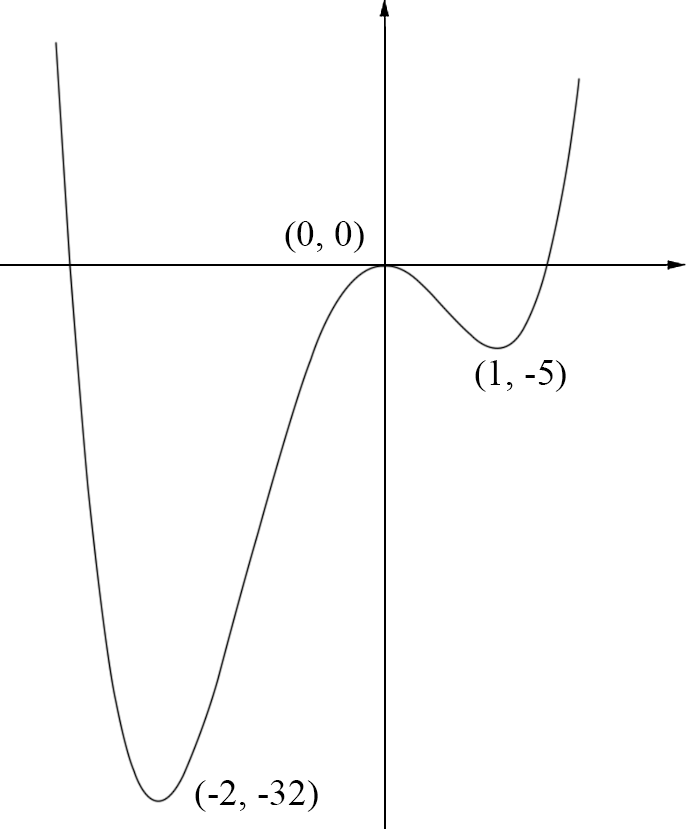
A function is given by `f(x) = 3x^4 + 4x^3-12x^2`.
- Find the coordinates of the stationary points of `f(x)` and determine their nature. (3 marks)
--- 6 WORK AREA LINES (style=lined) ---
- Hence, sketch the graph `y = f(x)` showing the stationary points. (2 marks)
--- 8 WORK AREA LINES (style=lined) ---
- For what values of `x` is the function increasing? (1 mark)
--- 2 WORK AREA LINES (style=lined) ---
- For what values of `k` will `f(x) = 3x^4 + 4x^3-12x^2 + k = 0` have no solution? (1 mark)
--- 2 WORK AREA LINES (style=lined) ---
Show Answers Only
- `text{MAX at (0,0), MINs at (1, –5) and (–2, –32)}`
-
- `f(x)\ text(is increasing for)\ -2 < x < 0\ text(and)\ x > 1`
- `text(No solution when)\ k > 32`
Show Worked Solution
| i. | `f(x)` | `= 3x^4 + 4x^3-12x^2` |
| `f^{′}(x)` | `= 12x^3 + 12x^2-24x` | |
| `f^{″}(x)` | `= 36x^2 + 24x-24` |
`text(Stationary points when)\ f^{′}(x) = 0`
| `12x^3 + 12x^2-24x` | `=0` |
| `12x(x^2 + x-2)` | `=0` |
| `12x (x+2) (x-1)` | `=0` |
`:.\ text(Stationary points at)\ x=0,\ 1\ text(or)\ -2`
| `text(When)\ x=0,\ \ \ \ f(0)=0` | |
| `f^{″}(0)` | `= -24 < 0` |
| `:.\ text{MAX at (0,0)}` | |
`text(When)\ x=1`
| `f(1)` | `= 3+4-12 = -5` |
| `f^{″}(1)` | `= 36 + 24-24 = 36 > 0` |
| `:.\ text{MIN at}\ (1,-5)` | |
`text(When)\ x=–2`
| `f(-2)` | `=3(-2)^4 + 4(-2)^3-12(-2)^2` |
| `= 48-32-48` | |
| `= -32` | |
| `f^{″}(-2)` | `= 36(-2)^2 + 24(-2)-24` |
| `=144-48-24 = 72 > 0` | |
| `:.\ text{MIN at (–2, –32)}` | |
| ii. |  |
♦ Mean mark 42%
MARKER’S COMMENT: Be careful to use the correct inequality signs, and not carelessly include ≥ or ≤ by mistake.
MARKER’S COMMENT: Be careful to use the correct inequality signs, and not carelessly include ≥ or ≤ by mistake.
| iii. | `f(x)\ text(is increasing for)` |
| `-2 < x < 0\ text(and)\ x > 1` |
iv. `text(Find)\ k\ text(such that)`
♦♦♦ Mean mark 12%.
`3x^4 + 4x^3-12x^2 + k = 0\ text(has no solution)`
`k\ text(is the vertical shift of)\ \ y = 3x^4 + 4x^3-12x^2`
`=>\ text(No solution if it does not cross the)\ x text(-axis.)`
`:.\ text(No solution when)\ k > 32`
Calculus, 2ADV C4 2011 HSC 6c
The diagram shows the graph `y = 2 cos x` .

- State the coordinates of `P`. (1 mark)
--- 1 WORK AREA LINES (style=lined) ---
- Evaluate the integral `int_0^(pi/2) 2 cos x\ dx`. (2 marks)
--- 4 WORK AREA LINES (style=lined) ---
- Indicate which area in the diagram, `A`, `B`, `C` or `D`, is represented by the integral
`int_((3pi)/2)^(2pi) 2 cos x\ dx`. (1 mark)
--- 1 WORK AREA LINES (style=lined) ---
- Using parts (ii) and (iii), or otherwise, find the area of the region bounded by the curve `y = 2 cos x` and the `x`-axis, between `x = 0` and `x = 2pi` . (1 mark)
--- 2 WORK AREA LINES (style=lined) ---
- Using the parts above, write down the value of
`int_(pi/2)^(2pi) 2 cos x\ dx`. (1 mark)
--- 2 WORK AREA LINES (style=lined) ---
Real Functions, 2UA 2011 HSC 6b
A point `P(x, y)` moves so that the sum of the squares of its distance from each of the points `A(–1, 0)` and `B(3, 0)` is equal to 40.
Show that the locus of `P(x, y)` is a circle, and state its radius and centre. (3 marks)
Statistics, 2ADV 2011 HSC 5b
Kim has three red shirts and two yellow shirts. On each of the three days, Monday, Tuesday and Wednesday, she selects one shirt at random to wear. Kim wears each shirt that she selects only once.
- What is the probability that Kim wears a red shirt on Monday? (1 mark)
- What is the probability that Kim wears a shirt of the same colour on all three days? (1 mark)
- What is the probability that Kim does not wear a shirt of the same colour on consecutive days? (2 marks)
Functions, EXT1* F1 2011 HSC 4e
The diagram shows the graphs `y = |\ x\ |\ - 2` and `y = 4- x^2`.

Write down inequalities that together describe the shaded region. (2 marks)
Calculus, 2ADV C4 2011 HSC 4d
- Differentiate `y=sqrt(9 - x^2)` with respect to `x`. (2 marks)
--- 4 WORK AREA LINES (style=lined) ---
- Hence, or otherwise, find `int (6x)/sqrt(9 - x^2)\ dx`. (2 marks)
--- 4 WORK AREA LINES (style=lined) ---
Calculus, 2ADV C4 2011 HSC 2e
Find `int 1/(3x^2)\ dx`. (2 marks)
Functions, EXT1* F1 2012 HSC 8 MC
The diagram shows the region enclosed by `y = x- 2` and `y^2 = 4-x`.

Which of the following pairs of inequalities describes the shaded region in the diagram?
- `y^2 <= 4-x\ \ and\ \ y <= x-2`
- `y^2 <= 4-x\ \ and\ \ y >= x-2`
- `y^2 >= 4-x\ \ and\ \ y<= x-2`
- `y^2 >= 4-x\ \ and\ \ y >= x-2`
Functions, 2ADV F2 2013 HSC 15c
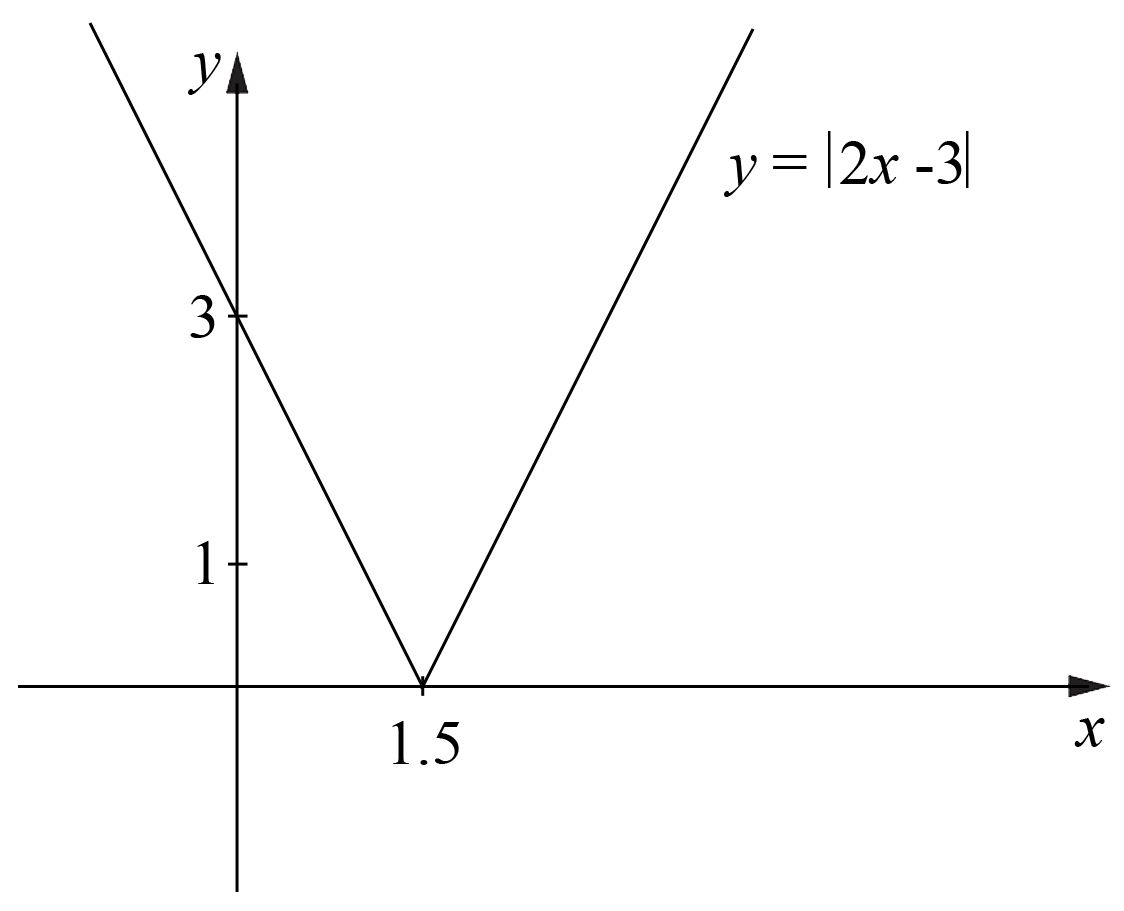
- Sketch the graph `y = |\ 2x-3\ |`. (1 mark)
--- 6 WORK AREA LINES (style=lined) ---
- Using the graph from part (i), or otherwise, find all values of `m` for which the equation `|\ 2x-3\ | = mx + 1` has exactly one solution. (2 marks)
--- 4 WORK AREA LINES (style=lined) ---
Show Answers Only
-
- `text(When)\ m = -2/3,\ m >= 2\ text(or)\ m<-2`
Show Worked Solution
i.
♦ Mean mark 49%
MARKER’S COMMENT: Many students drew diagrams that were “too small”, didn’t use rulers or didn’t use a consistent scale on the axes!
MARKER’S COMMENT: Many students drew diagrams that were “too small”, didn’t use rulers or didn’t use a consistent scale on the axes!

| ii. |
|

`text(Line of intersection)\ \ y=mx + 1\ \ text(passes through)\ \ (0,1)`
♦♦ Mean mark 25%.
COMMENT: Students need a clear graphical understanding of what they are finding to solve this very challenging, Band 6 question.
COMMENT: Students need a clear graphical understanding of what they are finding to solve this very challenging, Band 6 question.
`text(If it also passes through)\ \ (1.5, 0) => text(1 solution)`
| `m` | `=(y_2-y_1)/(x_2-x_1)` |
| `= (1 -0)/(0- 3/2)` | |
| `=-2/3` |
`text(Gradients of)\ \ y=|\ 2x-3\ |\ \ text(are)\ \ 2\ text(or)\ -2`
`text(Considering a line through)\ \ (0,1):`
`text(If)\ \ m >= 2\ text(, only intersects once.)`
`text(Similarly,)`
`text(If)\ \ m<-2 text(, only intersects once.)`
`:.\ text(Only one solution when)\ \ m = -2/3,\ \ m >= 2\ \ text(or)\ \ m<-2`
Calculus, EXT1* C3 2013 HSC 15b
The region bounded by the `x`-axis, the `y`-axis and the parabola `y = (x-2)^2` is rotated about the `y`-axis to form a solid.

Find the volume of the solid. (4 marks)
--- 8 WORK AREA LINES (style=lined) ---
Trigonometry, 2ADV T1 2013 HSC 14c

The right-angled triangle `ABC` has hypotenuse `AB = 13`. The point `D` is on `AC` such that `DC = 4`, `/_DBC = pi/6` and `/_ABD = x`.
Using the sine rule, or otherwise, find the exact value of `sin x`. (3 marks)
--- 6 WORK AREA LINES (style=lined) ---
Trigonometry, 2ADV T3 2013 HSC 13a
The population of a herd of wild horses is given by
`P(t) = 400 + 50 cos (pi/6 t)`
where `t` is time in months.
- Find all times during the first 12 months when the population equals 375 horses. (2 marks)
--- 5 WORK AREA LINES (style=lined) ---
- Sketch the graph of `P(t)` for `0 <= t <= 12`. (2 marks)
--- 8 WORK AREA LINES (style=lined) ---
Show Worked Solution
i. `P(t) = 400 + 50 cos (pi/6 t)`
`text(Need to find)\ t\ text(when)\ P(t) = 375`
| `375` | `= 400 + 50 cos (pi/6 t)` |
| `50 cos (pi/6 t)` | `=-25` |
| `cos (pi/6 t)` | `= – 1/2` |
| `text(S)text(ince)\ \ cos(pi/3)=1/2, text(and cos is)` | |
| `text(negative in)\ 2^text(nd) // 3^text(rd)\ text(quadrants:)` | |
| `=>pi/6 t` | `= (pi\ – pi/3),\ (pi + pi/3),\ (3pi\ – pi/3)` |
| `= (2pi)/3,\ (4pi)/3,\ (8pi)/3,\ …` | |
| `:.t` | `= 4,\ 8,\ 16,\ …` |
`:.\ text(In the 1st 12 months,)\ P(t) = 375\ text(when)`
`t=4\ text(months and 8 months.)`
♦ Mean mark 39%
| ii. |  |
Calculus, 2ADV C3 2013 HSC 8 MC
The diagram shows points `A`, `B`, `C` and `D` on the graph `y = f(x)`.

At which point is `f^{′}(x) > 0` and ` f^{″}(x)= 0`?
- `A`
- `B`
- `C`
- `D`
Trigonometry, 2ADV T3 2013 HSC 6 MC
Which diagram shows the graph `y=sin(2x + pi/3)`?


Financial Maths, STD2 F4 2011 HSC 28b
Norman and Pat each bought the same type of tractor for $60 000 at the same time. The value of their tractors depreciated over time.
The salvage value `S`, in dollars, of each tractor, is its depreciated value after `n` years.
Norman drew a graph to represent the salvage value of his tractor.

- Find the gradient of the line shown in the graph. (1 mark)
--- 2 WORK AREA LINES (style=lined) ---
- What does the value of the gradient represent in this situation? (1 mark)
--- 2 WORK AREA LINES (style=lined) ---
- Write down the equation of the line shown in the graph. (1 mark)
--- 3 WORK AREA LINES (style=lined) ---
- Find all the values of `n` that are not suitable for Norman to use when calculating the salvage value of his tractor. Explain why these values are not suitable. (2 marks)
--- 4 WORK AREA LINES (style=lined) ---
Pat used the declining balance formula for calculating the salvage value of her tractor. The depreciation rate that she used was 20% per annum.
- What did Pat calculate the salvage value of her tractor to be after 14 years? (2 marks)
--- 4 WORK AREA LINES (style=lined) ---
- Using Pat’s method for depreciation, describe what happens to the salvage value of her tractor for all values of `n` greater than 15. (1 mark)
--- 2 WORK AREA LINES (style=lined) ---
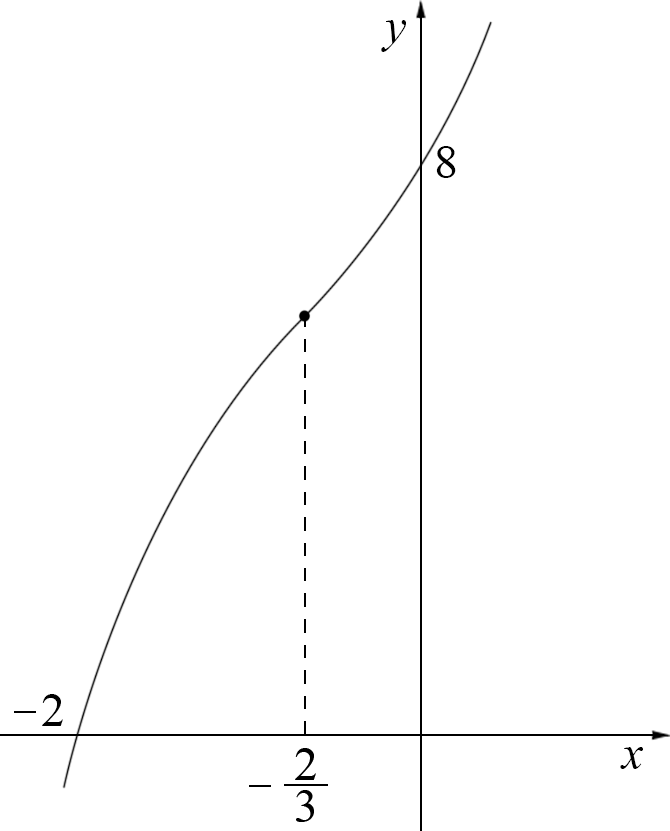
Algebra, STD2 A4 2011 HSC 28a
The air pressure, `P`, in a bubble varies inversely with the volume, `V`, of the bubble.
- Write an equation relating `P`, `V` and `a`, where `a` is a constant. (1 mark)
--- 1 WORK AREA LINES (style=lined) ---
- It is known that `P = 3` when `V = 2`.
By finding the value of the constant, `a`, find the value of `P` when `V = 4`. (2 marks)
--- 4 WORK AREA LINES (style=lined) ---
- Sketch a graph to show how `P` varies for different values of `V`.
Use the horizontal axis to represent volume and the vertical axis to represent air pressure. (2 marks)
--- 8 WORK AREA LINES (style=lined) ---
Show Answers Only
- `P = a/V`
- `P = 1 1/2`
-

Show Worked Solution
♦ Mean mark (i) 39%
COMMENT: Expressing the proportional relationship `P prop 1/V` as the equation `P=k/V` is a core skill here.
COMMENT: Expressing the proportional relationship `P prop 1/V` as the equation `P=k/V` is a core skill here.
| i. | `P` | `prop 1/V` |
| `= a/V` |
| ii. | `text(When)\ P=3,\ V = 2` |
| `3` | `= a/2` |
| `a` | `=6` |
`text(Need to find)\ P\ text(when)\ V = 4`
♦ Mean mark (ii) 47%
| `P` | `=6/4` |
| `= 1 1/2` |
♦♦ Mean mark (iii) 26%
COMMENT: An inverse relationship is reflected by a hyperbola on the graph.
COMMENT: An inverse relationship is reflected by a hyperbola on the graph.
| iii. | |
Financial Maths, STD2 F5 2011 HSC 27d
Josephine invests $50 000 for 15 years, at an interest rate of 6% per annum, compounded annually.
Emma invests $500 at the end of each month for 15 years, at an interest rate of 6% per annum, compounded monthly.
Financial gain is defined as the difference between the final value of an investment and the total contributions.
Who will have the better financial gain after 15 years? Using the Table below* and appropriate formulas, justify your answer with suitable calculations. (4 marks)

--- 8 WORK AREA LINES (style=lined) ---
Statistics, STD2 S5 2011 HSC 27c
Two brands of light bulbs are being compared. For each brand, the life of the light bulbs is normally distributed.

- One of the Brand B light bulbs has a life of 400 hours.
What is the `z`-score of the life of this light bulb? (1 mark)
--- 1 WORK AREA LINES (style=lined) ---
- A light bulb is considered defective if it lasts less than 400 hours. The following claim is made:
‘Brand A light bulbs are more likely to be defective than Brand B light bulbs.’
Is this claim correct? Justify your answer, with reference to `z`-scores or standard deviations or the normal distribution. (2 marks)
--- 4 WORK AREA LINES (style=lined) ---
Measurement, 2UG 2011 HSC 27b
Pontianak has a longitude of 109°E, and Jarvis Island has a longitude of 160°W`.
Both places lie on the Equator.
- Find the shortest distance between these two places, to the nearest kilometre. You may assume that the radius of the Earth is 6400 km. (2 marks)
- The position of Rabaul is 4° to the south and 48° to the west of Jarvis Island. What is the latitude and longitude of Rabaul? (2 marks)
Statistics, STD2 S1 2011 HSC 27a
A company sells handbags in Paris, New York and Florence.
Use the data in the table to complete the area chart below. (2 marks)


Show Answers Only

Show Worked Solution
♦♦ Mean mark 27%
COMMENT: Most common error was to not realise Area charts show cumulative data.
COMMENT: Most common error was to not realise Area charts show cumulative data.
Financial Maths, 2UG 2011 HSC 26c
Furniture priced at $20 000 is purchased. A deposit of 15% is paid.
The balance is borrowed using a flat-rate loan at 19% per annum interest, to be repaid in equal monthly instalments over five years.
What will be the amount of each monthly instalment? Justify your answer with suitable calculations. (4 marks)
Probability, 2UG 2011 HSC 26a
The two spinners shown are used in a game.

Each arrow is spun once. The score is the total of the two numbers shown by the arrows.
A table is drawn up to show all scores that can be obtained in this game.

- What is the value of `X` in the table? (1 mark)
- What is the probability of obtaining a score less than 4? (1 mark)
- On Spinner `B`, a 2 is obtained. What is the probability of obtaining a score of 3? (1 mark)
- Elise plays a game using the spinners with the following financial outcomes.
⇒ Win `$12` for a score of `4`
⇒ Win nothing for a score of less than `4`
⇒ Lose `$3` for a score of more than `4`
It costs `$5` to play this game. Will Elise expect a gain or a loss and how much will it be?
Justify your answer with suitable calculations. (3 marks)
Financial Maths, STD2 F4 2010 HSC 25b
William wants to buy a car. He takes out a loan for $28 000 at 7% per annum interest for four years.
Monthly repayments for loans at different interest rates are shown in the spreadsheet.

How much interest does William pay over the term of this loan? (2 marks)
--- 5 WORK AREA LINES (style=lined) ---
Statistics, STD2 S1 2011 HSC 25d
Data was collected from 30 students on the number of text messages they had sent in the previous 24 hours. The set of data collected is displayed.

- What is the outlier for this set of data? (1 mark)
--- 1 WORK AREA LINES (style=lined) ---
- What is the interquartile range of the data collected from the female students? (1 mark)
--- 1 WORK AREA LINES (style=lined) ---
Statistics, STD2 S1 2011 HSC 25a
A study on the mobile phone usage of NSW high school students is to be conducted.
Data is to be gathered using a questionnaire.
The questionnaire begins with the three questions shown.

- Classify the type of data that will be collected in Q2 of the questionnaire. (1 mark)
--- 1 WORK AREA LINES (style=lined) ---
- Write a suitable question for this questionnaire that would provide discrete ordinal data. (1 mark)
--- 2 WORK AREA LINES (style=lined) ---
- An initial study is to be conducted using a stratified sample.
Describe a method that could be used to obtain a representative stratified sample. (1 mark)
--- 2 WORK AREA LINES (style=lined) ---
- Who should be surveyed if it is decided to use a census for the study? (1 mark)
--- 2 WORK AREA LINES (style=lined) ---
Financial Maths, STD2 F4 2011 HSC 23c
An amount of $5000 is invested at 10% per annum, compounded six-monthly.

Use the table to find the value of this investment at the end of three years. (2 marks)
- « Previous Page
- 1
- …
- 77
- 78
- 79
- 80
- 81
- 82
- Next Page »