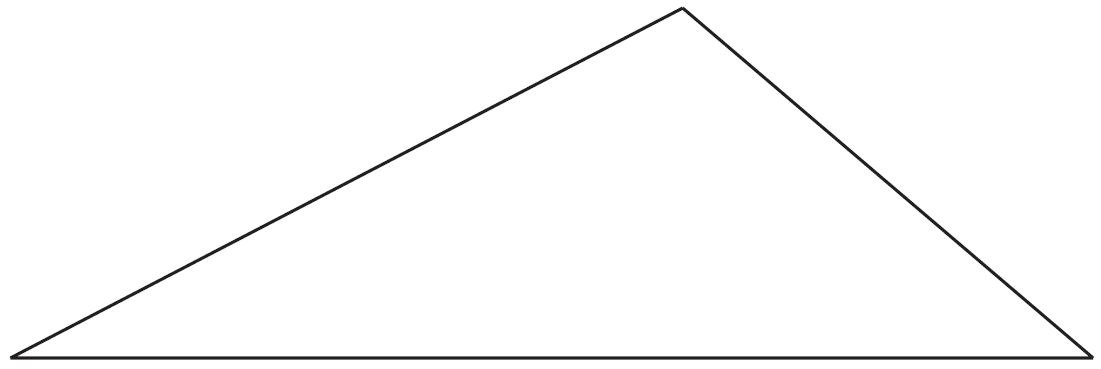
The middle section of a cone is shaded, as shown in the diagram below.

The surface area of the unshaded top section of the cone is 180 cm².
The surface area of the middle section of the cone, in square centimetres, is
A. `80`
B. `120`
C. `300`
D. `320`
E. `500`
Show Worked Solution

`text(Ratio of lengths of)`
♦♦ Mean mark 33%.
`text(Upper Cone : Top Section, is)`
`15:9 = 5:3`
| `∴\ text(Ratio of Areas)` | `=5^2:3^2` |
| `=25:9` |
`text(Let Area of Upper Cone)\ = x`
| `x/180` | `= 25/9` |
| `x` | `= 180 xx 25/9` |
| `= 500\ \ text(cm²)` |
`∴\ text(Area of shaded middle section)`
`= 500 – 180`
`= 320\ \ text(cm²)`
`=> D`