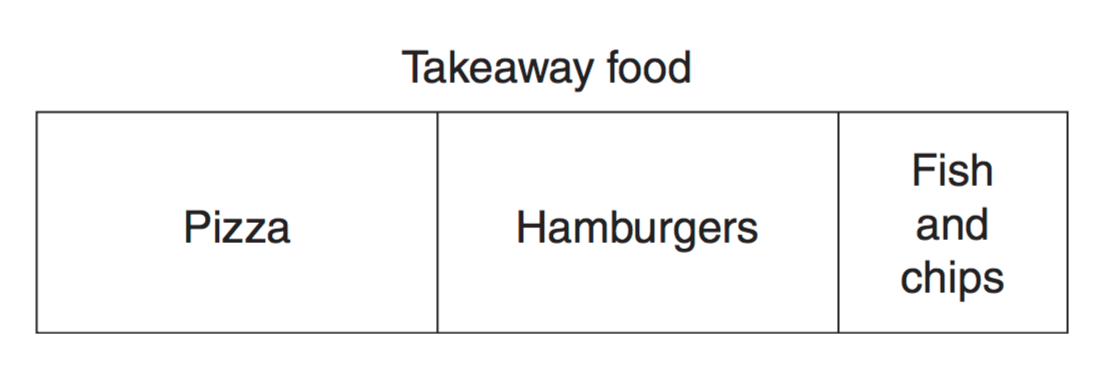
Algebra, STD2 A4 2014 HSC 3 MC
Functions, EXT1 F2 2013 HSC 1 MC
The polynomial
What is the value of
Functions, EXT1 F2 2010 HSC 2c
Let
where
The polynomial
When
- Find the values of
and . (2 marks)
--- 6 WORK AREA LINES (style=lined) ---
- Find the remainder when
is divided by . (1 mark)
--- 2 WORK AREA LINES (style=lined) ---
Functions, EXT1 F1 2010 HSC 1d
Solve
--- 6 WORK AREA LINES (style=lined) ---
Functions, EXT1 F2 2011 HSC 2a
Let
When
Find the remainder when
--- 7 WORK AREA LINES (style=lined) ---
Plane Geometry, EXT1 2012 HSC 10 MC
Functions, EXT1 F2 2012 HSC 8 MC
When the polynomial
What is the remainder when
Functions, EXT1 F1 2011 HSC 1c
Solve
--- 6 WORK AREA LINES (style=lined) ---
Functions, EXT1* F1 2009 HSC 3c
Shade the region in the plane defined by
--- 8 WORK AREA LINES (style=lined) ---
Functions, 2ADV F1 2009 HSC 1a
Sketch the graph of
--- 8 WORK AREA LINES (style=lined) ---
Functions, 2ADV F1 2010 HSC 1g
Let
--- 2 WORK AREA LINES (style=lined) ---
Functions, 2ADV F1 2010 HSC 1c
Write down the equation of the circle with centre
Functions, 2ADV F1 2010 HSC 1a
Solve
Plane Geometry, 2UA 2011 HSC 6a
The diagram shows a regular pentagon
- Find the size of
. (1 mark)
--- 2 WORK AREA LINES (style=lined) ---
- Hence, show that
is isosceles. (2 marks)
--- 5 WORK AREA LINES (style=lined) ---
Functions, EXT1* F1 2012 HSC 8 MC
Functions, EXT1* F1 2013 HSC 11g
Sketch the region defined by
--- 10 WORK AREA LINES (style=lined) ---
Functions, 2ADV F1 2013 HSC 3 MC
Which inequality defines the domain of the function
Functions, 2ADV F1 2013 HSC 1 MC
What are the solutions of
Algebra, STD2 A4 2011 HSC 28a
The air pressure,
- Write an equation relating
, and , where is a constant. (1 mark)
--- 1 WORK AREA LINES (style=lined) ---
- It is known that
when . By finding the value of the constant,
, find the value of when . (2 marks)
--- 4 WORK AREA LINES (style=lined) ---
- Sketch a graph to show how
varies for different values of . Use the horizontal axis to represent volume and the vertical axis to represent air pressure. (2 marks)
--- 8 WORK AREA LINES (style=lined) ---
Statistics, STD2 S1 2011 HSC 25b
The graph below displays data collected at a school on the number of students
in each Year group, who own a mobile phone.
- Which Year group has the highest percentage of students with mobile phones? (1 mark)
--- 1 WORK AREA LINES (style=lined) ---
- Two students are chosen at random, one from Year 9 and one from Year 10.
Which student is more likely to own a mobile phone?
Justify your answer with suitable calculations. (2 marks)
--- 4 WORK AREA LINES (style=lined) ---
- Identify a trend in the data shown in the graph. (1 mark)
--- 2 WORK AREA LINES (style=lined) ---
Statistics, STD2 S1 2010 HSC 27b
The graphs show the distribution of the ages of children in Numbertown in 2000 and 2010.
- In 2000 there were 1750 children aged 0–18 years.
How many children were aged 12–18 years in 2000? (1 mark)
--- 1 WORK AREA LINES (style=lined) ---
- The number of children aged 12–18 years is the same in both 2000 and 2010.
How many children aged 0–18 years are there in 2010? (1 mark)
--- 1 WORK AREA LINES (style=lined) ---
- Identify TWO changes in the distribution of ages between 2000 and 2010. In your answer, refer to measures of location or spread or the shape of the distributions. (2 marks)
--- 5 WORK AREA LINES (style=lined) ---
- What would be ONE possible implication for government planning, as a consequence of this change in the distribution of ages? (1 mark)
--- 2 WORK AREA LINES (style=lined) ---
Algebra, 2UG 2010 HSC 27a
Fully simplify
--- 5 WORK AREA LINES (style=lined) ---
Probability, STD2 S2 2013 HSC 30b
In a class there are 15 girls (G) and 7 boys (B). Two students are chosen at random to be class representatives.
Measurement, STD2 M6 2010 HSC 26d
Probability, STD2 S2 2011 HSC 24b
A die was rolled 72 times. The results for this experiment are shown in the table.
- Find the value of
. (1 mark)
--- 1 WORK AREA LINES (style=lined) ---
- What was the relative frequency of obtaining a 4. (1 mark)
--- 1 WORK AREA LINES (style=lined) ---
- If the die was unbiased, which number was obtained the expected number of times? (1 mark)
--- 1 WORK AREA LINES (style=lined) ---
Statistics, STD2 S1 2011 HSC 17 MC
The heights of the players in a basketball team were recorded as 1.8 m, 1.83 m, 1.84 m, 1.86 m and 1.92 m. When a sixth player joined the team, the average height of the players increased by 1 centimetre.
What was the height of the sixth player?
- 1.85 m
- 1.86 m
- 1.91 m
- 1.93 m
Probability, STD2 S2 2011 HSC 15 MC
An unbiased coin is tossed 10 times.
A tail is obtained on each of the first 9 tosses.
What is the probability that a tail is obtained on the 10th toss?
Statistics, STD2 S1 2011 HSC 14 MC
A data set of nine scores has a median of 7.
The scores 6, 6, 12 and 17 are added to this data set.
What is the median of the data set now?
- 6
- 7
- 8
- 9
Algebra, STD2 A4 2009 HSC 28c
The height above the ground, in metres, of a person’s eyes varies directly with the square of the distance, in kilometres, that the person can see to the horizon.
A person whose eyes are 1.6 m above the ground can see 4.5 km out to sea.
How high above the ground, in metres, would a person’s eyes need to be to see an island that is 15 km out to sea? Give your answer correct to one decimal place. (3 marks)
--- 6 WORK AREA LINES (style=lined) ---
Statistics, STD2 S4 2009 HSC 28b
The height and mass of a child are measured and recorded over its first two years.
This information is displayed in a scatter graph.
- Describe the correlation between the height and mass of this child, as shown in the graph. (1 mark)
--- 2 WORK AREA LINES (style=lined) ---
- A line of best fit has been drawn on the graph.
Find the equation of this line. (2 marks)
--- 4 WORK AREA LINES (style=lined) ---
Probability, STD2 S2 2009 HSC 27c
In each of three raffles, 100 tickets are sold and one prize is awarded.
Mary buys two tickets in one raffle. Jane buys one ticket in each of the other two raffles.
Determine who has the better chance of winning at least one prize. Justify your response using probability calculations. (4 marks)
Algebra, STD2 A1 2009 HSC 25a
Simplify
--- 4 WORK AREA LINES (style=lined) ---
Algebra, STD2 A1 2013 HSC 29a
Sarah tried to solve this equation and made a mistake in Line 2.
Copy the equation in Line 1 and continue your solution to solve this equation for
Show all lines of working. (2 marks)
--- 5 WORK AREA LINES (style=lined) ---
Measurement, STD2 M1 2013 HSC 27d
A rectangular wooden chopping board is advertised as being 17 cm by 25 cm, with each side measured to the nearest centimetre.
- Calculate the percentage error in the measurement of the longer side. (1 mark)
--- 2 WORK AREA LINES (style=lined) ---
- Between what lower and upper limits does the actual area of the top of the chopping board lie? (2 marks)
--- 4 WORK AREA LINES (style=lined) ---
Statistics, STD2 S1 2013 HSC 26f
Jason travels to work by car on all five days of his working week, leaving home at 7 am each day. He compares his travel times using roads without tolls and roads with tolls over a period of 12 working weeks.
He records his travel times (in minutes) in a back-to-back stem-and-leaf plot.
- What is the modal travel time when he uses roads without tolls? (1 mark)
--- 1 WORK AREA LINES (style=lined) ---
- What is the median travel time when he uses roads without tolls? (1 mark)
--- 1 WORK AREA LINES (style=lined) ---
- Describe how the two data sets differ in terms of the spread and skewness of their distributions. (2 marks)
--- 5 WORK AREA LINES (style=lined) ---
Probability, STD2 S2 2013 HSC 26c
The probability that Michael will score more than 100 points in a game of bowling is
- A commentator states that the probability that Michael will score less than 100 points in a game of bowling is
.
Is the commentator correct? Give a reason for your answer. (1 mark)
--- 2 WORK AREA LINES (style=lined) ---
- Michael plays two games of bowling. What is the probability that he scores more than 100 points in the first game and then again in the second game? (1 mark)
--- 1 WORK AREA LINES (style=lined) ---
Statistics, STD2 S1 2013 HSC 26b
Write down a set of six data values that has a range of 12, a mode of 12 and a minimum value of 12. (2 marks)
Measurement, STD2 M6 2013 HSC 26a
Measurement, STD2 M6 2010 HSC 24d
The base of a lighthouse,
- What is the angle of depression from
to , correct to the nearest degree? (3 marks)
--- 6 WORK AREA LINES (style=lined) ---
- How far did the boat travel from
to , correct to the nearest metre? (2 marks)
--- 4 WORK AREA LINES (style=lined) ---
Algebra, STD2 A1 2010 HSC 24a
Fred tried to solve this equation and made a mistake in Line 2.
Copy the equation in Line 1.
- Rewrite Line 2 correcting his mistake. (1 mark)
--- 1 WORK AREA LINES (style=lined) ---
- Continue your solution showing the correct working for Lines 3 and 4 to solve this equation for
. (1 mark)
--- 2 WORK AREA LINES (style=lined) ---
Probability, STD2 S2 2010 HSC 23c
On Saturday, Jonty recorded the colour of T-shirts worn by the people at his gym. The results are shown in the graph.
- How many people were at the gym on Saturday? (Assume everyone was wearing a T-shirt). (1 mark)
--- 1 WORK AREA LINES (style=lined) ---
- What is the probability that a person selected at random at the gym on Saturday, would be wearing either a blue or green T-shirt? (1 mark)
--- 2 WORK AREA LINES (style=lined) ---
Probability, STD2 S2 2010 HSC 20 MC
Algebra, STD2 A1 2010 HSC 18 MC
Which of the following correctly express
Statistics, STD2 S1 2010 HSC 16 MC
Algebra, STD2 A2 2009 HSC 24d
A factory makes boots and sandals. In any week
• the total number of pairs of boots and sandals that are made is 200
• the maximum number of pairs of boots made is 120
• the maximum number of pairs of sandals made is 150.
The factory manager has drawn a graph to show the numbers of pairs of boots (
- Find the equation of the line
. (1 mark)
--- 2 WORK AREA LINES (style=lined) ---
- Explain why this line is only relevant between
and for this factory. (1 mark)
--- 3 WORK AREA LINES (style=lined) ---
- The profit per week,
, can be found by using the equation . Compare the profits at
and . (2 marks)
--- 5 WORK AREA LINES (style=lined) ---
Statistics, STD2 S1 2009 HSC 24a
Measurement, STD2 M1 2009 HSC 23c
The diagram shows the shape and dimensions of a terrace which is to be tiled.
- Find the area of the terrace. (2 marks)
--- 5 WORK AREA LINES (style=lined) ---
- Tiles are sold in boxes. Each box holds one square metre of tiles and costs $55. When buying the tiles, 10% more tiles are needed, due to cutting and wastage.
Find the total cost of the boxes of tiles required for the terrace. (2 marks)
--- 4 WORK AREA LINES (style=lined) ---
Measurement, STD2 M6 2009 HSC 23a
The point
- Show that the height of the building is approximately 19.5 m. (1 mark)
--- 2 WORK AREA LINES (style=lined) ---
- A car is parked 62 m from the base of the building.
What is the angle of depression from the top of the building to the car?
Give your answer to the nearest minute. (2 marks)
--- 5 WORK AREA LINES (style=lined) ---
Algebra, STD2 A1 2009 HSC 16 MC
Algebra, STD2 A2 2009 HSC 14 MC
If
Measurement, STD2 M1 2009 HSC 11 MC
What is the area of the shaded part of this quadrant, to the nearest square centimetre?
- 34 cm²
- 42 cm²
- 50 cm²
- 193 cm²
Financial Maths, STD2 F1 2009 HSC 10 MC
Billy worked for 35 hours at the normal hourly rate of pay and for five hours at double time. He earned $561.60 in total for this work.
What was the normal hourly rate of pay?
- $7.02
- $12.48
- $14.04
- $16.05
Probability, STD2 S2 2009 HSC 9 MC
Financial Maths, STD2 F4 2009 HSC 6 MC
A house was purchased in 1984 for $35 000. Assume that the value of the house has increased by 3% per annum since then.
Which expression gives the value of the house in 2009?
Measurement, STD2 M6 2009 HSC 4 MC
Statistics, STD2 S1 2009 HSC 3 MC
The eye colours of a sample of children were recorded.
When analysing this data, which of the following could be found?
- Mean
- Median
- Mode
- Range
Probability, STD2 S2 2009 HSC 1 MC
A newspaper states: ‘It will most probably rain tomorrow.’
Which of the following best represents the probability of an event that will most probably occur?
Algebra, STD2 A1 2011 HSC 18 MC
Which of the following correctly expresses
Algebra, STD2 A4 2010 HSC 13 MC
The number of hours that it takes for a block of ice to melt varies inversely with the temperature. At 30°C it takes 8 hours for a block of ice to melt.
How long will it take the same size block of ice to melt at 12°C?
- 3.2 hours
- 20 hours
- 26 hours
- 45 hours
- « Previous Page
- 1
- …
- 4
- 5
- 6
- 7
- Next Page »