The graph of the parabola \(y=a(x+2)(x-6)\) for some value of \(a\) is shown.
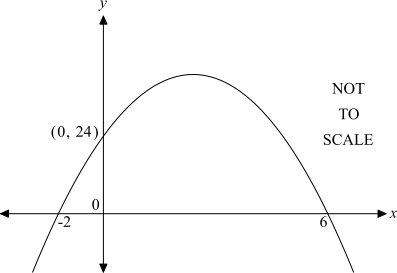
By first finding the value of \(a\), find the coordinates of the vertex. (3 marks)
--- 10 WORK AREA LINES (style=lined) ---
Aussie Maths & Science Teachers: Save your time with SmarterEd
The graph of the parabola \(y=a(x+2)(x-6)\) for some value of \(a\) is shown.
By first finding the value of \(a\), find the coordinates of the vertex. (3 marks)
--- 10 WORK AREA LINES (style=lined) ---
\(\text{Vertex:}\ (2,32)\)
\(\text{Since graph passes through}\ (0,24):\)
| \(24\) | \(=a(0+2)(0-6)\) |
| \(24\) | \(=-12a\) |
| \(a\) | \(=-2\) |
\(\text{Vertex is halfway between \(x\)-intercepts.}\)
\(\Rightarrow \ x=\dfrac{-2+6}{2}=2\)
| \(y\) | \(=-2(2+2)(2-6)\) |
| \(=-2 \times 4 \times (-4)=32\) |
\(\therefore\ \text{Vertex at}\ (2,32).\)
The graph of the parabola \(y=k(x-2)(x-8)\) for some value of \(k\) is shown.
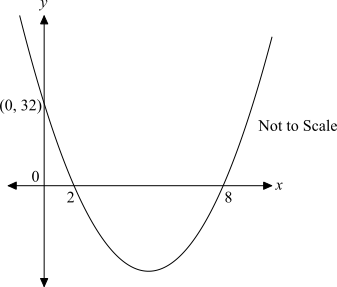
By first finding the value of \(k\), find the coordinates of the vertex. (3 marks)
--- 10 WORK AREA LINES (style=lined) ---
\(\text{Vertex:}\ (5,-18)\)
\(\text{Since graph passes through}\ (0,32):\)
| \(32\) | \(=k(0-2)(0-8)\) |
| \(32\) | \(=16k\) |
| \(k\) | \(=2\) |
\(\text{Vertex is halfway between \(x\)-intercepts.}\)
\(\Rightarrow \ x=\dfrac{2+8}{2}=5\)
| \(y\) | \(=2(5-2)(5-8)\) |
| \(=2 \times 3 \times (-3)\) | |
| \(=-18\) |
\(\therefore\ \text{Vertex at}\ (5,-18).\)
The graph of the parabola \(y=a(x-1)(x-9)\) for some value of \(a\) is shown.
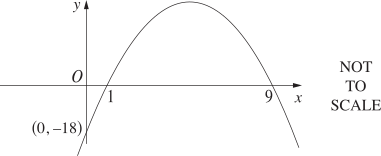
By first finding the value of \(a\), find the coordinates of the vertex. (3 marks)
--- 10 WORK AREA LINES (style=lined) ---
\(\text{Vertex:}\ (5,32)\)
\(\text{Since graph passes through}\ (0,-18):\)
| \(-18\) | \(=a(0-1)(0-9)\) |
| \(-18\) | \(=9a\) |
| \(a\) | \(=-2\) |
\(\text{Vertex is halfway between \(x\)-intercepts}\ \ \Rightarrow\ \ x=5\)
| \(y\) | \(=-2(5-1)(5-9)\) |
| \(=-2 \times 4 \times (-4)=32\) |
\(\therefore\ \text{Vertex at}\ (5,32).\)
The graph of a quadratic function represented by the equation \(h=t^2-8 t+12\) is shown.
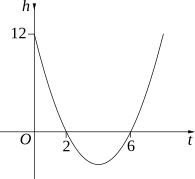
--- 6 WORK AREA LINES (style=lined) ---
--- 3 WORK AREA LINES (style=lined) ---
a. \(\text{Turning point at} \ \ (4,-4)\)
b. \(t=8\)
a. \(\text{Axis of quadratic occurs when}\ \ t= \dfrac{2+6}{2} = 4\)
\(\text{At} \ \ t=4:\)
\(h=4^2-8 \times 4+12=-4\)
\(\therefore \ \text{Turning point at} \ \ (4,-4)\)
b. \(\text {When} \ \ h=12:\)
| \(t^2-8t+12\) | \(=12\) |
| \(t(t-8)\) | \(=0\) |
\(\therefore \ \text{Other value:} \ \ t=8\)
A sheet of metal is folded to make a gutter, as shown. The cross-section of the gutter is a rectangle of width \(w\) cm and height \(h\) cm.
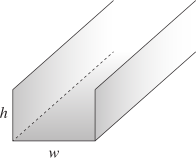
The area, \(A\) cm\(^{2}\), of the cross-section can be modelled by the quadratic formula
\(A=-0.5w^{2}+20w\)
A graph of this model is shown.
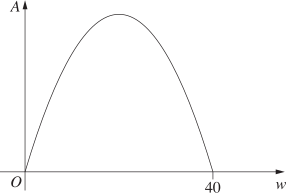
Find the width and height of the rectangle which will give the greatest possible area of the cross-section. (3 marks)
--- 8 WORK AREA LINES (style=lined) ---
\(w=20\ \text{cm}, h=10\ \text{cm}\)
\(\text{Graph cuts}\ w\text{-axis at}\ \ w=0\ \ \text{and}\ \ w=40.\)
\(\text{By symmetry, maximum area occurs at}\ \ w=20.\)
\(A_{\text{max}}=-0.5 \times 20^2 + 20 \times 20 = 200\ \text{cm}^{2}\)
| \(A_{\text{max}}\) | \(=w \times h\) |
| \(200\) | \(=20 \times h\) |
| \(h\) | \(=10\ \text{cm}\) |
\(\therefore A_{\text{max}}\ \text{occurs when:}\ w=20\ \text{cm}, \ h=10\ \text{cm}\)
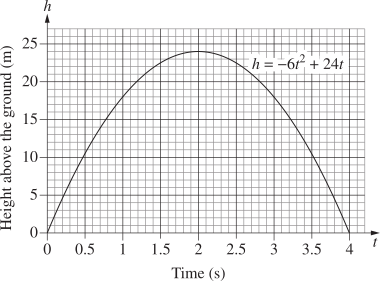
On another planet, a ball is launched vertically into the air from the ground. The height above the ground, `h` metres, can be modelled using the function `h=-6 t^2+24t`, where `t` is measured in seconds. The graph of the function is shown. --- 1 WORK AREA LINES (style=lined) --- --- 3 WORK AREA LINES (style=lined) --- a. `h_max = 24\ text{metres}` b. `t=1 and 3\ text{seconds}` a. `h_max = 24\ text{metres}` b. `3/4 xx h_max = 3/4xx24=18\ text{metres}` `text{From graph, ball is at at 18 metres when:}` `t=1 and 3\ text{seconds}`
A publisher sells a book for $10. At this price, 5000 copies of the book will be sold and the revenue raised will be `5000 xx 10=$50\ 000`.
The publisher is considering increasing the price of the book. For every dollar the price of the book is increased, the publisher will sell 50 fewer copies of the book.
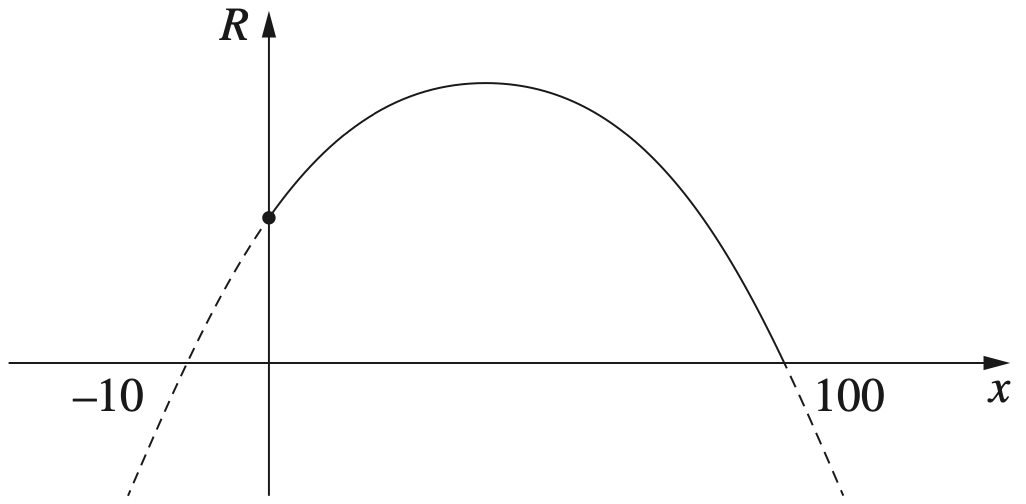
If the publisher charges `(10+x)` dollars for each book, a quadratic model for the revenue raised, `R`, from selling books is
`R=-50x^2+4500x + 50\ 000`
--- 4 WORK AREA LINES (style=lined) ---
--- 2 WORK AREA LINES (style=lined) ---
a. `$55`
b. `$50\ 000`
a. `text{Highest revenue}\ (R)\ text(occurs halfway between)`
`x= –10 and x=100.`
`text{Midpoint}\ =(-10 + 100)/2 = 45`
`:.\ text(Price of book for)\ R_text(max)`
`=45 + 10=$55`
b. `ytext(-intercept → find)\ \ R\ \ text(when)\ \ x=0:`
`R= -50(0)^2 + 4500(0) + 50\ 000=$50\ 000`
A fence is to be built around the outside of a rectangular paddock. An internal fence is also to be built.
The side lengths of the paddock are `x` metres and `y` metres, as shown in the diagram.
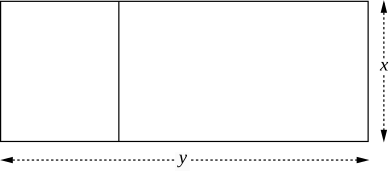
A total of 900 metres of fencing is to be used. Therefore `3x + 2y = 900`.
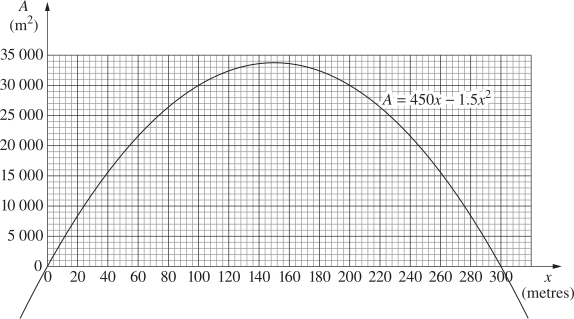
The area, `A`, in square metres, of the rectangular paddock is given by `A =450x - 1.5x^2`.
The graph of this equation is shown.
--- 2 WORK AREA LINES (style=lined) ---
--- 4 WORK AREA LINES (style=lined) ---
--- 2 WORK AREA LINES (style=lined) ---
a. `200 \ text(m)`
b. `x = 150 \ text(m and) \ y = 225 \ text(m)`
c. `33 \ 750 \ text(m)^2`
a. `text(From the graph, an area of)\ 30\ 000\ text(m)^2`
`text(can have an)\ x text(-value of)\ \ x=100 or 200\ text(m.)`
`:. x_text(max) = 200 text(m)`
b. `A_text(max) \ text(occurs when) \ \ x = 150`
`text(Substitute)\ \ x=150\ \ text(into)\ \ 3x + 2y = 900:`
| `3 xx 150 + 2y` | `= 900` |
| `2y` | `= 450` |
| `y` | `= 225` |
`therefore \ text(Maximum area when) \ \ x = 150 \ text(m and) \ \ y = 225 \ text(m)`
| c. | `A_(max)` | `= xy` |
| `= 150 xx 225= 33 \ 750 \ text(m)^2` |