The graph of the parabola \(y=a(x+2)(x-6)\) for some value of \(a\) is shown.
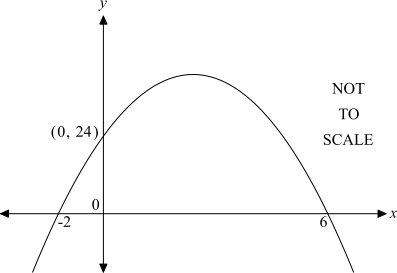
By first finding the value of \(a\), find the coordinates of the vertex. (3 marks)
--- 10 WORK AREA LINES (style=lined) ---
Aussie Maths & Science Teachers: Save your time with SmarterEd
The graph of the parabola \(y=a(x+2)(x-6)\) for some value of \(a\) is shown.
By first finding the value of \(a\), find the coordinates of the vertex. (3 marks)
--- 10 WORK AREA LINES (style=lined) ---
The graph of the parabola \(y=k(x-2)(x-8)\) for some value of \(k\) is shown.
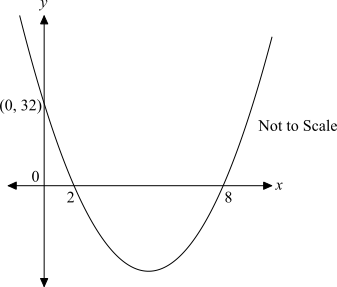
By first finding the value of \(k\), find the coordinates of the vertex. (3 marks)
--- 10 WORK AREA LINES (style=lined) ---
The graph of the parabola \(y=a(x-1)(x-9)\) for some value of \(a\) is shown.
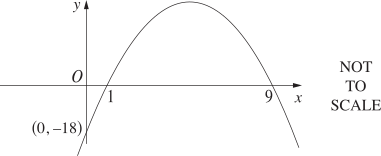
By first finding the value of \(a\), find the coordinates of the vertex. (3 marks)
--- 10 WORK AREA LINES (style=lined) ---
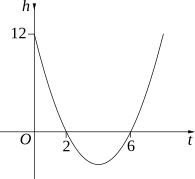
The graph of a quadratic function represented by the equation \(h=t^2-8 t+12\) is shown.
--- 6 WORK AREA LINES (style=lined) ---
--- 3 WORK AREA LINES (style=lined) ---
A sheet of metal is folded to make a gutter, as shown. The cross-section of the gutter is a rectangle of width \(w\) cm and height \(h\) cm.
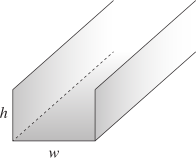
The area, \(A\) cm\(^{2}\), of the cross-section can be modelled by the quadratic formula
\(A=-0.5w^{2}+20w\)
A graph of this model is shown.
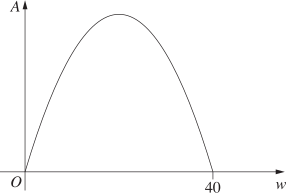
Find the width and height of the rectangle which will give the greatest possible area of the cross-section. (3 marks)
--- 8 WORK AREA LINES (style=lined) ---
The braking distance of a car, in metres, is directly proportional to the square of its speed in km/h, and can be represented by the equation
`text{braking distance}\ = k xx text{(speed)}^2`
where `k` is the constant of variation.
The braking distance for a car travelling at 50 km/h is 20 m.
--- 4 WORK AREA LINES (style=lined) ---
--- 2 WORK AREA LINES (style=lined) ---
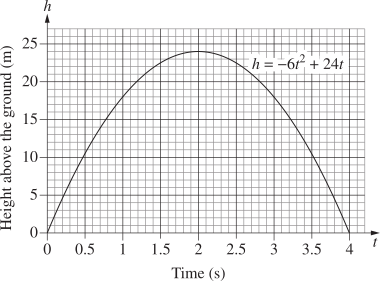
On another planet, a ball is launched vertically into the air from the ground. The height above the ground, `h` metres, can be modelled using the function `h=-6 t^2+24t`, where `t` is measured in seconds. The graph of the function is shown. --- 1 WORK AREA LINES (style=lined) --- --- 3 WORK AREA LINES (style=lined) ---
An object is projected vertically into the air. Its height, `h` metres, above the ground after `t` seconds is given by `h=-5 t^2+80 t`.
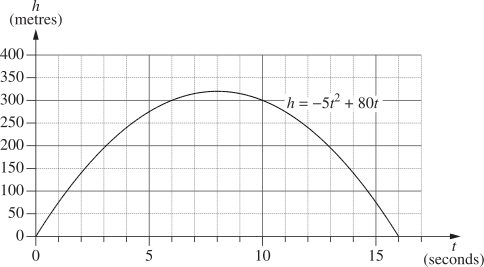
For how long is the object at a height of 300 metres or more above the ground?
A publisher sells a book for $10. At this price, 5000 copies of the book will be sold and the revenue raised will be `5000 xx 10=$50\ 000`.
The publisher is considering increasing the price of the book. For every dollar the price of the book is increased, the publisher will sell 50 fewer copies of the book.
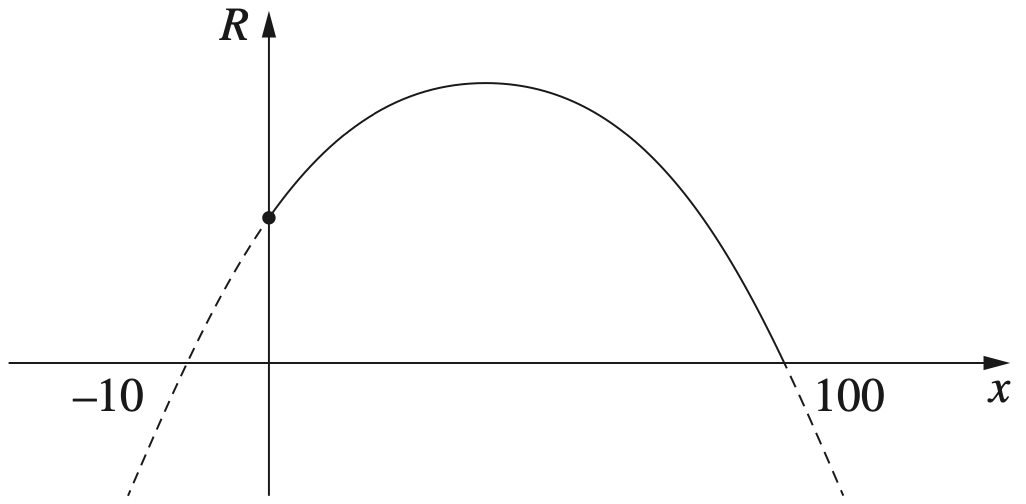
If the publisher charges `(10+x)` dollars for each book, a quadratic model for the revenue raised, `R`, from selling books is
`R=-50x^2+4500x + 50\ 000`
--- 4 WORK AREA LINES (style=lined) ---
--- 2 WORK AREA LINES (style=lined) ---
A fence is to be built around the outside of a rectangular paddock. An internal fence is also to be built.
The side lengths of the paddock are `x` metres and `y` metres, as shown in the diagram.
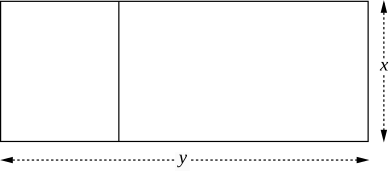
A total of 900 metres of fencing is to be used. Therefore `3x + 2y = 900`.
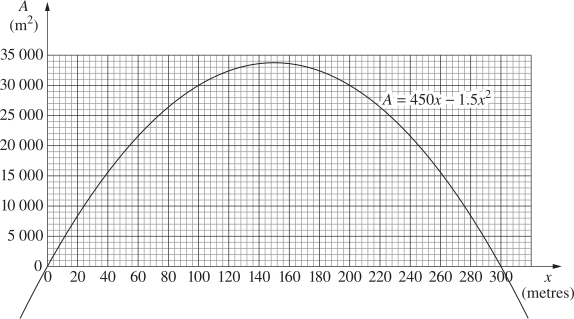
The area, `A`, in square metres, of the rectangular paddock is given by `A =450x - 1.5x^2`.
The graph of this equation is shown.
--- 2 WORK AREA LINES (style=lined) ---
--- 4 WORK AREA LINES (style=lined) ---
--- 2 WORK AREA LINES (style=lined) ---
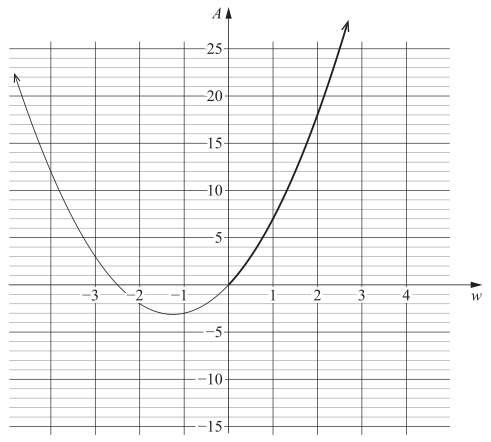
A rectangle has width `w` centimetres. The area of the rectangle, `A`, in square centimetres, is `A = 2w^2 + 5w`.
The graph `A = 2w^2 + 5w` is shown.
--- 2 WORK AREA LINES (style=lined) ---
--- 4 WORK AREA LINES (style=lined) ---
Moses finds that a Froghead eel's mass is directly proportional to the square of its length.
An eel of this species has a length of 72 cm and a mass of 8250 grams.
What is the expected length of a Froghead eel with a mass of 10.2 kg? Give your answer to one decimal place. (3 marks)
--- 6 WORK AREA LINES (style=lined) ---
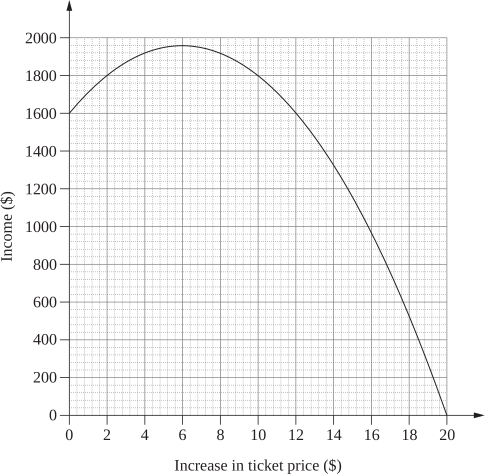
A movie theatre has 200 seats. Each ticket currently costs $8.
The theatre owners are currently selling all 200 tickets for each session. They decide to increase the price of tickets to see if they can increase the income earned from each movie session.
It is assumed that for each one dollar increase in ticket price, there will be 10 fewer tickets sold.
A graph showing the relationship between an increase in ticket price and the income is shown below.
--- 1 WORK AREA LINES (style=lined) ---
--- 1 WORK AREA LINES (style=lined) ---
--- 4 WORK AREA LINES (style=lined) ---
A diver springs upwards from a diving board, then plunges into the water. The diver’s height above the water as it varies with time is modelled by a quadratic function. Graphing software is used to produce the graph of this function.
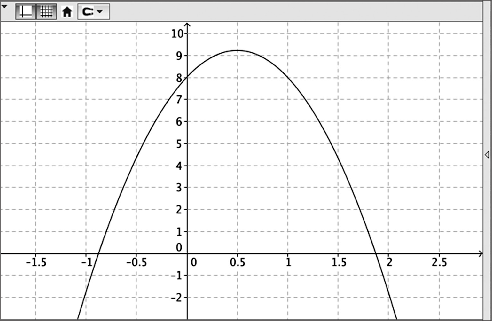
Explain how the graph could be used to determine how high above the height of the diving board the diver was when he reached the maximum height. (2 marks)
--- 5 WORK AREA LINES (style=lined) ---
A new tunnel is built. When there is no toll to use the tunnel, 6000 vehicles use it each day. For each dollar increase in the toll, 500 fewer vehicles use the tunnel.
--- 1 WORK AREA LINES (style=lined) ---
--- 4 WORK AREA LINES (style=lined) ---
--- 4 WORK AREA LINES (style=lined) ---
Show that Anne is incorrect and find the maximum daily income from tolls. (Use a table of values, or a graph, or suitable calculations.) (3 marks)
--- 7 WORK AREA LINES (style=lined) ---
a. `text(500 less vehicles per $1 toll)`
`12 xx 500 = 6000`
`:. $12\ text(toll is the lowest for which no vehicles will use the tunnel.)`
b. `text(If the toll is $5)`
`5 xx 500 = 2500\ text(less vehicles)`
`text(Vehicles using the tunnel) = 6000-2500 = 3500`
`:.\ text(Daily toll income)= 3500 xx $5= $17\ 500`
| c. `d` | `=\ text(toll)` |
| `v` | `=\ text(Number of vehicles using the tunnel)` |
| `:. v` | `= 6000-500d` |
d. `text(Income from tolls)`
`=\ text(Number of vehicles) xx text(toll)`
`= (6000-500d) xx d`
`= 6000d-500d^2= 500d (12-d)`

`text(From the graph, the maximum income when the toll is $6.)`
`:.\ text(Anne is incorrect.)`
`text(Alternate Solution)`

`text{The table of values shows that income (I) increases}`
`text(and peaks when the toll hits $6 before decreasing)`
`text(again as the toll gets more expensive.)`
`:.\ text(Anne is incorrect.)`
The height above the ground, in metres, of a person’s eyes varies directly with the square of the distance, in kilometres, that the person can see to the horizon.
A person whose eyes are 1.6 m above the ground can see 4.5 km out to sea.
How high above the ground, in metres, would a person’s eyes need to be to see an island that is 15 km out to sea? Give your answer correct to one decimal place. (3 marks)
--- 6 WORK AREA LINES (style=lined) ---
Anjali is investigating stopping distances for a car travelling at different speeds. To model this she uses the equation
`d = 0.01s^2+ 0.7s`,
where `d` is the stopping distance in metres and `s` is the car’s speed in km/h.
The graph of this equation is drawn below.

In your writing booklet, using a set of axes, sketch the part of this curve that applies for stopping distances. (1 mark)
--- 4 WORK AREA LINES (style=lined) ---
a.

b. `54\ text(metres)`
| a. |
|
b. `text(When)\ \ s = 40:`
`d= 0.01(40^2)+ 0.7 (40)= 44\ text(m)`
`text(When)\ \ s = 70:`
`d= 0.01 (70^2) +0.7(70)= 98\ text(m)`
`:.\ text(Difference)= 98-44= 54\ text(metres)`
A golf ball is hit from point `A` to point `B`, which is on the ground as shown. Point `A` is 30 metres above the ground and the horizontal distance from point `A` to point `B` is 300 m.
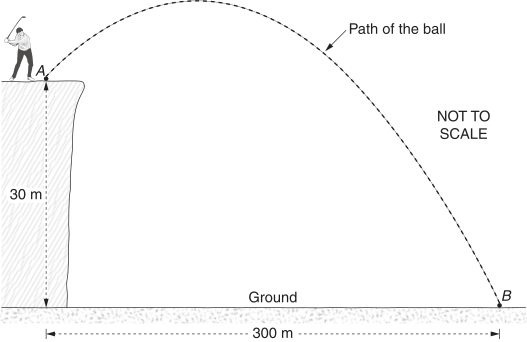
The path of the golf ball is modelled using the equation
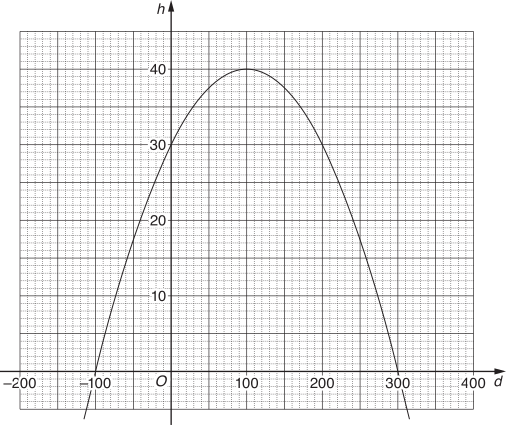
`h = 30 + 0.2d-0.001d^2`
where
`h` is the height of the golf ball above the ground in metres, and
`d` is the horizontal distance of the golf ball from point `A` in metres.
The graph of this equation is drawn below.
--- 1 WORK AREA LINES (style=lined) ---
What horizontal distance does the ball travel in the period between these two occasions? (1 mark)
--- 2 WORK AREA LINES (style=lined) ---
--- 2 WORK AREA LINES (style=lined) ---
--- 4 WORK AREA LINES (style=lined) ---
Leanne wants to build a rectangular vegetable garden in her backyard. She has 20 metres of fencing and will use a wall as one side of the garden. The plan for her garden is shown, where `x` metres is the width of her garden.
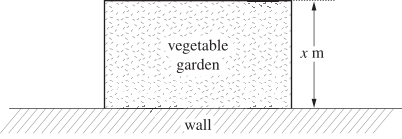
Which equation gives the area, `A`, of the vegetable garden?