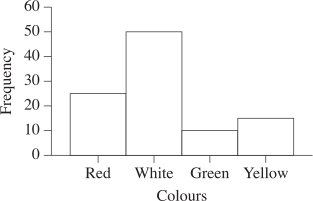
A spinner made up of 4 colours is spun 100 times. The frequency histogram shows the results.
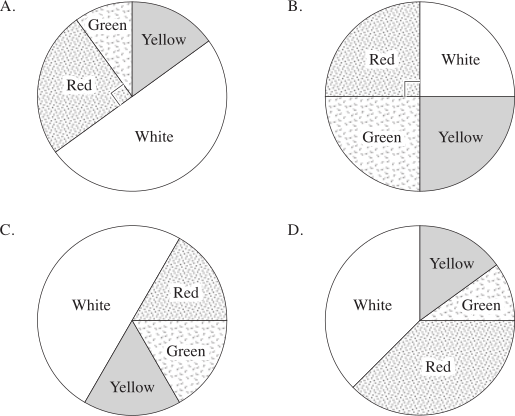
Which of these spinners is most likely to give the results shown?
Aussie Maths & Science Teachers: Save your time with SmarterEd
A spinner made up of 4 colours is spun 100 times. The frequency histogram shows the results.
Which of these spinners is most likely to give the results shown?
The faces on a twenty-sided die are labelled $0.05, $0.10, $0.15, … , $1.00.
The die is rolled once.
What is the probability that the amount showing on the upper face is more than 50 cents but less than 80 cents?
The table shows the relative frequency of selecting each of the different coloured jelly beans from packets containing green, yellow, black, red and white jelly beans.
\begin{array} {|c|c|}
\hline
\rule{0pt}{2.5ex} \textit{Colour} \rule[-1ex]{0pt}{0pt} & \textit{Relative frequency} \\
\hline
\rule{0pt}{2.5ex} \text{Green} \rule[-1ex]{0pt}{0pt} & 0.32 \\
\hline
\rule{0pt}{2.5ex} \text{Yellow} \rule[-1ex]{0pt}{0pt} & 0.13 \\
\hline
\rule{0pt}{2.5ex} \text{Black} \rule[-1ex]{0pt}{0pt} & 0.14 \\
\hline
\rule{0pt}{2.5ex} \text{Red} \rule[-1ex]{0pt}{0pt} & \\
\hline
\rule{0pt}{2.5ex} \text{White} \rule[-1ex]{0pt}{0pt} & 0.24 \\
\hline
\end{array}
--- 2 WORK AREA LINES (style=lined) ---
--- 2 WORK AREA LINES (style=lined) ---
The diagram shows a spinner.
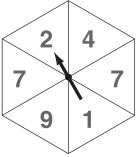
The arrow is spun and will stop in one of the six sections.
What is the probability that the arrow will stop in a section containing a number greater
than 4?
There are 100 tickets sold in a raffle. Justine sold all 100 tickets to five of her friends. The number of tickets she sold to each friend is shown in the table.
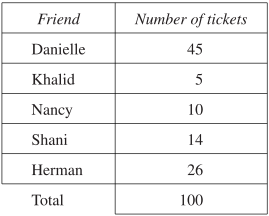
Give a reason why Justine’s statement is NOT correct. (1 mark)
--- 2 WORK AREA LINES (style=lined) ---
--- 4 WORK AREA LINES (style=lined) ---
A bag contains some marbles. The probability of selecting a blue marble at random from this bag is `3/8`.
Which of the following could describe the marbles that are in the bag?
On Saturday, Jonty recorded the colour of T-shirts worn by the people at his gym. The results are shown in the graph.
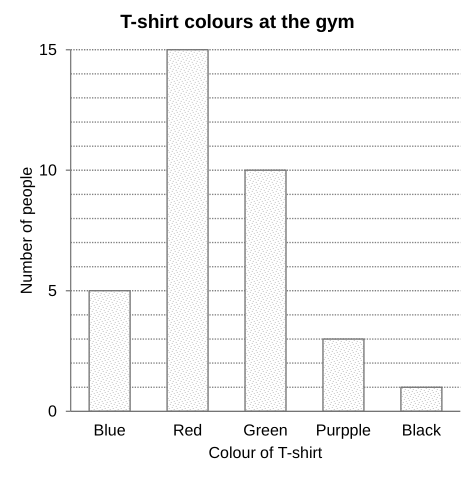
--- 1 WORK AREA LINES (style=lined) ---
--- 2 WORK AREA LINES (style=lined) ---
A bag contains red, green, yellow and blue balls.
\begin{array} {|c|c|}
\hline
\rule{0pt}{2.5ex} \textit{Colour} \rule[-1ex]{0pt}{0pt} & \textit{Probability} \\
\hline
\rule{0pt}{2.5ex} \text{Red} & \dfrac{1}{3} \\
\hline
\rule{0pt}{2.5ex} \text{Green} & \dfrac{1}{4} \\
\hline
\rule{0pt}{2.5ex} \text{Yellow} & \text{?} \\
\hline
\rule{0pt}{2.5ex} \text{Blue} & \dfrac{1}{6} \\
\hline
\end{array}
The table shows the probability of choosing a red, green, or blue ball from the bag.
If there are 12 yellow balls in the bag, how many balls are in the bag altogether
Which of the following events would be LEAST likely to occur?