A biased die is made from this net.
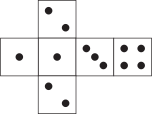
The die is rolled once.
What is the probability of rolling a 2?
- \(\dfrac{1}{6}\)
- \(\dfrac{1}{4}\)
- \(\dfrac{1}{3}\)
- \(\dfrac{1}{2}\)
Aussie Maths & Science Teachers: Save your time with SmarterEd
A biased die is made from this net.
The die is rolled once.
What is the probability of rolling a 2?
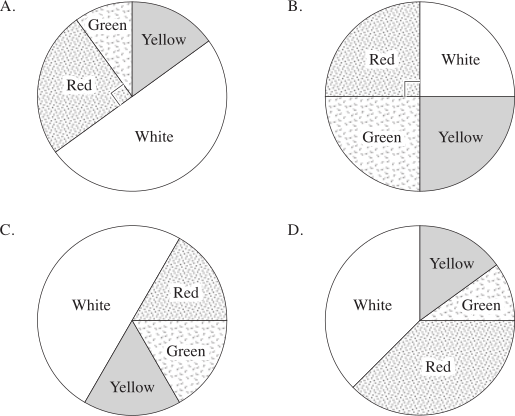
A spinner made up of 4 colours is spun 100 times. The frequency histogram shows the results.
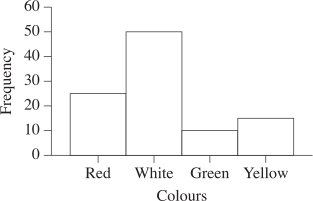
Which of these spinners is most likely to give the results shown?
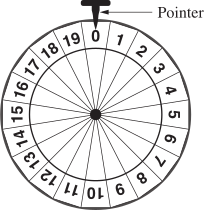
A wheel is shown with the numbers 0 to 19 marked.
A game is played where the wheel is spun until it stops.
When the wheel stops, a pointer points to the winning number. Each number is equally likely to win.
--- 2 WORK AREA LINES (style=lined) ---
--- 4 WORK AREA LINES (style=lined) ---
Mark buys one raffle ticket in a raffle with 1000 tickets.
Which of the following best describes the probability that Mark wins?
Four cards marked with the numbers 1, 2, 3 and 4 are placed face down on a table.
One card is turned over as shown.

What is the probability that the next card turned over is marked with an odd number?
A game involves throwing a die and spinning a spinner.
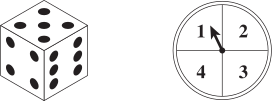
The sum of the two numbers obtained is the score.
The table of scores below is partially completed.
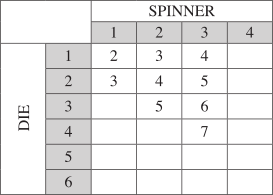
What is the probability of getting a score of 7 or more?
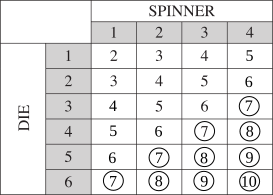
`Ptext{(score 7+)} = 10/24=5/12`
`=>D`
Each number from 1 to 30 is written on a separate card. The 30 cards are shuffled. A game is played where one of these cards is selected at random. Each card is equally likely to be selected.
Ezra is playing the game, and wins if the card selected shows an odd number between 20 and 30.
--- 1 WORK AREA LINES (style=lined) ---
--- 4 WORK AREA LINES (style=lined) ---
A jar contains 12 red, 10 black and 13 white lollies.
Alex picks out a red lolly and eats it. He then randomly picks a second lolly.
What is the probability that the second lolly is also red?
In a bag, there are six playing cards, 2, 4, 6, 8, Queen and King. The Queen and King are known as picture cards.
Two of these cards are chosen randomly. All the possible outcomes are shown.

--- 2 WORK AREA LINES (style=lined) ---
--- 2 WORK AREA LINES (style=lined) ---
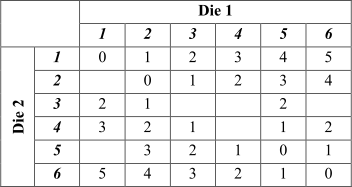
Barbara plays a game of chance, in which two unbiased six-sided dice are rolled. The score for the game is obtained by finding the difference between the two numbers rolled. For example, if Barbara rolls a 2 and a 5, the score is 3.
The table shows some of the scores.
--- 3 WORK AREA LINES (style=lined) ---
a.
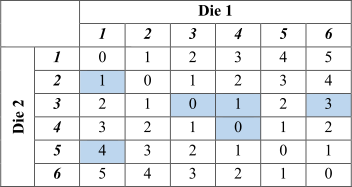
b. `frac{5}{6}`
a.
| b. | `Ptext{(not zero)}` | `= frac{text(numbers) ≠ 0}{text(total numbers)}` |
| `= frac{30}{36}= frac{5}{6}` |
\(\text{Alternate solution (b)}\)
| b. | `Ptext{(not zero)}` | `= 1-Ptext{(zero)}` |
| `= 1-frac{6}{36}` | ||
| `= frac{5}{6}` |
The two spinners shown are used in a game.

Each arrow is spun once. The score is the total of the two numbers shown by the arrows.
A table is drawn up to show all scores that can be obtained in this game.

--- 1 WORK AREA LINES (style=lined) ---
--- 2 WORK AREA LINES (style=lined) ---
--- 2 WORK AREA LINES (style=lined) ---
An experiment has three distinct outcomes, A, B and C.
Outcome A occurs 50% of the time. Outcome B occurs 23% of the time.
What is the expected number of times outcome C would occur if the experiment is conducted 500 times?
The faces on a twenty-sided die are labelled $0.05, $0.10, $0.15, … , $1.00.
The die is rolled once.
What is the probability that the amount showing on the upper face is more than 50 cents but less than 80 cents?
A cricket team is about to play two matches. The probability of the team having a win, a loss or a draw is 0.7, 0.1 and 0.2 respectively in each match. The possible results in the two matches are displayed in the probability tree diagram.

--- 4 WORK AREA LINES (style=lined) ---
Give one reason why this is NOT correct. (1 mark)
--- 2 WORK AREA LINES (style=lined) ---
The table shows the relative frequency of selecting each of the different coloured jelly beans from packets containing green, yellow, black, red and white jelly beans.
\begin{array} {|c|c|}
\hline
\rule{0pt}{2.5ex} \textit{Colour} \rule[-1ex]{0pt}{0pt} & \textit{Relative frequency} \\
\hline
\rule{0pt}{2.5ex} \text{Green} \rule[-1ex]{0pt}{0pt} & 0.32 \\
\hline
\rule{0pt}{2.5ex} \text{Yellow} \rule[-1ex]{0pt}{0pt} & 0.13 \\
\hline
\rule{0pt}{2.5ex} \text{Black} \rule[-1ex]{0pt}{0pt} & 0.14 \\
\hline
\rule{0pt}{2.5ex} \text{Red} \rule[-1ex]{0pt}{0pt} & \\
\hline
\rule{0pt}{2.5ex} \text{White} \rule[-1ex]{0pt}{0pt} & 0.24 \\
\hline
\end{array}
--- 2 WORK AREA LINES (style=lined) ---
--- 2 WORK AREA LINES (style=lined) ---
The diagram shows a spinner.
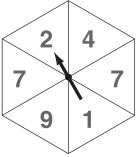
The arrow is spun and will stop in one of the six sections.
What is the probability that the arrow will stop in a section containing a number greater
than 4?
Kay randomly selected a marble from a bag of marbles, recorded its colour and returned it to the bag. She repeated this process a number of times.
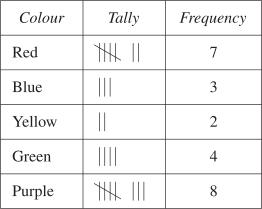
Based on these results, what is the best estimate of the probability that Kay will choose a green marble on her next selection?
The probability of an event occurring is `9/10.`
Which statement best describes the probability of this event occurring?
There are 100 tickets sold in a raffle. Justine sold all 100 tickets to five of her friends. The number of tickets she sold to each friend is shown in the table.
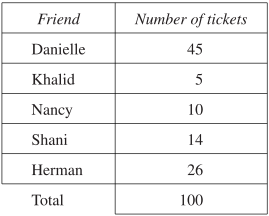
Give a reason why Justine’s statement is NOT correct. (1 mark)
--- 2 WORK AREA LINES (style=lined) ---
--- 4 WORK AREA LINES (style=lined) ---
Two dice are rolled. What is the probability that only one of the dice shows a six?
Four radio stations reported the probability of rain as shown in the table.
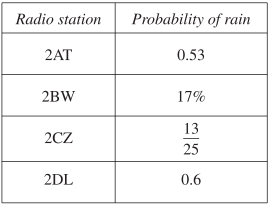
Which radio station reported the highest probability of rain?
Which fraction is equal to a probability of `text(25%)`?
Give an example of an event that has a probability of exactly `3/4`. (1 mark)
--- 2 WORK AREA LINES (style=lined) ---
A bag contains some marbles. The probability of selecting a blue marble at random from this bag is `3/8`.
Which of the following could describe the marbles that are in the bag?
An unbiased coin is tossed 10 times.
A tail is obtained on each of the first 9 tosses.
What is the probability that a tail is obtained on the 10th toss?
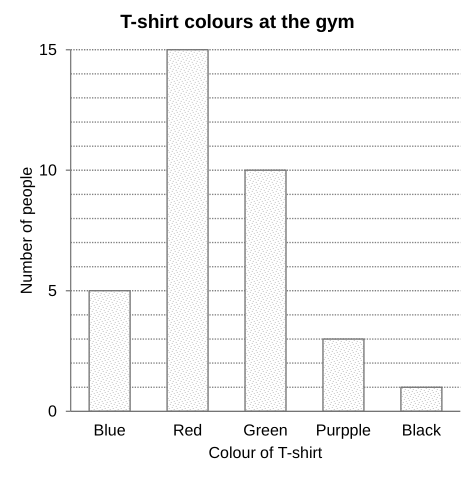
On Saturday, Jonty recorded the colour of T-shirts worn by the people at his gym. The results are shown in the graph.
--- 1 WORK AREA LINES (style=lined) ---
--- 2 WORK AREA LINES (style=lined) ---
A newspaper states: ‘It will most probably rain tomorrow.’
Which of the following best represents the probability of an event that will most probably occur?
Which of the following could be the probability of an event occurring?
A bag contains red, green, yellow and blue balls.
\begin{array} {|c|c|}
\hline
\rule{0pt}{2.5ex} \textit{Colour} \rule[-1ex]{0pt}{0pt} & \textit{Probability} \\
\hline
\rule{0pt}{2.5ex} \text{Red} & \dfrac{1}{3} \\
\hline
\rule{0pt}{2.5ex} \text{Green} & \dfrac{1}{4} \\
\hline
\rule{0pt}{2.5ex} \text{Yellow} & \text{?} \\
\hline
\rule{0pt}{2.5ex} \text{Blue} & \dfrac{1}{6} \\
\hline
\end{array}
The table shows the probability of choosing a red, green, or blue ball from the bag.
If there are 12 yellow balls in the bag, how many balls are in the bag altogether
Two unbiased dice, each with faces numbered 1, 2, 3, 4, 5, 6, are rolled.
What is the probability of a 6 appearing on at least one of the dice?
Two unbiased dice, each with faces numbered 1, 2, 3, 4, 5, 6, are rolled.
What is the probability of obtaining a sum of 6?
Which of the following events would be LEAST likely to occur?