Find the centre and radius of the circle with the equation
`x^2+6x+y^2-y+3=0` (2 marks)
Aussie Maths & Science Teachers: Save your time with SmarterEd
Find the centre and radius of the circle with the equation
`x^2+6x+y^2-y+3=0` (2 marks)
--- 4 WORK AREA LINES (style=lined) ---

--- 0 WORK AREA LINES (style=lined) ---
a. `text{Centre}\ (1,-3/2),\ \ text{Radius}\ =2`
b.

| a. | `x^2-2x+y^2+3y-3/4` | `=0` |
| `x^2-2x+1+y^2+3y+9/4-4` | `=0` | |
| `(x-1)^2+(y+3/2)^2` | `=2^2` |
`text{Centre}\ (1,-3/2),\ \ text{Radius}\ =2`
b.
--- 4 WORK AREA LINES (style=lined) ---
--- 0 WORK AREA LINES (style=lined) ---
a. `text{Centre}\ (2,-3),\ text{Radius}\ = 2`
b.

| a. | `x^2-4x+y^2+6y+9` | `=0` |
| `x^2-4x+4+y^2+6y+9-4` | `=0` | |
| `(x-2)^2+(y+3)^2` | `=2^2` |
`:.\ text{Centre}\ (2,-3),\ text{Radius}\ = 2`
b.
Find the centre and radius of the circle with the equation
`x^2+ y^2+8y= 0` (2 marks)
Find the centre and radius of the circle with the equation
`x^2+10x + y^2-6y+33 = 0` (2 marks)
--- 4 WORK AREA LINES (style=lined) ---

--- 0 WORK AREA LINES (style=lined) ---
a. `(x+3)^2 + (y+2)^2 = 3^2`
`:.\ text(Centre:)\ (-3,-2)\text(, Radius:)\ 3`
b.

| a. | `x^2+6x+y^2+4y+4` | `=0` |
| `x^2+6x+9+y^2+4y+4-9` | `=0` | |
| `(x+3)^2+(y+2)^2` | `=3^2` |
`:.\ text(Centre:)\ (-3,-2)\text(, Radius:)\ 3`
b.
--- 2 WORK AREA LINES (style=lined) ---
--- 0 WORK AREA LINES (style=lined) ---
a. `(x-1)^2 + (y+2)^2 = 4`
b.

a. `text{Circle with centre}\ (1,-2),\ r = 2:`
`(x-1)^2 + (y+2)^2 = 4`
b.
Write down the equation of the circle with centre `(0, -3)` and radius 4. (1 mark)
Find the centre and radius of the circle with the equation
`x^2-12x + y^2 + 2y-12 = 0` (2 marks)
A circle with centre `(a,-2)` and radius 5 units has equation
`x^2-6x + y^2 + 4y = b` where `a` and `b` are real constants.
The values of `a` and `b` are respectively
The diagram shows the curve with equation `y = x^2-7x + 10`. The curve intersects the `x`-axis at points `A and B`. The point `C` on the curve has the same `y`-coordinate as the `y`-intercept of the curve.

--- 4 WORK AREA LINES (style=lined) ---
--- 4 WORK AREA LINES (style=lined) ---
The parabola `y = −2x^2 + 8x` and the line `y = 2x` intersect at the origin and at the point `A`.

Find the `x`-coordinate of the point `A`. (2 marks)
--- 5 WORK AREA LINES (style=lined) ---
| i. |
|
`x\text(-coordinate of)\ A:`
| `y` | `= 2x\ \ \ \ \ …\ text{(i)}` |
| `y` | `= -2x^2 + 8x\ \ \ \ \ …\ text{(ii)}` |
`text(Subst)\ y = 2x\ text{from (i) into (ii):}`
| `-2x^2 + 8x` | `= 2x` |
| `-2x^2 + 6x` | `= 0` |
| `-2x (x-3)` | `= 0` |
`:.\ x = 0\ text(or)\ 3`
`:.\ x\text(-coordinate of)\ A\ text(is 3)`
Sketch the graph of `y=4/(x-3)`. (3 marks)
--- 0 WORK AREA LINES (style=lined) ---

`text{Vertical asymptote at}\ \ x=3`
`text{As}\ \ x->oo, \ y->0`
`text{Horizontal asymptote at}\ \ y=0`
\begin{array} {|l|c|c|c|c|c|c|}
\hline
\rule{0pt}{2.5ex}\ \ x\ \ \rule[-1ex]{0pt}{0pt} & -1 & \ \ 0\ \ & \ \ 2\ \ & \ \ 4\ \ & \ \ 5\ \ \\
\hline
\rule{0pt}{2.5ex}\ \ \ y\ \ \rule[-1ex]{0pt}{0pt} & -1 & -\frac{4}{3} & -4 & 4 & 2\\
\hline
\end{array}
Sketch the graph of `y=2/(3-x)`. (3 marks)
--- 0 WORK AREA LINES (style=lined) ---

`text{Vertical asymptote at}\ \ x=3`
`text{As}\ \ x->oo, \ y->0`
`text{Horizontal asymptote at}\ \ y=0`
\begin{array} {|l|c|c|c|c|c|}
\hline
\rule{0pt}{2.5ex}\ \ x\ \ \rule[-1ex]{0pt}{0pt} & -1 & \ \ 0\ \ & \ \ 2\ \ & \ \ 4\ \ & \ \ 5\ \ \\
\hline
\rule{0pt}{2.5ex}\ \ \ y\ \ \rule[-1ex]{0pt}{0pt} & \frac{1}{2} & \frac{2}{3} & 2 & -2 & -1\\
\hline
\end{array}
Sketch the graph of `y=3/(x+1)`. (2 marks)
--- 0 WORK AREA LINES (style=lined) ---

`text{Vertical asymptote at}\ \ x=-1`
`text{As}\ \ x->oo, \ y->0`
`text{Horizontal asymptote at}\ \ y=0`
\begin{array} {|l|c|c|c|c|c|c|}
\hline
\rule{0pt}{2.5ex}\ \ x\ \ \rule[-1ex]{0pt}{0pt} & -3 & -2 & -1 & \ \ 0\ \ & \ \ 1\ \ \\
\hline
\rule{0pt}{2.5ex}\ \ \ y\ \ \rule[-1ex]{0pt}{0pt} & -\frac{3}{2} & -3 & ∞ & 3 & \frac{3}{2} \\
\hline
\end{array}
Sketch the graph of `y=1/(x-2)`. (2 marks)
--- 0 WORK AREA LINES (style=lined) ---

`text{Vertical asymptote at}\ \ x=2`
`text{As}\ \ x->oo, \ y->0`
`text{Horizontal asymptote at}\ \ y=0`
\begin{array} {|l|c|c|c|c|c|c|}
\hline
\rule{0pt}{2.5ex}\ \ x\ \ \rule[-1ex]{0pt}{0pt} & \ \ 0\ \ & \ \ 1\ \ & \ \ 2\ \ & \ \ 3\ \ & \ \ 4\ \ \\
\hline
\rule{0pt}{2.5ex}\ \ \ y\ \ \rule[-1ex]{0pt}{0pt} & -\frac{1}{2} & -1 & ∞ & 1 & \frac{1}{2} \\
\hline
\end{array}
Sketch the graph of `f(x) = (2x+1)/(x-1)`. Label the axis intercepts with their coordinates and label any asymptotes with the appropriate equation. (4 marks)

--- 0 WORK AREA LINES (style=lined) ---

| `(2x+1)/(x-1)` | `=(2x-2+3)/(x-1)` | |
| `=(2(x-1)+3)/(x-1)` | ||
| `=2 + 3/(x-1)` |
`text(Asymptotes:)\ \ x = 1,\ \ y = 2`
`text(As)\ \ x->oo,\ \ y->2(+)`
`text(As)\ \ x->-oo,\ \ y->2(-)`
`text(As)\ \ x->-1 (-),\ \ y->-oo`
`text(As)\ \ x->-1 (+),\ \ y->oo`
--- 3 WORK AREA LINES (style=lined) ---
--- 0 WORK AREA LINES (style=lined) ---
i. `text{Vertical asymptote at}\ \ x=0`
`text{Horizontal asymptote at}\ \ y=2`
ii.

i. `y=2-1/x`
`text{Vertical asymptote at}\ \ x=0`
`text{As}\ x->oo, \ 1/x -> 0\ \ => 2-1/x -> 2`
`text{Horizontal asymptote at}\ \ y=2`
ii.
\begin{array} {|l|c|c|c|c|c|c|}
\hline
\rule{0pt}{2.5ex}\ \ x\ \ \rule[-1ex]{0pt}{0pt} & -2 & -1 & \ \ 0\ \ & \ \ 1\ \ & \ \ 2\ \ \\
\hline
\rule{0pt}{2.5ex}\ \ \ y\ \ \rule[-1ex]{0pt}{0pt} & \frac{5}{2} & 3 & ∞ & 1 & \frac{3}{2} \\
\hline
\end{array}
Sketch the graph of `y=2/x+2`.
Clearly mark all asymptotes. (3 marks)
--- 0 WORK AREA LINES (style=lined) ---

\begin{array} {|l|c|c|c|c|c|c|}
\hline
\rule{0pt}{2.5ex}\ \ x\ \ \rule[-1ex]{0pt}{0pt} & -2 & -1 & \ \ 0\ \ & \ \ 1\ \ & \ \ 2\ \ \\
\hline
\rule{0pt}{2.5ex}\ \ \ y\ \ \rule[-1ex]{0pt}{0pt} & 1 & 0 & ∞ & 4 & 3 \\
\hline
\end{array}
Sketch the graph of `y=-2/x`. (2 marks)

--- 0 WORK AREA LINES (style=lined) ---

\begin{array} {|l|c|c|c|c|c|c|}
\hline
\rule{0pt}{2.5ex}\ \ x\ \ \rule[-1ex]{0pt}{0pt} & -2 & -1 & \ \ 0\ \ & \ \ 1\ \ & \ \ 2\ \ \\
\hline
\rule{0pt}{2.5ex}\ \ \ y\ \ \rule[-1ex]{0pt}{0pt} & 1 & 2 & ∞ & -2 & -1 \\
\hline
\end{array}

\begin{array} {|l|c|c|c|c|c|c|}
\hline
\rule{0pt}{2.5ex}\ \ x\ \ \rule[-1ex]{0pt}{0pt} & -2 & -1 & \ \ 0\ \ & \ \ 1\ \ & \ \ 2\ \ \\
\hline
\rule{0pt}{2.5ex}\ \ \ y\ \ \rule[-1ex]{0pt}{0pt} & -\frac{3}{2} & -3 & ∞ & 3 & \frac{3}{2} \\
\hline
\end{array}
Factorise the parabola described by the equation `y=-x^2-x+12` and find its vertex. (3 marks)
--- 6 WORK AREA LINES (style=lined) ---
--- 2 WORK AREA LINES (style=lined) ---
--- 4 WORK AREA LINES (style=lined) ---
--- 2 WORK AREA LINES (style=lined) ---
--- 4 WORK AREA LINES (style=lined) ---
--- 4 WORK AREA LINES (style=lined) ---
--- 5 WORK AREA LINES (style=lined) ---
By completing the square, find the coordinates of the vertex of the parabola with equation
`y=x^2-3x+1` (3 marks)
By completing the square, find the coordinates of the vertex of the parabola with equation
`y=x^2+8x+9` (3 marks)
By completing the square, find the coordinates of the vertex of the parabola with equation
`y=x^2-6x-4` (3 marks)
\begin{array} {|l|c|c|c|c|}
\hline
\rule{0pt}{2.5ex} x \rule[-1ex]{0pt}{0pt} & -2 & -1 & \ \ 0\ \ & \ \ 1\ \ & \ \ 2 \ \ \\
\hline
\rule{0pt}{2.5ex} y \rule[-1ex]{0pt}{0pt} & & & 2 & & 0 \\
\hline
\end{array}

--- 2 WORK AREA LINES (style=lined) ---
i.
\begin{array} {|l|c|c|c|c|}
\hline
\rule{0pt}{2.5ex} x \rule[-1ex]{0pt}{0pt} & -2 & -1 & \ \ 0\ \ & \ \ 1\ \ & \ \ 2 \ \ \\
\hline
\rule{0pt}{2.5ex} y \rule[-1ex]{0pt}{0pt} & 0 & \frac{3}{2} & 2 & \frac{3}{2} & 0 \\
\hline
\end{array}
ii.

iii. `text{The parabola is concave down for all values of}\ x.`
`=>\ text{There are no values of}\ x\ text{where the graph is concave up.}`
i.
\begin{array} {|l|c|c|c|c|}
\hline
\rule{0pt}{2.5ex} x \rule[-1ex]{0pt}{0pt} & -2 & -1 & \ \ 0\ \ & \ \ 1\ \ & \ \ 2 \ \ \\
\hline
\rule{0pt}{2.5ex} y \rule[-1ex]{0pt}{0pt} & 0 & \frac{3}{2} & 2 & \frac{3}{2} & 0 \\
\hline
\end{array}
ii.
iii. `text{The parabola is concave down for all values of}\ x.`
`=>\ text{There are no values of}\ x\ text{where the graph is concave up.}`
\begin{array} {|l|c|c|c|c|c|c|}
\hline
\rule{0pt}{2.5ex} x \rule[-1ex]{0pt}{0pt} & -3 & -2 & -1 & \ \ 0\ \ & \ \ 1\ \ & \ \ 2\ \ & \ \ 3 \ \ \\
\hline
\rule{0pt}{2.5ex} y \rule[-1ex]{0pt}{0pt} & & & 6 & & & & -10 \\
\hline
\end{array}

--- 2 WORK AREA LINES (style=lined) ---
i.
\begin{array} {|l|c|c|c|c|c|c|}
\hline
\rule{0pt}{2.5ex} x \rule[-1ex]{0pt}{0pt} & -3 & -2 & -1 & \ \ 0\ \ & \ \ 1\ \ & \ \ 2\ \ & \ \ 3 \ \ \\
\hline
\rule{0pt}{2.5ex} y \rule[-1ex]{0pt}{0pt} & -10 & 0 & 6 & 8 & 6 & 0 & -10 \\
\hline
\end{array}
ii.

iii. `text{The parabola is concave down for all values of}\ x.`
i.
\begin{array} {|l|c|c|c|c|c|c|}
\hline
\rule{0pt}{2.5ex} x \rule[-1ex]{0pt}{0pt} & -3 & -2 & -1 & \ \ 0\ \ & \ \ 1\ \ & \ \ 2\ \ & \ \ 3 \ \ \\
\hline
\rule{0pt}{2.5ex} y \rule[-1ex]{0pt}{0pt} & -10 & 0 & 6 & 8 & 6 & 0 & -10 \\
\hline
\end{array}
ii.
iii. `text{The parabola is concave down for all values of}\ x.`
\begin{array} {|l|c|c|c|c|c|}
\hline
\rule{0pt}{2.5ex} x \rule[-1ex]{0pt}{0pt} & -2 & -1 & \ \ 0\ \ & \ \ 1\ \ & \ \ 2\ \ \\
\hline
\rule{0pt}{2.5ex} y \rule[-1ex]{0pt}{0pt} & & & & 3 & \\
\hline
\end{array}

--- 2 WORK AREA LINES (style=lined) ---
i.
\begin{array} {|l|c|c|c|c|c|}
\hline
\rule{0pt}{2.5ex} x \rule[-1ex]{0pt}{0pt} & -2 & -1 & \ \ 0\ \ & \ \ 1\ \ & \ \ 2\ \ \\
\hline
\rule{0pt}{2.5ex} y \rule[-1ex]{0pt}{0pt} & 0 & 3 & 4 & 3 & 0 \\
\hline
\end{array}
ii.

iii. `text{Vertex at (0,4)}`
By completing the table of values, sketch the graph of `y=2x^2-3`. (3 marks)
\begin{array} {|l|c|c|c|c|c|}
\hline
\rule{0pt}{2.5ex} x \rule[-1ex]{0pt}{0pt} & -2 & -1 & \ \ 0\ \ & \ \ 1\ \ & \ \ 2\ \ \\
\hline
\rule{0pt}{2.5ex} y \rule[-1ex]{0pt}{0pt} & & & & -1 & \\
\hline
\end{array}
--- 0 WORK AREA LINES (style=lined) ---
\begin{array} {|l|c|c|c|c|c|}
\hline
\rule{0pt}{2.5ex} x \rule[-1ex]{0pt}{0pt} & -2 & -1 & \ \ 0\ \ & \ \ 1\ \ & \ \ 2\ \ \\
\hline
\rule{0pt}{2.5ex} y \rule[-1ex]{0pt}{0pt} & 5 & -1 & -3 & -1 & 5 \\
\hline
\end{array}

\begin{array} {|l|c|c|c|c|c|}
\hline
\rule{0pt}{2.5ex} x \rule[-1ex]{0pt}{0pt} & -2 & -1 & \ \ 0\ \ & \ \ 1\ \ & \ \ 2\ \ \\
\hline
\rule{0pt}{2.5ex} y \rule[-1ex]{0pt}{0pt} & 5 & -1 & -3 & -1 & 5 \\
\hline
\end{array}
By completing the table of values, sketch the graph of `y=x^2+3`. (3 marks)
\begin{array} {|l|c|c|c|c|c|}
\hline
\rule{0pt}{2.5ex} x \rule[-1ex]{0pt}{0pt} & -2 & -1 & \ \ 0\ \ & \ \ 1\ \ & \ \ 2\ \ \\
\hline
\rule{0pt}{2.5ex} y \rule[-1ex]{0pt}{0pt} & & & & 4 & \\
\hline
\end{array}
--- 0 WORK AREA LINES (style=lined) ---
\begin{array} {|l|c|c|c|c|c|}
\hline
\rule{0pt}{2.5ex} x \rule[-1ex]{0pt}{0pt} & -2 & -1 & \ \ 0\ \ & \ \ 1\ \ & \ \ 2\ \ \\
\hline
\rule{0pt}{2.5ex} y \rule[-1ex]{0pt}{0pt} & 7 & 4 & 3 & 4 & 7 \\
\hline
\end{array}

\begin{array} {|l|c|c|c|c|c|}
\hline
\rule{0pt}{2.5ex} x \rule[-1ex]{0pt}{0pt} & -2 & -1 & \ \ 0\ \ & \ \ 1\ \ & \ \ 2\ \ \\
\hline
\rule{0pt}{2.5ex} y \rule[-1ex]{0pt}{0pt} & 7 & 4 & 3 & 4 & 7 \\
\hline
\end{array}
By completing the table of values, sketch the graph of `y=x^2-2`. (3 marks)
\begin{array} {|l|c|c|c|c|c|}
\hline
\rule{0pt}{2.5ex} x \rule[-1ex]{0pt}{0pt} & -2 & -1 & \ \ 0\ \ & \ \ 1\ \ & \ \ 2\ \ \\
\hline
\rule{0pt}{2.5ex} y \rule[-1ex]{0pt}{0pt} & & -1 & & & \\
\hline
\end{array}
--- 0 WORK AREA LINES (style=lined) ---

\begin{array} {|l|c|c|c|c|c|}
\hline
\rule{0pt}{2.5ex} x \rule[-1ex]{0pt}{0pt} & -2 & -1 & \ \ 0\ \ & \ \ 1\ \ & \ \ 2\ \ \\
\hline
\rule{0pt}{2.5ex} y \rule[-1ex]{0pt}{0pt} & 2 & -1 & 0 & -1 & 2 \\
\hline
\end{array}
Which graph best represents the equation `y = 5^(−x)`?
| A. |  |
B. |  |
| C. |  |
D. |  |
Sketch the graph of `y=3^x+2`, clearly labelling any asymptotes. (3 marks)

--- 0 WORK AREA LINES (style=lined) ---

`y=3^x+2`
\begin{array} {|l|c|c|c|c|c|}
\hline
\rule{0pt}{2.5ex} x \rule[-1ex]{0pt}{0pt} & -2 & -1 & \ \ 0\ \ & \ \ 1\ \ & \ \ 2\ \ \\
\hline
\rule{0pt}{2.5ex} y \rule[-1ex]{0pt}{0pt} & 2 \frac{1}{9} & 2 \frac{1}{3} & 3 & 5 & 11\\
\hline
\end{array}
Sketch the graph of `y=3(2^(-x))-1` (3 marks)

--- 0 WORK AREA LINES (style=lined) ---

\begin{array} {|l|c|c|c|c|c|}
\hline
\rule{0pt}{2.5ex} x \rule[-1ex]{0pt}{0pt} & -1 & \ \ 0\ \ & \ \ 1\ \ & \ \ 2\ \ & \ \ 3\ \ \\
\hline
\rule{0pt}{2.5ex} y \rule[-1ex]{0pt}{0pt} & 5 & 2 & \frac{1}{2} & -\frac{1}{4} & -\frac{5}{8}\\
\hline
\end{array}
By completing the table of values, sketch the graph of `y=2^(-x)` (3 marks)
\begin{array} {|l|c|c|c|c|c|}
\hline
\rule{0pt}{2.5ex} \ \ x\ \ \rule[-1ex]{0pt}{0pt} & -2 & -1 & \ \ 0\ \ & \ \ 1\ \ & \ \ 2\ \ \\
\hline
\rule{0pt}{2.5ex} \ \ y\ \ \rule[-1ex]{0pt}{0pt} & & & 1 & & \\
\hline
\end{array}

--- 0 WORK AREA LINES (style=lined) ---

\begin{array} {|l|c|c|c|c|c|}
\hline
\rule{0pt}{2.5ex} x \rule[-1ex]{0pt}{0pt} & -2 & -1 & \ \ 0\ \ & \ \ 1\ \ & \ \ 2\ \ \\
\hline
\rule{0pt}{2.5ex} y \rule[-1ex]{0pt}{0pt} & 4 & 2 & 1 & \frac{1}{2} & \frac{1}{4}\\
\hline
\end{array}
\begin{array} {|l|c|c|c|c|c|}
\hline
\rule{0pt}{2.5ex} x \rule[-1ex]{0pt}{0pt} & -2 & -1 & \ \ 0\ \ & \ \ 1\ \ & \ \ 2\ \ \\
\hline
\rule{0pt}{2.5ex} y \rule[-1ex]{0pt}{0pt} & & -\frac{1}{2} & & & 3\\
\hline
\end{array}

--- 0 WORK AREA LINES (style=lined) ---
i.
\begin{array} {|l|c|c|c|c|c|}
\hline
\rule{0pt}{2.5ex} x \rule[-1ex]{0pt}{0pt} & -2 & -1 & \ \ 0\ \ & \ \ 1\ \ & \ \ 2\ \ \\
\hline
\rule{0pt}{2.5ex} y \rule[-1ex]{0pt}{0pt} & -\frac{3}{4} & -\frac{1}{2} & 0 & 1 & 3\\
\hline
\end{array}
ii.

In 2004 there were 13.5 million registered motor vehicles in Australia. The number of registered motor vehicles is increasing at a rate of 2.3% per year.
Find an expression that represents the number (in millions) of registered motor vehicles `(V)`, if `y` represents the number of years after 2004? (2 marks)
The container shown is initially full of water.

Water leaks out of the bottom of the container at a constant rate.
Which graph best shows the depth of water in the container as time varies?
| A. |  |
B. |  |
| C. |  |
D. |  |
A student believes that the time it takes for an ice cube to melt (`M` minutes) varies inversely with the room temperature `(T^@ text{C})`. The student observes that at a room temperature of `15^@text{C}` it takes 12 minutes for an ice cube to melt.
--- 4 WORK AREA LINES (style=lined) ---
\begin{array} {|l|c|c|c|}
\hline
\rule{0pt}{2.5ex} \ \ T\ \ \rule[-1ex]{0pt}{0pt} & \ \ \ 5\ \ \ & \ \ 15\ \ \ & \ \ \ 30\ \ \ \\
\hline
\rule{0pt}{2.5ex} \ \ M\ \ \rule[-1ex]{0pt}{0pt} & & & \\
\hline
\end{array}

--- 0 WORK AREA LINES (style=lined) ---
| a. | `M` | `prop 1/T` |
| `M` | `=k/T` | |
| `12` | `=k/15` | |
| `k` | `=15 xx 12` | |
| `=180` |
`:.M=180/T`
b.
\begin{array} {|l|c|c|c|}
\hline
\rule{0pt}{2.5ex} \ \ T\ \ \rule[-1ex]{0pt}{0pt} & \ \ \ 5\ \ \ & \ \ 15\ \ \ & \ \ 30\ \ \\
\hline
\rule{0pt}{2.5ex} \ \ M\ \ \rule[-1ex]{0pt}{0pt} & 36 & 12 & 6 \\
\hline
\end{array}
An object is projected vertically into the air. Its height, `h` metres, above the ground after `t` seconds is given by `h=-5 t^2+80 t`.

For how long is the object at a height of 300 metres or more above the ground?
Without using calculus, sketch the graph of `y = 2 + 1/(x + 4)`, showing the asymptotes and the `x` and `y` intercepts. (3 marks)
--- 8 WORK AREA LINES (style=lined) ---

`text(Asymptotes:)\ x = -4`
`text(As)\ \ x -> ∞, y -> 2`
`ytext(-intercept occurs when)\ \ x = 0:`
`y = 2.25`
`xtext(-intercept occurs when)\ \ y = 0:`
`2 + 1/(x + 4) = 0 \ => \ x = -4.5`
A population, `P`, is to be modelled using the function `P = 2000 (1.2)^t`, where `t` is the time in years.
--- 1 WORK AREA LINES (style=lined) ---
--- 1 WORK AREA LINES (style=lined) ---

--- 0 WORK AREA LINES (style=lined) ---
| `P` | `= 2000 (1.2)^0` | |
| `= 2000` |
b. `text{Find} \ P \ text{when} \ \ t = 5: `
| `P` | `= 2000 (1.2)^5` | |
| `= 4976.64` | ||
| `= 4977 \ text{(nearest whole)}` |
c.

Which of the following best represents the graph of `y = 10 (0.8)^x`?

Each year the number of fish in a pond is three times that of the year before.
Complete the table above showing the number of fish in 2021 and 2022. (2 marks)

--- 4 WORK AREA LINES (style=lined) ---
a.
\begin{array} {|l|c|c|c|c|}
\hline
\rule{0pt}{2.5ex}\textit{Year}\rule[-1ex]{0pt}{0pt} & \ \ \ 2020\ \ \ & \ \ \ 2021\ \ \ & \ \ \ 2022\ \ \ & \ \ \ 2023\ \ \ \\
\hline
\rule{0pt}{2.5ex}\textit{Number of fish}\rule[-1ex]{0pt}{0pt} & 100 & 300 & 900 & 2700\\
\hline
\end{array}
b.

c. The more suitable model is exponential.
A linear dataset would graph a straight line which is not the case here.
An exponential curve can be used to graph populations that grow at an increasing rate, such as this example.
a.
\begin{array} {|l|c|c|c|c|}
\hline
\rule{0pt}{2.5ex}\textit{Year}\rule[-1ex]{0pt}{0pt} & \ \ \ 2020\ \ \ & \ \ \ 2021\ \ \ & \ \ \ 2022\ \ \ & \ \ \ 2023\ \ \ \\
\hline
\rule{0pt}{2.5ex}\textit{Number of fish}\rule[-1ex]{0pt}{0pt} & 100 & 300 & 900 & 2700\\
\hline
\end{array}
b.
c. The more suitable model is exponential.
A linear dataset would graph a straight line which is not the case here.
An exponential curve can be used to graph populations that grow at an increasing rate, such as this example.
The circle of `x^2-6x + y^2 + 4y-3 = 0` is reflected in the `x`-axis.
Sketch the reflected circle, showing the coordinates of the centre and the radius. (3 marks)
--- 8 WORK AREA LINES (style=lined) ---

| `x^2-6x + y^2 + 4y-3` | `= 0` |
| `x^2-6x + 9 + y^2 + 4y + 4-16` | `= 0` |
| `(x-3)^2 + (y + 2)^2` | `= 16` |
`=>\ text{Original circle has centre (3, − 2), radius = 4}`
`text(Reflect in)\ xtext(-axis):`
`text{Centre (3, − 2) → (3, 2)}`
A fence is to be built around the outside of a rectangular paddock. An internal fence is also to be built.
The side lengths of the paddock are `x` metres and `y` metres, as shown in the diagram.

A total of 900 metres of fencing is to be used. Therefore `3x + 2y = 900`.
The area, `A`, in square metres, of the rectangular paddock is given by `A =450x - 1.5x^2`.
The graph of this equation is shown.

--- 2 WORK AREA LINES (style=lined) ---
--- 4 WORK AREA LINES (style=lined) ---
--- 2 WORK AREA LINES (style=lined) ---
Which graph best represents the equation `y = x^2-2`?
| A. |  |
B. |  |
| C. |  |
D. |  |
Sketch the graph of `(x-3)^2 + (y + 2)^2 = 4.` (2 marks)
--- 8 WORK AREA LINES (style=lined) ---

`(x-3)^2 + (y + 2)^2 = 4\ \ text(is a circle),`
`text(centre)\ (3, -2),\ text(radius 2.)`
Which graph best represents `y = 3^x`?


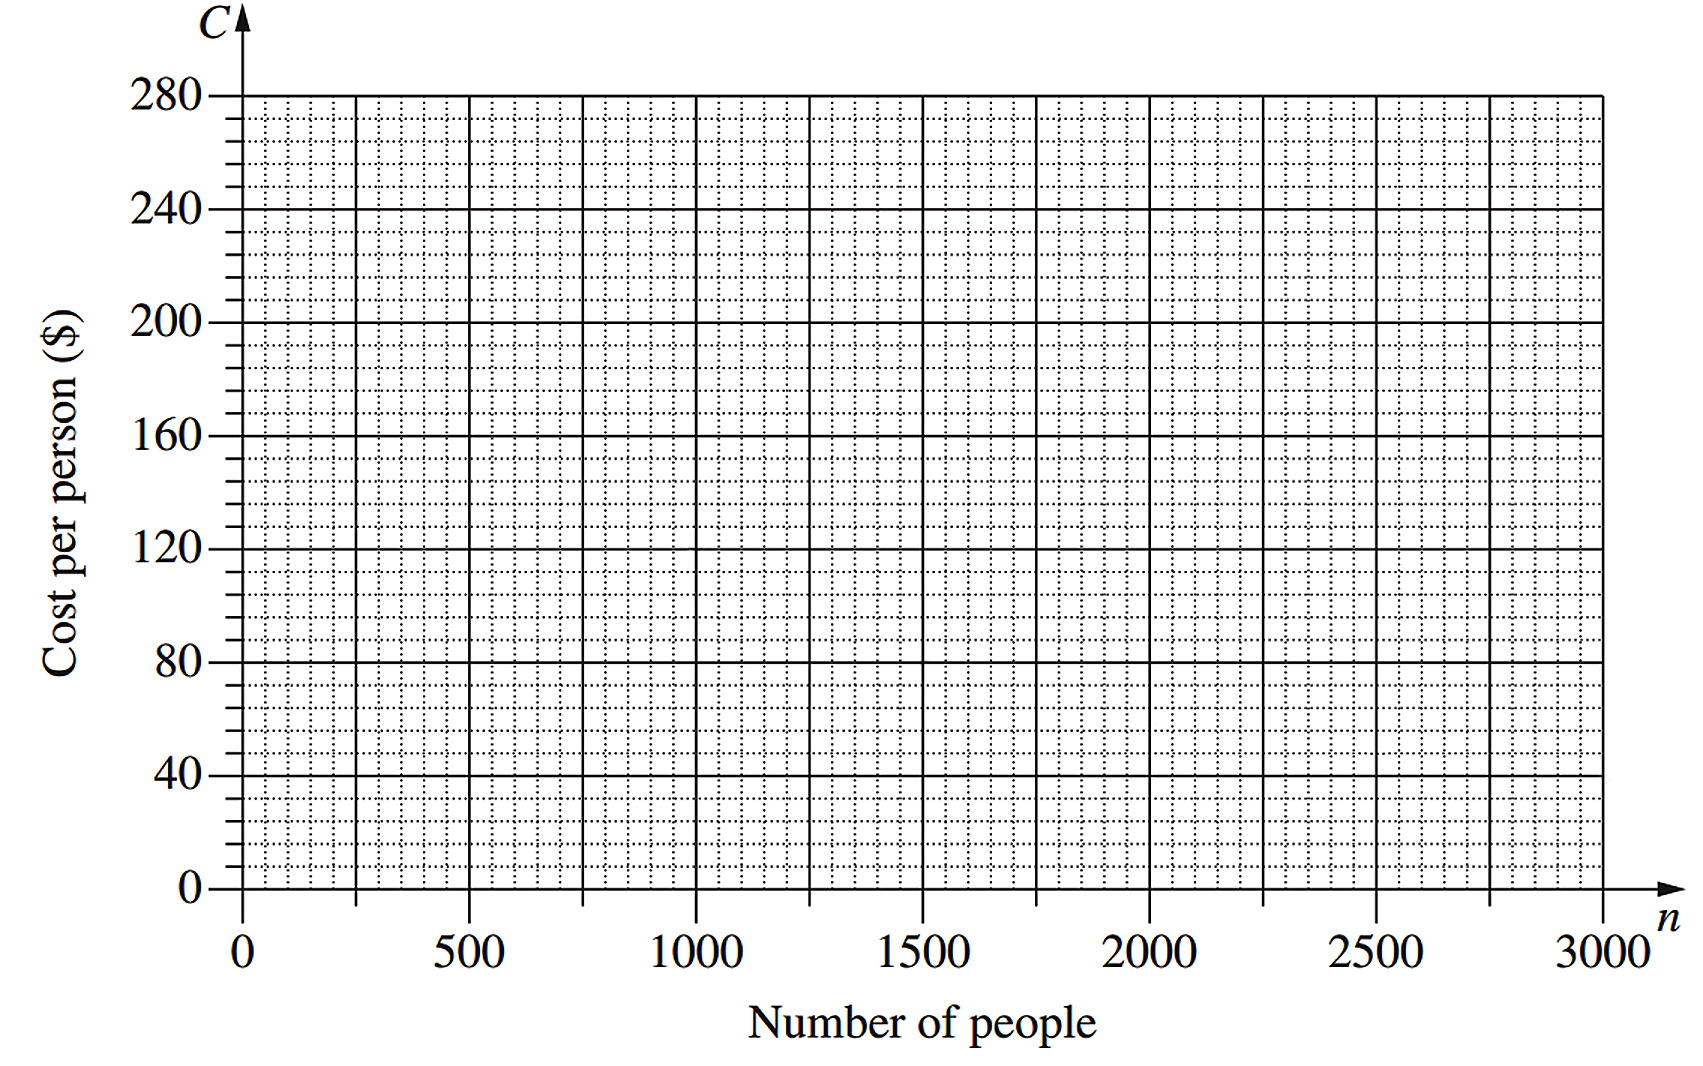
The cost of hiring an open space for a music festival is $120 000. The cost will be shared equally by the people attending the festival, so that `C` (in dollars) is the cost per person when `n` people attend the festival.
--- 1 WORK AREA LINES (style=lined) ---
--- 2 WORK AREA LINES (style=lined) ---
--- 2 WORK AREA LINES (style=lined) ---
i.
\begin{array} {|l|c|c|c|c|c|c|}
\hline
\rule{0pt}{2.5ex}\text{Number of people} (n) \rule[-1ex]{0pt}{0pt} & \ 500\ & \ 1000 \ & 1500 \ & 2000 \ & 2500\ & 3000 \ \\
\hline
\rule{0pt}{2.5ex}\text{Cost per person} (C)\rule[-1ex]{0pt}{0pt} & 240 & 120 & 80 & 60 & 48\ & 40 \ \\
\hline
\end{array}
| ii. |  |
iii. `C = (120\ 000)/n`
`n\ text(must be a whole number)`
iv. `text(Limitations can include:)`
`•\ n\ text(must be a whole number)`
`•\ C > 0`
v. `text(If)\ C = 94:`
| `94` | `= (120\ 000)/n` |
| `94n` | `= 120\ 000` |
| `n` | `= (120\ 000)/94` |
| `= 1276.595…` |
`:.\ text(C)text(ost cannot be $94 per person,)`
`text(because)\ n\ text(isn’t a whole number.)`
i.
\begin{array} {|l|c|c|c|c|c|c|}
\hline
\rule{0pt}{2.5ex}\text{Number of people} (n) \rule[-1ex]{0pt}{0pt} & \ 500\ & \ 1000 \ & 1500 \ & 2000 \ & 2500\ & 3000 \ \\
\hline
\rule{0pt}{2.5ex}\text{Cost per person} (C)\rule[-1ex]{0pt}{0pt} & 240 & 120 & 80 & 60 & 48\ & 40 \ \\
\hline
\end{array}
| ii. | |
iii. `C = (120\ 000)/n`
iv. `text(Limitations can include:)`
`•\ n\ text(must be a whole number)`
`•\ C > 0`
v. `text(If)\ C = 94`
| `=> 94` | `= (120\ 000)/n` |
| `94n` | `= 120\ 000` |
| `n` | `= (120\ 000)/94` |
| `= 1276.595…` |
`:.\ text(C)text(ost cannot be $94 per person,)`
`text(because)\ n\ text(isn’t a whole number.)`
The diagram shows the graph of an equation.

Which of the following equations does the graph best represent?
Write down the equation of the circle with centre `(-1, 2)` and radius 5. (1 mark)
A golf ball is hit from point `A` to point `B`, which is on the ground as shown. Point `A` is 30 metres above the ground and the horizontal distance from point `A` to point `B` is 300 m.

The path of the golf ball is modelled using the equation
`h = 30 + 0.2d-0.001d^2`
where
`h` is the height of the golf ball above the ground in metres, and
`d` is the horizontal distance of the golf ball from point `A` in metres.
The graph of this equation is drawn below.

--- 1 WORK AREA LINES (style=lined) ---
What horizontal distance does the ball travel in the period between these two occasions? (1 mark)
--- 2 WORK AREA LINES (style=lined) ---
--- 2 WORK AREA LINES (style=lined) ---
Find all values of `d` that are not suitable to use with this model, and explain why these values are not suitable. (2 marks)
--- 4 WORK AREA LINES (style=lined) ---
Which of the following graphs best represents the equation `y = a^x`, where `a` is a positive number greater than 1?


