Simplify `2/n-1/(n+1)`. (2 marks)
--- 4 WORK AREA LINES (style=lined) ---
Aussie Maths & Science Teachers: Save your time with SmarterEd
Simplify `2/n-1/(n+1)`. (2 marks)
--- 4 WORK AREA LINES (style=lined) ---
Which of the following best represents the graph of \(y = 5 (0.4)^{x}\) ?

Lucas invests $5000.
Interest is compounded half-yearly at a rate of 3% per half-year.

Use the table to calculate the value of his investment at the end of 4 years. (2 marks)
--- 4 WORK AREA LINES (style=lined) ---
Jordan wants to accumulate $15 000 in a savings account over 10 years to buy a new car.
The account pays interest at 4% per annum compounded monthly.
Calculate how much Jordan must deposit now to achieve this goal. (3 marks)
--- 6 WORK AREA LINES (style=lined) ---
A laptop currently costs $850.
Assuming a constant annual inflation rate of 3.2%, calculate the cost of the same laptop in 4 years’ time. (2 marks)
The table shows the compounded values of $1 at different interest rates over different periods.

Ben hopes to have $18 000 in 2 years to travel. He opens an account today which pays interest of 4% p.a., compounded quarterly.
Using the table, which expression calculates the minimum single sum that Ben needs to invest today to ensure he reaches his savings goal?
Daniel’s funds in a retirement account are projected to have a future value of $600 000 in 15 years’ time. The interest rate is 5% per annum, with earnings calculated six-monthly.
What single amount could be invested now to produce the same result over the same period of time at the same interest rate? (3 marks)
In eight years, the future value of an investment will be $120 000. The interest rate is 6% per annum, compounded half-yearly.
Which equation will give the present value `(PV)` of the investment?
The table shows the future value of an investment of $1000, compounding yearly, at varying interest rates for different periods of time.

Based on the information provided, what is the future value of an investment of $3500 over 5 years at 2% pa?
Find the reciprocal of `1/(xy) + 1/y-z/x`. (2 marks)
Find the reciprocal of `r/p-1/(pq) + 1/q`. (2 marks)
Solve `(x+4)/5-(x-2)/6 = 4`. (2 marks)
What is the gradient of the line \(6x+7y-1 = 0\)?
A survey of 370 people was conducted to investigate the association between watching Anime and the age of the person.
The two-way table shows the responses collected.

Approximately what percentage of the over 30-year-olds watch Anime?
Sketch the graph of \(y+\dfrac{x}{3} = 2\), showing the intercepts on both axes. (2 marks)
--- 8 WORK AREA LINES (style=blank) ---

What is the slope of the line with equation `2x-4y + 3 = 0`?
What is the gradient of the line \(4x-5y-2 = 0\)?
The diagram shows a shape `APQBCD`. The shape consists of a rectangle `ABCD` with an arc `PQ` on side `AB` and with side lengths `BC` = 3.6 m and `CD` = 8.0 m.
The arc `PQ` is an arc of a circle with centre `O` and radius 2.1 m and `∠POQ=110°`.

What is the perimeter of the shape `APQBCD`? Give your answer correct to one decimal place. (4 marks)
--- 8 WORK AREA LINES (style=lined) ---
| `text{Arc}\ PQ` | `=110/360 xx pi xx 2 xx 2.1` | |
| `=4.03171… \ text{m}` |
`text{Consider}\ ΔOPQ:`

| `sin 55^@` | `=x/2.1` | |
| `x` | `=2.1 xx sin 55^@` | |
| `=1.7202…` |
`PQ=2x=3.440\ text{m}`
| `:.\ text{Perimeter}` | `=8+(2xx3.6)+4.031+(8-3.440)` | |
| `=23.79…\ text{m}` | ||
| `=23.8\ text{m (to 1 d.p.)}` |
The diagram shows a shape `APQBCD`. The shape consists of a rectangle `ABCD` with an arc `PQ` on side `AB` and with side lengths `BC` = 3.6 m and `CD` = 8.0 m.
The arc `PQ` is an arc of a circle with centre `O` and radius 2.1 m and `∠POQ=110°`.
What is the perimeter of the shape `APQBCD`? Give your answer correct to one decimal place. (4 marks)
--- 8 WORK AREA LINES (style=lined) ---
| `text{Arc}\ PQ` | `=110/360 xx pi xx 2.1^2` | |
| `=4.03171… \ text{m}` |
`text{Consider}\ ΔOPQ:`
| `sin 55^@` | `=x/2.1` | |
| `x` | `=2.1 xx sin 55^@` | |
| `=1.7202…` |
`PQ=2x=3.440\ text{m}`
| `:.\ text{Perimeter}` | `=8+(2xx3.6)+4.031+(8-3.440)` | |
| `=23.79…` | ||
| `=23.8\ text{m (to 1 d.p.)}` |
The number of bees leaving a hive was observed and recorded over 14 days at different times of the day.

Which Pearson's correlation coefficient best describes the observations?
A student believes that the time it takes for an ice cube to melt (`M` minutes) varies inversely with the room temperature `(T^@ text{C})`. The student observes that at a room temperature of `15^@text{C}` it takes 12 minutes for an ice cube to melt.
--- 2 WORK AREA LINES (style=lined) ---
\begin{array} {|c|c|c|c|}
\hline \ \ T\ \ & \ \ 5\ \ & \ 15\ & \ 30\ \\
\hline M & & & \\
\hline \end{array}

--- 0 WORK AREA LINES (style=lined) ---
a. `M=180/T`
b.
\begin{array} {|c|c|c|c|}
\hline \ \ T\ \ & \ \ 5\ \ & \ 15\ & \ 30\ \\
\hline M & 36 & 12 & 6 \\
\hline \end{array}

| a. | `M` | `prop 1/T` |
| `M` | `=k/T` | |
| `12` | `=k/15` | |
| `k` | `=15 xx 12` | |
| `=180` |
`:.M=180/T`
b.
\begin{array} {|c|c|c|c|}
\hline \ \ T\ \ & \ \ 5\ \ & \ 15\ & \ 30\ \\
\hline M & 36 & 12 & 6 \\
\hline \end{array}
The life span of batteries from a particular factory is normally distributed with a mean of 840 hours and a standard deviation of 80 hours.
It is known from statistical tables that for this distribution approximately 60% of the batteries have a life span of less than 860 hours.
What is the approximate percentage of batteries with a life span between 820 and 920 hours? (3 marks)
--- 6 WORK AREA LINES (style=lined) ---
`mu=840, \ sigma=80`
`ztext{-score (860)}\ = (x-mu)/sigma=(860-840)/80=0.25`
`ztext{-score (820)}\ =(820-840)/80=-0.25`
`ztext{-score (920)}\ =(920-840)/80=1`

`text{50% of batteries have a life span below 840 hours (by definintion)}`
`=>\ text{10% lie between 840 and 860 hours}`
`=>\ text{By symmetry, 10% lie between 820 and 840 hours}`
`=> P(-0.25<=z<=0)=10text{%}`
`:.\ text{Percentage between 820 and 920}`
`=P(-0.25<=z<=1)`
`=P(-0.25<=z<=0) + P(0<=z<=1)`
`=10+34`
`=44text{%}`
Jo is researching the relationship between the ages of teenage characters in television series and the ages of actors playing these characters.
After collecting the data, Jo finds that the correlation coefficient is 0.4564.
A scatterplot showing the data is drawn. The line of best fit with equation `y=-7.51+1.85 x`, is also drawn.

Describe and interpret the data and other information provided, with reference to the context given. (4 marks)
--- 8 WORK AREA LINES (style=lined) ---
Eli is choosing between two investment options.

A table of future value interest factors for an annuity of $1 is shown.

--- 4 WORK AREA LINES (style=lined) ---
--- 4 WORK AREA LINES (style=lined) ---
Which of the following could be the graph of `y= -2 x+2`?


The life span of batteries from a particular factory is normally distributed with a mean of 840 hours and a standard deviation of 80 hours.
It is known from statistical tables that for this distribution approximately 60% of the batteries have a life span of less than 860 hours.
What is the approximate percentage of batteries with a life span between 820 and 920 hours? (3 marks)
--- 6 WORK AREA LINES (style=lined) ---
`mu=840, \ sigma=80`
`ztext{-score (860)}\ = (x-mu)/sigma=(860-840)/80=0.25`
`ztext{-score (820)}\ =(820-840)/80=-0.25`
`ztext{-score (920)}\ =(920-840)/80=1`
`text{50% of batteries have a life span below 840 hours (by definition)}`
`=>\ text{10% lie between 840 and 860 hours}`
`=>\ text{By symmetry, 10% lie between 820 and 840 hours}`
`=> P(-0.25<=z<=0)=10text{%}`
`:.\ text{Percentage between 820 and 920}`
`=P(-0.25<=z<=1)`
`=P(-0.25<=z<=0) + P(0<=z<=1)`
`=10+34`
`=44text{%}`
Jo is researching the relationship between the ages of teenage characters in television series and the ages of actors playing these characters.
After collecting the data, Jo finds that the correlation coefficient is 0.4564.
A scatterplot showing the data is drawn. The line of best fit with equation `y=-7.51+1.85 x`, is also drawn.
Describe and interpret the data and other information provided, with reference to the context given. (4 marks)
--- 8 WORK AREA LINES (style=lined) ---
A teacher surveyed the students in her Year 8 class to investigate the relationship between the average number of hours of phone use per day and the average number of hours of sleep per day.
The results are shown on the scatterplot below.


--- 4 WORK AREA LINES (style=lined) ---

a.
b. `text{9 hours (see LOBF in diagram above)}`
Eli is choosing between two investment options.
A table of future value interest factors for an annuity of $1 is shown.
--- 4 WORK AREA LINES (style=lined) ---
--- 4 WORK AREA LINES (style=lined) ---
The table shows the future value of an annuity of $1.

Zal is saving for a trip and estimates he will need $15 000. He opens an account earning 3% per annum, compounded annually.
--- 4 WORK AREA LINES (style=lined) ---
--- 4 WORK AREA LINES (style=lined) ---
The table shows the types of customer complaints received by an online business in a month.

--- 4 WORK AREA LINES (style=lined) ---

--- 2 WORK AREA LINES (style=lined) ---
The marks in a test were normally distributed. The mean mark was 60 and the standard deviation was 15 .
What was the percentage of marks higher than 90? (2 marks)
--- 4 WORK AREA LINES (style=lined) ---
| `ztext{-score}` | `=(x-mu)/sigma` | |
| `=(90-60)/15` | ||
| `=2` |

`text{% marks > 90}\ = 2.5text{%}`
The cumulative frequency graph shows the distribution of the number of movie downloads made by 100 people in one month.

Which box-plot best represents the same data as displayed in the cumulative frequency graph?


`text{1st quartile}\ ~~ 3`
`text{Median}\ ~~ 6`
`text{3rd quartile}\ ~~ 7`
`=>C`
For a particular course, the recorded data show a relationship between the number of hours of study per week and the marks achieved out of 100 .
A least-squares regression line is fitted to this dataset. The equation of this line is given by
`M=20+3 H,`
where `M` is the predicted mark and `H` is the number of hours of study per week.
Based on this regression equation, which of the following is correct regarding the predicted mark of a student?
In ten years, the future value of an investment will be $150 000. The interest rate is 4% per annum, compounded half-yearly.
Which equation will give the present value `(PV)` of the investment?
Which true bearing is the same as `text{S} 48^@ text{W}`?

| `text{True bearing}` | `=180 + 48` |
| `=228^@` |
`=>C`
Consider the following dataset.
`{:[13,16,17,17,21,24]:}`
Which row of the table shows how the median and mean are affected when a score of 5 is added to the dataset?

Which of the following could be the graph of `y=-2 x+2`?
800 participants auditioned for a stage musical. Each participant was required to complete a series of ability tests for which they received an overall score.
The overall scores were approximately normally distributed with a mean score of 69.5 points and a standard deviation of 6.5 points.
Only the participants who scored at least 76.0 points in the audition were considered successful.
How many of the participants were considered unsuccessful? (2 marks)
The stem plot below shows the height, in centimetres, of 20 players in a junior football team.

A player with a height of 179 cm is considered an outlier because 179 cm is greater than
The stem plot below shows the height, in centimetres, of 20 players in a junior football team.
A player with a height of 179 cm is considered an outlier because 179 cm is greater than
In a particular city, the heights of adult females and the heights of adult males are each normally distributed.
Information relating to two females from that city is given in Table 1.

The means and standard deviations of adult females and males, in centimetres, are given in Table 2.

A selected male is taller than 84% of the population of adult males in this city.
By first labelling the normal distribution curve below with the heights of the two females given in Table 1, calculate the height of the selected male, in centimetres, correct to two decimal places. (4 marks)

--- 6 WORK AREA LINES (style=lined) ---

`178.95 \ text{cm}`
`z text{-score (175 cm, female)} = 2`
`z text{-score (160.6 cm, female)} = -1`
`text{Find} \ mu \ text{of female heights:}`
| `mu – sigma` | `= 160.6` | |
| `mu + 2sigma` | `= 175` | |
| `3 sigma` | `= 175 – 160.6` | |
| `sigma` | `= 14.4/3` | |
| `= 4.8 \ text{cm}` | ||
| `:. \ mu` | `= 165.4 \ text{cm}` |
`text{Selected male’s height has} \ z text{-score} = 1`
`mu text{(male)} = 1.05 times 165.4 = 173.67`
`sigma \ text{(male)} = 1.1 times 4.8 = 5.28`
| `:. \ text{Actual male height}` | `= 173.67 + 5.28` | |
| `= 178.95 \ text{cm}` |
For a sample of 17 inland towns in Australia, the height above sea level, `x` (metres), and the average maximum daily temperature, `y` (°C), were recorded.
The graph shows the data as well as a regression line.

The equation of the regression line is `y = 29.2 − 0.011x`.
The correlation coefficient is `r = –0.494`.
--- 1 WORK AREA LINES (style=lined) ---
--- 5 WORK AREA LINES (style=lined) ---

--- 3 WORK AREA LINES (style=lined) ---
For a sample of 17 inland towns in Australia, the height above sea level, `x` (metres), and the average maximum daily temperature, `y` (°C), were recorded.
The graph shows the data as well as a regression line.
The equation of the regression line is `y = 29.2 − 0.011x`.
The correlation coefficient is `r = –0.494`.
--- 1 WORK AREA LINES (style=lined) ---
--- 4 WORK AREA LINES (style=lined) ---
--- 2 WORK AREA LINES (style=lined) ---
Present value interest factors for an annuity of $1 for various interest rates (`r`) and numbers of periods (`N`) are given in the table.

A bank lends Martina $500 000 to purchase a home, with interest charged at 1.5% per annum compounding monthly. She agrees to repay the loan by making equal monthly repayments over a 30-year period.
How much should the monthly payment be in order to pay off the loan in 30 years?
Give your answer correct to the nearest cent. (2 marks)
The diagram shows a triangle `ABC` where `AC` = 25 cm, `BC` = 16 cm, `angle BAC` = 28° and angle `ABC` is obtuse.
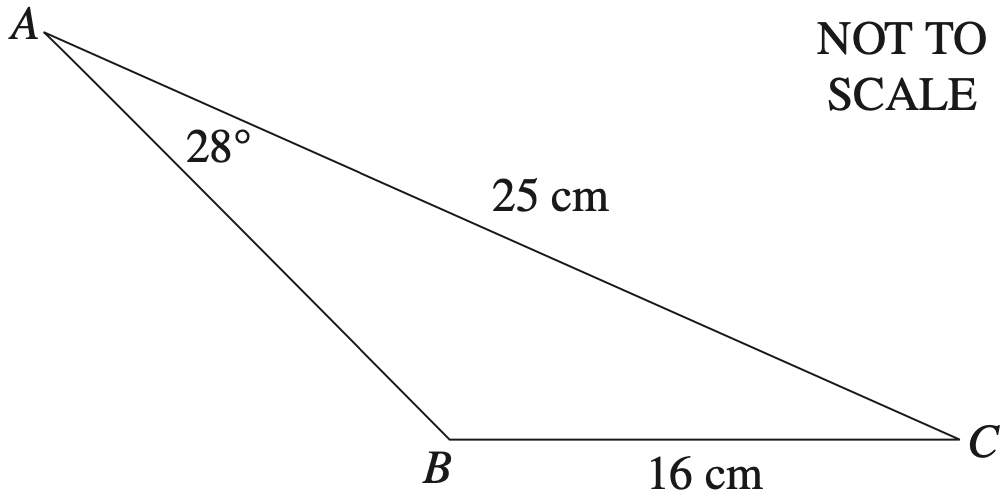
Find the size of the obtuse angle `ABC` correct to the nearest degree. (3 marks)
--- 6 WORK AREA LINES (style=lined) ---
A table of future value interest factors for an annuity of $1 is shown.

Simone deposits $1000 into a savings account at the end of each year for 8 years. The interest rate for these 8 years is 0.75% per annum, compounded annually.
After the 8th deposit, Simone stops making deposits but leaves the money in the savings account. The money in her savings account then earns interest at 1.25% per annum, compounded annually, for a further two years.
Find the amount of money in Simone's savings account at the end of ten years. (3 marks)
A table of future value interest factors for an annuity of $1 is shown.
Simone deposits $1000 into a savings account at the end of each year for 8 years. The interest rate for these 8 years is 0.75% per annum, compounded annually.
After the 8th deposit, Simone stops making deposits but leaves the money in the savings account. The money in her savings account then earns interest at 1.25% per annum, compounded annually, for a further two years.
Find the amount of money in Simone's savings account at the end of ten years. (3 marks)
A random variable is normally distributed with mean 0 and standard deviation 1. The table gives the probability that this random variable lies between 0 and `z` for different values of `z`.
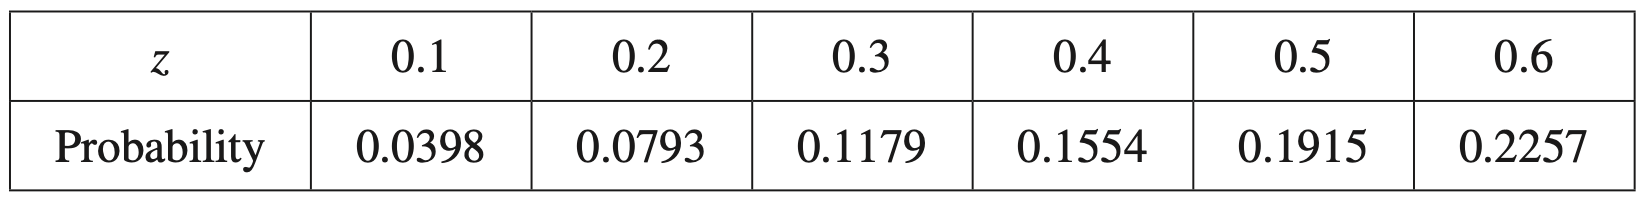
The probability values given in the table for different values of `z` are represented by the shaded area in the following diagram.

--- 1 WORK AREA LINES (style=lined) ---
--- 6 WORK AREA LINES (style=lined) ---
The diagram shows a triangle `ABC` where `AC` = 25 cm, `BC` = 16 cm, `angle BAC` = 28° and angle `ABC` is obtuse.
Find the size of the obtuse angle `ABC` correct to the nearest degree. (3 marks)
--- 6 WORK AREA LINES (style=lined) ---
A random variable is normally distributed with mean 0 and standard deviation 1. The table gives the probability that this random variable lies between 0 and `z` for different values of `z`.

The probability values given in the table for different values of `z` are represented by the shaded area in the following diagram.
--- 1 WORK AREA LINES (style=lined) ---
--- 6 WORK AREA LINES (style=lined) ---
A salesperson is interested in the relationship between the number of bottles of lemonade sold per day and the number of hours of sunshine on the day.
The diagram shows the dataset used in the investigation and the least-squares regression line.

--- 4 WORK AREA LINES (style=lined) ---
--- 2 WORK AREA LINES (style=lined) ---
Consider the diagram below.

What is the true bearing of `A` from `B`?

| `\text{Bearing (A from B)}` | `= 270 + 25` |
| `= 295^@` |
Julie invests $12 500 in a savings account. Interest is paid at a fixed monthly rate. At the end of each month, after the monthly interest is added, Julie makes a deposit of $500.
Julie has created a spreadsheet to show the activity in her savings account. The details for the first 6 months are shown.

By finding the monthly rate of interest, complete the final row above for the 7th month. (3 marks)
--- 6 WORK AREA LINES (style=lined) ---
Solve `x+(x-1)/2 = 9`. (2 marks)
There are 8 chocolates in a box. Three have peppermint centres (P) and five have caramel centres (C).
Kim randomly chooses a chocolate from the box and eats it. Sam then randomly chooses and eats one of the remaining chocolates.
A partially completed probability tree is shown.

What is the probability that Kim and Sam choose chocolates with different centres?

| `Ptext{(different centres)}` | `= P text{(PC)} + P text{(CP)}` |
| `=\frac{3}{8} · \frac{5}{7} + \frac{5}{8} · \frac{3}{7}` | |
| `= \frac{15}{56} + \frac{15}{56}` | |
| `= \frac{15}{28}` |
`=> D`
There are 8 chocolates in a box. Three have peppermint centres (P) and five have caramel centres (C).
Kim randomly chooses a chocolate from the box and eats it. Sam then randomly chooses and eats one of the remaining chocolates.
A partially completed probability tree is shown.
What is the probability that Kim and Sam choose chocolates with different centres?
| `Ptext{(different centres)}` | `= P text{(PC)} + P text{(CP)}` |
| `=\frac{3}{8} · \frac{5}{7} + \frac{5}{8} · \frac{3}{7}` | |
| `= \frac{15}{56} + \frac{15}{56}` | |
| `= \frac{15}{28}` |
`=> D`
Which of the following best represents the graph of `y = 10 (0.8)^x`?

Which of the following best represents the graph of `y = 10 (0.8)^x`?
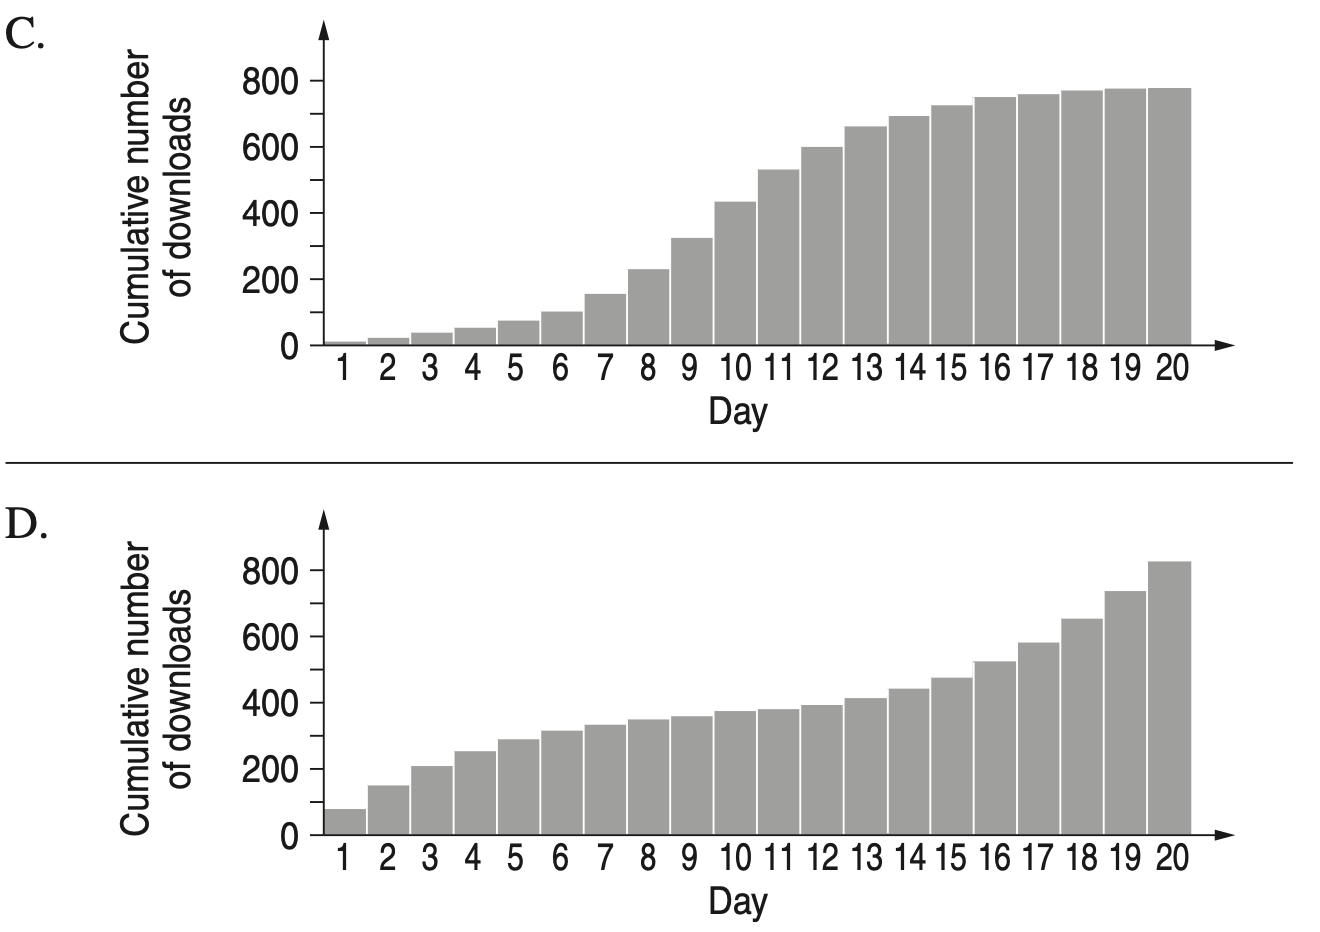
The number of downloads of a song on each of twenty consecutive days is shown in the following graph.

Which of the following graphs best shows the cumulative number of downloads up to and including each day?
