SmarterEd

Aussie Maths & Science Teachers: Save your time with SmarterEd

  • Login
  • Get Help
  • About

Functions, 2ADV F1 2017 HSC 1 MC (Adapted)

What is the gradient of the line \(4x-5y-2 = 0\)?

  1. \(-\dfrac{4}{5}\)
  2. \(\dfrac{4}{5}\)
  3. \(\dfrac{5}{4}\)
  4. \(-\dfrac{5}{4}\)
Show Answers Only

\(B\)

Show Worked Solution
\(4x-5y-2\) \(=0\)  
\(-5y\) \(=-4x + 2\)  
\(y\) \(=\dfrac{4}{5}x-\dfrac{2}{5}\)  

 
\(\Rightarrow B\)

Filed Under: Linear Equations and Basic Graphs (Std 2-X) Tagged With: adapted, Band 3, common-content, num-title-ct-pathc, num-title-qs-hsc, smc-4422-20-Gradient, smc-4422-50-General form, smc-792-10-Gradient, smc-985-30-Coordinate Geometry

Algebra, STD2 A1 2010 HSC 18 MC v1

Which of the following correctly express  \(h\)  as the subject of  \(A=\dfrac{bh}{2}\) ?

  1. \(h=\dfrac{A-2}{b}\)
  2. \(h=2A-b\)
  3. \(h=\dfrac{2A}{b}\)
  4. \(h=\dfrac{Ab}{2}\)
Show Answers Only

\(C\)

Show Worked Solution
\(A\) \(=\dfrac{bh}{2}\)
\(bh\) \(=2A\)
\(\therefore\ h\) \(=\dfrac{2A}{b}\)

 
\(\Rightarrow C\)

Filed Under: Formula Rearrange (Std 2-X) Tagged With: Band 4, eo-derivative (HSC), num-title-ct-pathc, num-title-qs-hsc, smc-1200-10-Linear, smc-1201-10-Linear, smc-4362-20-Formula rearrange

Statistics, STD1 S3 2023 HSC 19

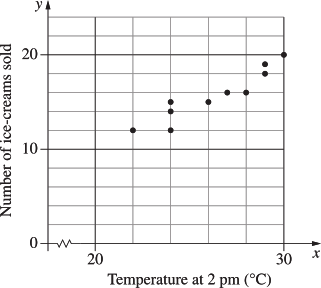
The scatterplot shows the number of ice-creams sold,  \(y\), at a shop over a ten-day period, and the temperature recorded at 2 pm on each of these days.
 

  1. The data are modelled by the equation of the line of best fit given below.

\(y=0.936 x-8.929\), where \(x\) is the temperature.

  1. Sam used a particular temperature with this equation and predicted that 23 ice-creams would be sold.
  2. What was the temperature used by Sam, to the nearest degree?   (2 marks)

    --- 4 WORK AREA LINES (style=lined) ---

  3. In using the equation to make the prediction in part (a), was Sam interpolating or extrapolating? Justify your answer.   (2 marks)

    --- 3 WORK AREA LINES (style=lined) ---
Show Answers Only

a.    \(34^{\circ}\text{ (nearest degree)}\)

b.    \(\text{See worked solutions}\)

Show Worked Solution

a.             \(y\) \(=0.936x-8.929\)
\(23\) \(=0.936x-8.929\)
\(0.936x\) \(=23+8.929\)
\(x\) \(=\dfrac{31.921}{0.936}\)
  \(=34.112\ldots ^{\circ}\)
  \(= 34^{\circ}\text{ (nearest degree)}\)

♦♦ Mean mark (a) 31%.

b.     \(\text{Sam is extrapolating as 34°C is outside the range of data}\)

\(\text{points shown on the graph (i.e. temp between 0 and 30°C).}\)


♦♦ Mean mark (b) 33%.

Filed Under: Bivariate Data, Bivariate Data Analysis (Y12), S3 Further Statistical Analysis (Y12) Tagged With: Band 5, num-title-ct-coreb, num-title-qs-hsc, smc-1113-10-Line of Best Fit, smc-5022-10-Line of best fit graphs, smc-5022-28-LOBF equations, smc-5022-70-Inter/extrapolating, smc-6884-10-Lines of Best Fit

Probability, STD1 S2 2023 HSC 8 MC

Four cards marked with the numbers 1, 2, 3 and 4 are placed face down on a table.

One card is turned over as shown.

What is the probability that the next card turned over is marked with an odd number?

  1. \(\dfrac{1}{4}\)
  2. \(\dfrac{1}{3}\)
  3. \(\dfrac{2}{4}\)
  4. \(\dfrac{2}{3}\)
Show Answers Only

\(D\)

Show Worked Solution

\(\text{Sample space} =1,3,4\)

\(P(\text{odd})=\dfrac{2}{3}\)

  
\(\Rightarrow D\)

Filed Under: Probability, Single and Multi-Stage Events, Single and Multi-Stage Events Tagged With: Band 4, num-title-ct-core, num-title-qs-hsc, smc-1135-05-Simple Probability, smc-4225-15-Single-stage events, smc-6887-20-Simple Probability

Measurement, STD2 M6 2023 HSC 35

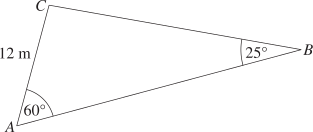
The diagram shows triangle `ABC`.
 

Calculate the area of the triangle, to the nearest square metre.   (3 marks)

--- 6 WORK AREA LINES (style=lined) ---

Show Answers Only

`147\ text{m}^2`

Show Worked Solution

`text{Using the sine rule:}`

`(CB)/sin60^@` `=12/sin25^@`
`CB` `=sin60^@ xx 12/sin25^@`
  `=24.590…`

 
`angleACB=180-(60+25)=95^@\ \ text{(180° in Δ)}`
 

`text{Using the sine area rule:}`

`A` `=1/2 xx AC xx CB xx sin angleACB`
  `=1/2 xx 12 xx 24.59 xx sin95^@`
  `=146.98…`
  `=147\ text{m}^2`

Filed Under: Non Right-Angled Trig, Non-Right Angled Trig, Non-right-angled Trig Tagged With: Band 4, num-title-ct-pathc, num-title-qs-hsc, smc-4553-30-Sine Rule (Area), smc-6929-20-Sine Rule, smc-6929-30-Sine Rule (Area), smc-6929-40-2-Triangle, smc-804-20-Sine Rule, smc-804-30-Sine Rule (Area)

L&E, 2ADV E1 2008 HSC 7a

Solve  `log_2 x-3/log_2 x=2`   (3 marks)

--- 6 WORK AREA LINES (style=lined) ---

Show Answers Only

`x=8\ \ text(or)\ \ 1/2`

Show Worked Solution
 
IMPORTANT: Students should recognise this equation as a quadratic, and the best responses substituted `log_2 x` with a variable such as `X`.
`log_2 x-3/(log_2 x)` `=2`
`(log_2 x)^2-3` `=2log_2 x`
`(log_2 x)^2-2log_2 x-3` `=0`
   
`text(Let)\  X=log_2 x`  
`:.\ X^2-2X-3` `=0`
`(X-3)(X+1)` `=0`
MARKER’S COMMENT: Many responses incorrectly stated that there is no solution to `log_2 x=-1` or could not find `x` given `log_2 x=3`.
`X` `=3` `\ \ \ \ \ \ \ \ \ \ ` `X` `=-1`
`log_2 x` `=3` `\ \ \ \ \ \ \ \ \ \ ` `log_2 x` `=-1`
`x` `=2^3=8` `\ \ \ \ \ \ \ \ \ \ ` `x` `=2^{-1}=1/2`


`:.x=8\ \ text(or)\ \ 1/2`

Filed Under: Logarithms Tagged With: num-title-ct-patha, num-title-qs-hsc, smc-4243-60-Quadratic

Measurement, STD2 M1 2009 HSC 25b

The mass of a sample of microbes is 50 mg. There are approximately  `2.5 × 10^6` microbes in the sample.

In scientific notation, what is the approximate mass in grams of one microbe?   (2 marks)

--- 4 WORK AREA LINES (style=lined) ---

Show Answers Only

`2 xx 10^-8\ text(grams)`

Show Worked Solution
♦♦♦ Mean mark 20%.
IMPORTANT: Can you solve: 8 apples weigh 1kg, what does 1 apple weigh? This is exactly the same concept.
`text(We need to convert 50 mg into grams)`
`50\ text(mg) = 50/1000 = 0.05\ text(g) = 5 xx 10^-2\ text(grams)`


`:.\ text(Mass of 1 microbe)` `= text(mass of sample)/text(# microbes)`
  `= (5 xx 10^-2)/(2.5 xx 10^6)`
  `= 2 xx 10^-8\ text(grams)`

Filed Under: Numbers of Any Magnitude Tagged With: num-title-ct-corea, num-title-qs-hsc, smc-4232-30-Scientific notation, smc-4232-60-Unit conversion

Quadratics, SMB-015

The diagram shows the curve with equation  `y = x^2-7x + 10`. The curve intersects the `x`-axis at points `A and B`. The point `C` on the curve has the same `y`-coordinate as the `y`-intercept of the curve.
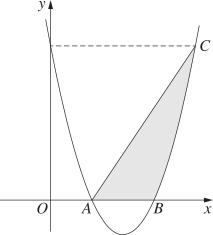


  1. Find the `x`-coordinates of points `A and B.`  (2 marks)

    --- 4 WORK AREA LINES (style=lined) ---

  2. Write down the coordinates of `C.`  (2 marks)

    --- 4 WORK AREA LINES (style=lined) ---

Show Answers Only
  1. `A = 2,\ \ B = 5`
  2. `(7, 10)`
Show Worked Solution
i.    `y` `= x^2-7x + 10`
  `= (x-2) (x-5)`

 
`:.x = 2 or 5`

`:.\ \ x text(-coordinate of)\ \ A = 2`

`x text(-coordinate of)\ \ B = 5`


ii.    `y\ text(intercept occurs when)\ \ x = 0`

`=>y text(-intercept) = 10`
 

`C\ text(occurs at intercept:)`

`y` `= x^2-7x + 10` `\ \ \ \ \ text{…  (1)}`
`y` `= 10` `\ \ \ \ \ text{…  (2)}`

 
`(1) = (2)`

`x^2-7x + 10` `= 10`
`x^2-7x` `= 10`
`x (x-7)` `= 10`

 
`x = 0 or 7`

`:.\ C\ \ text(is)\ \ (7, 10)`

Filed Under: Quadratics Tagged With: num-title-ct-pathc, num-title-qs-hsc, smc-4443-55-Intersections

Algebra, STD1 A3 2019 HSC 9 MC

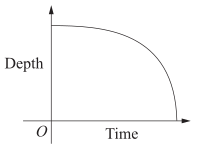
The container shown is initially full of water.
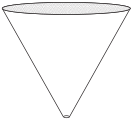
 

Water leaks out of the bottom of the container at a constant rate.

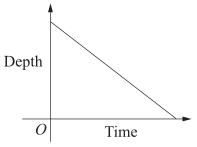
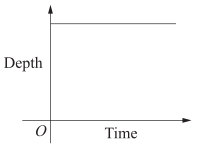
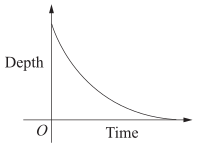
Which graph best shows the depth of water in the container as time varies?
 

A. B.
C. D.
Show Answers Only

`D`

Show Worked Solution

`text(Depth will decrease slowly at first and accelerate.)`

`=> D`

Filed Under: Non-Linear: Inverse and Other Problems, Quadratics, Variation and Rates of Change Tagged With: Band 5, num-title-ct-pathb, num-title-qs-hsc, smc-4239-60-Variable rates of change, smc-795-20-Other Relationship

Algebra, STD1 A1 2019 HSC 34

Given the formula  `C = (A(y + 1))/24`, calculate the value of  `y`  when  `C = 120`  and  `A = 500`.   (3 marks)

--- 6 WORK AREA LINES (style=lined) ---

Show Answers Only

`4.76`

Show Worked Solution

`text(Make)\ \ y\ \ text(the subject:)`

`C` `= (A(y + 1))/24`
`24C` `= A(y + 1)`
`y + 1` `= (24C)/A`
`y` `= (24C)/A-1`
  `= (24 xx 120)/500-1`
  `= 4.76`

Filed Under: Formula Rearrange, Formula Rearrange, Linear, Substitution and Other Equations, Substitution and Other Equations Tagged With: Band 4, num-title-ct-corea, num-title-qs-hsc, smc-1200-10-Linear, smc-4362-30-Rearrange and substitute, smc-6234-20-Rearrange and Substitute, smc-6236-10-Linear, smc-789-20-Rearrange and Substitute, std2-std1-common

Statistics, STD1 S3 2022 HSC 23

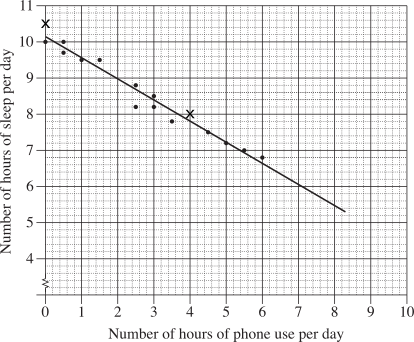
A teacher surveyed the students in her Year 8 class to investigate the relationship between the average number of hours of phone use per day and the average number of hours of sleep per day.

The results are shown on the scatterplot below.
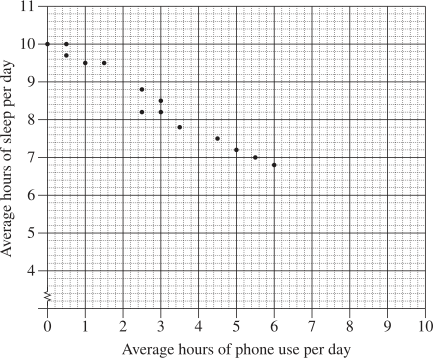
 

  1. The data for two new students, Alinta and Birrani, are shown in the table below. Plot their results on the scatterplot.  (2 marks)

\begin{array} {|l|c|c|}
\hline
  & \textit{Average hours of} & \textit{Average hours of} \\ & \textit{phone use per day} & \textit{sleep per day} \\
\hline
\rule{0pt}{2.5ex} \text{Alinta} \rule[-1ex]{0pt}{0pt} & 4 & 8 \\
\hline
\rule{0pt}{2.5ex} \text{Birrani} \rule[-1ex]{0pt}{0pt} & 0 & 10.5 \\
\hline
\end{array}

  1. By first fitting the line of best fit by eye on the scatterplot, estimate the average number of hours of sleep per day for a student who uses the phone for an average of 2 hours per day.  (2 marks)

    --- 2 WORK AREA LINES (style=lined) ---

Show Answers Only

a.


b.   \(\text{9 hours of sleep per day}\)

Show Worked Solution

a.


b.   \(\text{Using the line of best fit added to the diagram in part (a):}\)

\(\text{2 hours of phone use per day}\ \ \Rightarrow\ \ \text{9 hours of sleep per day}\)

Filed Under: Bivariate Data, Bivariate Data Analysis (Y12), S3 Further Statistical Analysis (Y12) Tagged With: Band 4, num-title-ct-coreb, num-title-qs-hsc, smc-1113-10-Line of Best Fit, smc-1113-20-Scatterplot from Table, smc-5022-10-Line of best fit graphs, smc-5022-20-Scatterplot from table, smc-6884-10-Lines of Best Fit, smc-6884-20-Scatterplot from Table

Probability, STD1 S2 2022 HSC 17

Each number from 1 to 30 is written on a separate card. The 30 cards are shuffled. A game is played where one of these cards is selected at random. Each card is equally likely to be selected.

Ezra is playing the game, and wins if the card selected shows an odd number between 20 and 30.

  1. List the numbers which would result in Ezra winning the game.   (1 mark)

    --- 1 WORK AREA LINES (style=lined) ---

  2. What is the probability that Ezra does NOT win the game?   (2 marks)

    --- 4 WORK AREA LINES (style=lined) ---

Show Answers Only

a.    `21, 23, 25, 27, 29`

b.    `Ptext{(not win)} = 5/6`

Show Worked Solution

a.    `21, 23, 25, 27, 29`
 

b.     `Ptext{(not win)}` `=1-Ptext{(win)}`
    `=1-5/30=25/30=5/6`


♦ Mean mark 51%.

Filed Under: Probability, Single and Multi-Stage Events, Single and Multi-Stage Events Tagged With: Band 3, Band 5, num-title-ct-core, num-title-qs-hsc, smc-1135-05-Simple Probability, smc-1135-30-\(P(\text{E})=1-P(\text{not E})\), smc-4225-15-Single-stage events, smc-4225-20-Complementary events, smc-6887-20-Simple Probability

Measurement, STD1 M5 2022 HSC 5 MC

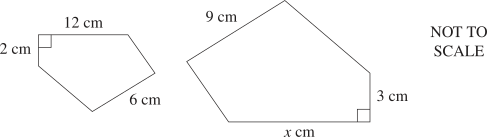
Two similar figures are shown.
 

What is the value of `x` ?

  1. 6
  2. 8
  3. 18
  4. 27
Show Answers Only

`C`

Show Worked Solution

`text{Scale factor}\ =3/2 =1.5`

`:.\ x = 1.5 xx 12 = 18`
  

`text{Alternate solution}`

`text{Using sides of similar figures in the same ratio:}`

`x/12` `=3/2`  
`x` `=12 xx (3/2)`  
`x` `=18`  

   
`=> C`

Filed Under: M5 Scale Drawings (Y12), Similarity Tagged With: Band 4, num-title-ct-corea, num-title-qs-hsc, smc-1105-30-Similarity, smc-4746-10-Scale factors, smc-4746-30-Other similar figures

Functions, EXT1 F2 2022 HSC 3 MC

Let `P(x)` be a polynomial of degree 5. When `P(x)` is divided by the polynomial `Q(x)`, the remainder is `2x+5`.

Which of the following is true about the degree of `Q`?

  1. The degree must be 1.
  2. The degree could be 1.
  3. The degree must be 2.
  4. The degree could be 2.
Show Answers Only

`D`

Show Worked Solution

`text{Given}\ P(x)\ text{has degree 5}`

`P(x) -: Q(x)\ text{has remainder}\ \ 2x+5`

`text{Consider examples to resolve possibilities:}`

`text{eg.}\ \ x^5+2x+5 -: x^3 = x^2+\ text{remainder}\ 2x+5`

`:.\ text{Degree must be 2 is incorrect}`

`Q(x)\ text{can have a degree of 2, 3 or 4}`

`=>D`


♦ Mean mark 51%.

Filed Under: Polynomials, Remainder and Factor Theorems, Remainder and Factor Theorems Tagged With: Band 5, num-title-ct-extension, num-title-qs-hsc, smc-1031-20-Remainder Theorem, smc-4242-20-Remainder Theorem, smc-6644-20-Remainder Theorem

Functions, 2ADV F1 2022 HSC 12

A student believes that the time it takes for an ice cube to melt (`M` minutes) varies inversely with the room temperature `(T^@ text{C})`. The student observes that at a room temperature of `15^@text{C}` it takes 12 minutes for an ice cube to melt.

  1. Find the equation relating `M` and `T`.   (2 marks)

    --- 2 WORK AREA LINES (style=lined) ---

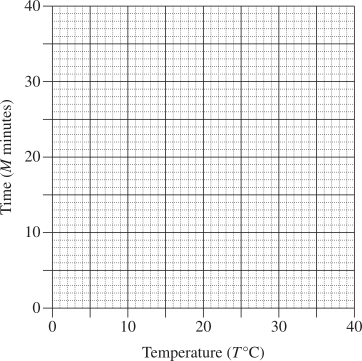
  2. By first completing this table of values, graph the relationship between temperature and time from `T=5^@C` to `T=30^@ text{C}`.   (2 marks)
     

\begin{array} {|c|c|c|c|}
\hline  \ \ T\ \  & \ \ 5\ \  & \ 15\  & \ 30\  \\
\hline M &  &  &  \\
\hline \end{array}


--- 0 WORK AREA LINES (style=lined) ---

Show Answers Only

a.    `M=180/T`

 b.    

\begin{array} {|c|c|c|c|}
\hline  \ \ T\ \  & \ \ 5\ \  & \ 15\  & \ 30\  \\
\hline M & 36 & 12 & 6 \\
\hline \end{array}       
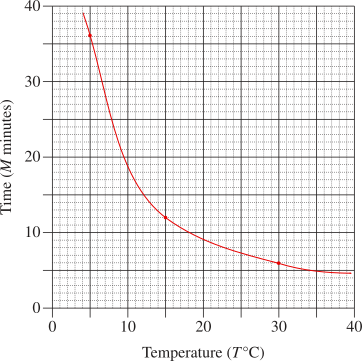
 

Show Worked Solution

a.    `M prop 1/T\ \ =>\ \ M=k/T`

`\text{Find}\ k:`

`12` `=k/15`  
`k` `=12 xx 15=180`  

 
`:.M=180/T`


♦ Mean mark (a) 49%.

b.   

\begin{array} {|c|c|c|c|}
\hline  \ \ T\ \  & \ \ 5\ \  & \ 15\  & \ 30\  \\
\hline M & 36 & 12 & 6 \\
\hline \end{array}

Filed Under: Direct and Inverse Variation, Further Functions and Relations, Variation and Rates of Change Tagged With: 2adv-std2-common, Band 4, Band 5, common-content, num-title-ct-patha, num-title-qs-hsc, smc-4239-30-a prop 1/b, smc-6383-30-\(\propto \dfrac{k}{x^{n}} \), smc-987-30-Reflections and Other Graphs, smc-987-60-Proportional

Algebra, STD2 A4 2022 HSC 24

A student believes that the time it takes for an ice cube to melt (`M` minutes) varies inversely with the room temperature `(T^@ text{C})`. The student observes that at a room temperature of `15^@text{C}` it takes 12 minutes for an ice cube to melt.

  1. Find the equation relating `M` and `T`.   (2 marks)

    --- 4 WORK AREA LINES (style=lined) ---

  2. By first completing this table of values, graph the relationship between temperature and time from `T=5^@C` to `T=30^@ text{C}`.   (2 marks)

\begin{array} {|l|c|c|c|}
\hline
\rule{0pt}{2.5ex} \ \ T\ \  \rule[-1ex]{0pt}{0pt} & \ \ \ 5\ \ \  & \ \ 15\ \ \  & \ \ \ 30\ \ \  \\
\hline
\rule{0pt}{2.5ex} \ \ M\ \ \rule[-1ex]{0pt}{0pt} & & & \\
\hline
\end{array}


--- 0 WORK AREA LINES (style=lined) ---

Show Answers Only

a.    `M prop 1/T \ \ =>\ \ M=k/T`

  `12` `=k/15`
  `k` `=15 xx 12=180`

 
`:.M=180/T`

b.   

\begin{array} {|l|c|c|c|}
\hline
\rule{0pt}{2.5ex} \ \ T\ \  \rule[-1ex]{0pt}{0pt} & \ \ \ 5\ \ \  & \ \ 15\ \ \  & \ \ 30\ \  \\
\hline
\rule{0pt}{2.5ex} \ \ M\ \ \rule[-1ex]{0pt}{0pt} & 36 & 12 & 6 \\
\hline
\end{array}


Show Worked Solution
a.     `M` `prop 1/T`
  `M` `=k/T`
  `12` `=k/15`
  `k` `=15 xx 12=180`

 
`:.M=180/T`


♦♦ Mean mark part (a) 29%.

b.   

\begin{array} {|l|c|c|c|}
\hline
\rule{0pt}{2.5ex} \ \ T\ \  \rule[-1ex]{0pt}{0pt} & \ \ \ 5\ \ \  & \ \ 15\ \ \  & \ \ 30\ \  \\
\hline
\rule{0pt}{2.5ex} \ \ M\ \ \rule[-1ex]{0pt}{0pt} & 36 & 12 & 6 \\
\hline
\end{array}


♦ Mean mark (b) 44%.

Filed Under: Circles and Hyperbola, Non-Linear: Inverse and Other Problems, Reciprocal Relationships Tagged With: 2adv-std2-common, Band 5, num-title-ct-pathc, num-title-qs-hsc, smc-4445-60-Hyperbola applications, smc-6923-10-\(\large y \propto \frac{1}{x}\), smc-6923-30-Draw Graph, smc-795-10-Inverse

Functions, 2ADV F1 2022 HSC 1 MC

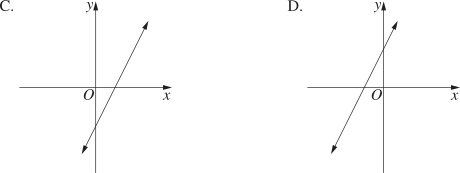
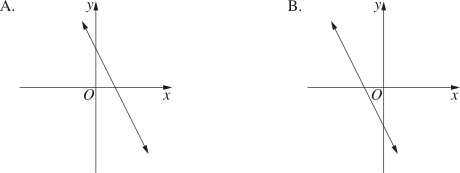
Which of the following could be the graph of  `y= -2 x+2`?
 

Show Answers Only

`A`

Show Worked Solution

`text{By elimination:}`

`y text{-intercept = 2  (Eliminate B and C)}`

`text{Gradient is negative  (Eliminate D)}`

`=>A`

Filed Under: Cartesian Plane, Linear Functions, Linear Functions Tagged With: 2adv-std2-common, Band 3, common-content, num-title-ct-pathb, num-title-qs-hsc, smc-4422-25-y-int gradient, smc-6214-02-Equation of Line, smc-6214-08-Intercepts, smc-6214-10-Sketch/Identify Graph, smc-985-30-Coordinate Geometry

Measurement, STD2 M1 2022 HSC 34

A composite solid is shown. The top section is a cylinder with a height of 3 cm and a diameter of 4 cm. The bottom section is a hemisphere with a diameter of 6 cm. The cylinder is centred on the flat surface of the hemisphere.
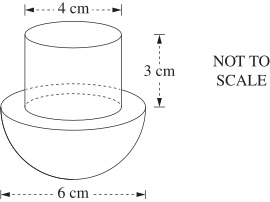


Find the total surface area of the composite solid in cm², correct to 1 decimal place.   (4 marks)

--- 8 WORK AREA LINES (style=lined) ---

Show Answers Only

`122.5\ text{cm}^2`

Show Worked Solution
`text{S.A. of Cylinder}` `=pir^2+2pirh`
  `=pi(2^2)+2pi(2)(3)=16pi\ text{cm}^2`

♦ Mean mark 50%.
`text{S.A. of Hemisphere}` `=1/2 xx 4pir^2=2pi(3^2)`
  `=18pi\ text{cm}^2`


`text{Area of Annulus}` `=piR^2-pir^2=pi(3^2)-pi(2^2)`
  `=5pi\ text{cm}^2`


`text{Total S.A.}` `=16pi+18pi+5pi=39pi`
  `=122.522…=122.5\ text{cm}^2\ \ text{(to 1 d.p.)}`


Filed Under: Area and Surface Area, Perimeter, Area and Volume, Surface Area Tagged With: Band 5, num-title-ct-pathb, num-title-qs-hsc, smc-4234-50-SA (sphere), smc-6484-20-Surface Area (Circular Measure), smc-798-25-Surface Area

Measurement, STD2 M1 2022 HSC 28

A dam is in the shape of a triangular prism which is 50 m long, as shown.

Both ends of the dam, `A B C` and `D E F`, are isosceles triangles with equal sides of length 25 metres. The included angles `B A C` and `E D F` are each `150^@`.
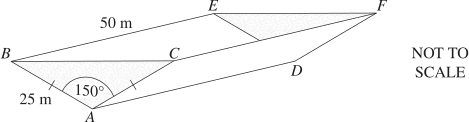


Calculate the number of litres of water the dam will hold when full.  (4 marks)

--- 8 WORK AREA LINES (style=lined) ---

Show Answers Only

`7\ 812\ 500\ text{L}`

Show Worked Solution

`V=Ah`

`text{Use sine rule to find}\ A:`

`A` `=1/2 ab\ sinC`  
  `=1/2 xx 25 xx 25 xx sin150^@`  
  `=156.25\ text{m}^2`  


`:.V` `=156.25 xx 50`  
  `=7812.5\ text{m}^3`  


`text{S}text{ince 1 m³ = 1000 litres:}`

`text{Dam capacity}` `=7812.5 xx 1000`  
  `=7\ 812\ 500\ text{L}`  

♦♦ Mean mark 33%.

Filed Under: Perimeter, Area and Volume, Volume Tagged With: Band 5, num-title-ct-corea, num-title-qs-hsc, smc-4235-10-Prisms, smc-4235-70-Sine rule (Area), smc-798-40-Volume, smc-798-60-Water Catchment

Measurement, STD2 M6 2022 HSC 26

The diagram shows two right-angled triangles, `ABC` and `ABD`,

where `AC=35 \ text{cm},BD=93 \ text{cm}, /_ACB=41^(@)` and `/_ADB=theta`.
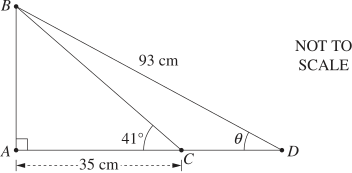


Calculate the size of angle `theta`, to the nearest minute.   (4 marks)

--- 8 WORK AREA LINES (style=lined) ---

Show Answers Only

`19^@6^{′}`

Show Worked Solution

`text{In}\ Delta ABC:`

`cos 41^@` `=35/(BC)`  
`BC` `=35/(cos 41^@)`  
  `=46.375…`  

 
`angle BCD = 180-41=139^@`
 

`text{Using sine rule in}\ Delta BCD:`

`sin theta/(46.375)` `=sin139^@/93`  
`sin theta` `=(sin 139^@ xx 46.375)/93`  
`:.theta` `=sin^(-1)((sin 139^@ xx 46.375)/93)`  
  `=19.09…`  
  `=19^@6^{′}\ \ text{(nearest minute)}`  

♦ Mean mark 50%.

Filed Under: Non Right-Angled Trig, Non-Right Angled Trig, Non-right-angled Trig Tagged With: Band 5, num-title-ct-pathc, num-title-qs-hsc, smc-4553-20-Sine Rule, smc-6929-20-Sine Rule, smc-6929-40-2-Triangle, smc-804-20-Sine Rule, smc-804-40-2-Triangle

Algebra, STD2 A4 2022 HSC 22

The formula  `C=100 n+b`  is used to calculate the cost of producing laptops, where `C` is the cost in dollars, `n` is the number of laptops produced and `b` is the fixed cost in dollars.

  1. Find the cost when 1943 laptops are produced and the fixed cost is $20 180.   (1 mark)

    --- 2 WORK AREA LINES (style=lined) ---

  2. Some laptops have some extra features added. The formula to calculate the production cost for these is
  3.      `C=100 n+a n+20\ 180`
  4. where `a` is the additional cost in dollars per laptop produced.
  5. Find the number of laptops produced if the additional cost is $26 per laptop and the total production cost is $97 040.   (2 marks)

    --- 4 WORK AREA LINES (style=lined) ---

Show Answers Only

a.    `$214\ 480`

b.    `610\ text{laptops}`

Show Worked Solution

a.   `text{Find}\ \ C\ \ text{given}\ \ n=1943 and b=20\ 180`

`C=100 xx 1943 + 20\ 180=$214\ 480`

b.   `text{Find}\ \ n\ \ text{given}\ \ C=97\ 040 and a=26`

`C` `=100 n+a n+20\ 180`  
`97\ 040` `=100n + 26n +20\ 180`  
`126n` `=76\ 860`  
`n` `=(76\ 860)/126=610 \ text{laptops}`  

Filed Under: Applications of Linear Relationships, Applications of Linear Relationships, Applications: Currency, Fuel and Other Problems, Linear Applications Tagged With: Band 2, Band 4, num-title-ct-coreb, num-title-qs-hsc, smc-6256-30-Other Linear Applications, smc-6513-30-Other Linear Applications, smc-793-30-Other Linear Applications

Financial Maths, STD2 F1 2022 HSC 21

A real estate agent's commission for selling houses is 2% for the first `$800\ 000` of the sale price and 1.5% for any amount over `$800\ 000`.

Calculate the commission earned in selling a house for `$1\ 500\ 000`.   (2 marks)

Show Answers Only

`$26\ 500`

Show Worked Solution
`text{Commission}` `=800\ 000 xx 2text{%} + (1\ 500\ 000-800\ 000) xx 1.5text{%}`  
  `=800\ 000 xx 0.02 + 700\ 000 xx 0.015`  
  `=16\ 000 + 10\ 500`  
  `=$26\ 500`  

Filed Under: Earning Money and Budgeting, Ways of Earning Tagged With: Band 3, num-title-ct-corea, num-title-qs-hsc, smc-4226-20-Commission, smc-6276-20-Commission, smc-810-20-Commission

Algebra, STD2 A2 2022 HSC 14 MC

Which of the following correctly expresses `x` as the subject of  `y=(ax-b)/(2)` ?

  1. `x=(2y+b)/(a)`
  2. `x=(y+b)/(2a)`
  3. `x=(2y)/(a)+b`
  4. `x=(y)/(2a)+b`
Show Answers Only

`A`

Show Worked Solution
`y` `=(ax-b)/(2)`  
`2y` `=ax-b`  
`ax` `=2y+b`  
`:.x` `=(2y+b)/a`  

 
`=>A`

Filed Under: Formula Rearrange, Formula Rearrange, Linear Tagged With: Band 4, num-title-ct-pathc, num-title-qs-hsc, smc-1200-10-Linear, smc-4362-20-Formula rearrange, smc-6236-10-Linear

Financial Maths, STD2 F4 2022 HSC 11 MC

In ten years, the future value of an investment will be $150 000. The interest rate is 4% per annum, compounded half-yearly.

Which equation will give the present value `(PV)` of the investment?

  1. `PV=(150\ 000)/((1+0.04)^(10))`
  2. `PV=(150\ 000)/((1+0.04)^(20))`
  3. `PV=(150\ 000)/((1+0.02)^(10))`
  4. `PV=(150\ 000)/((1+0.02)^(20))`
Show Answers Only

`D`

Show Worked Solution

`text{Compounding periods}\ = 10 xx 2 = 20`

`text{Compounding rate}\ = (4text{%})/2 = 2text{%} = 0.02`

`PV=(150\ 000)/((1+0.02)^(20))`

`=>D`

Filed Under: Compound Interest, Compound Interest and Shares, Investment Tagged With: Band 4, common-content, num-title-ct-coreb, num-title-qs-hsc, smc-6924-20-FV Formula, smc-817-20-FV Formula

Algebra, STD2 A4 2022 HSC 9 MC

An object is projected vertically into the air. Its height, `h` metres, above the ground after `t` seconds is given by  `h=-5 t^2+80 t`.
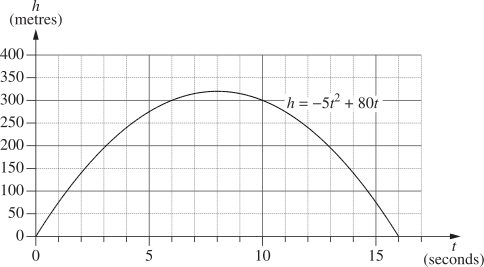
 

For how long is the object at a height of 300 metres or more above the ground?

  1. 4 seconds
  2. 6 seconds
  3. 8 seconds
  4. 10 seconds
Show Answers Only

`A`

Show Worked Solution

`text{Object reaches 300 m when}\ \ t=6\ text{seconds.}`

`text{Object drops back below 300 m when}\ \ t=10\ text{seconds.}`

`text{Time at 300 m or above}\ = 10-6=4\ text{seconds}`

`=>A`

Filed Under: Non-Linear: Exponential/Quadratics, Quadratic Relationships, Quadratics Tagged With: Band 3, num-title-ct-coreb, num-title-qs-hsc, smc-4443-60-Projectiles, smc-6922-20-Practical Problems, smc-830-20-Quadratics

Measurement, STD2 M6 2022 HSC 8 MC

Which true bearing is the same as `text{S} 48^@ text{W}`?
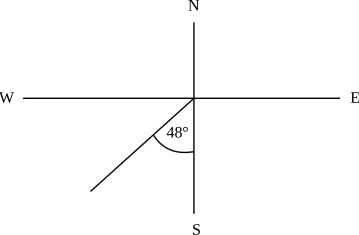
  1. `132^@`
  2. `222^@`
  3. `228^@`
  4. `312^@`
Show Answers Only

`C`

Show Worked Solution

`text{True bearing}=180 + 48=228^@`
   

`=>C`

Filed Under: Bearings and Radial Surveys, Bearings and Radial Surveys, Right-Angled Trig Tagged With: Band 4, common-content, num-title-ct-coreb, num-title-qs-hsc, smc-4552-70-Bearings, smc-6930-30-Compass vs True Bearings, smc-803-30-Compass vs True Bearings

Financial Maths, STD2 F1 2022 HSC 7 MC

Tian is paid $20.45 per hour, as well as a meal allowance of $16.20 per day.

What are Tian's total earnings if she works 9 hours per day for 5 days?

  1. $329.85
  2. $936.45
  3. $1001.25
  4. $1649.25
Show Answers Only

`C`

Show Worked Solution
`text{Earnings (5 days)}` `=5 xx [(9 xx 20.45) + 16.20]`  
  `=5 xx 200.25=$1001.25`  

 
`=>C`

Filed Under: Earning and Spending Money, Earning Money and Budgeting, Ways of Earning Tagged With: Band 3, num-title-ct-corea, num-title-qs-hsc, smc-4331-10-Wages, smc-6276-10-Wages/Salaries, smc-810-10-Wages

Functions, 2ADV F2 2021 HSC 19

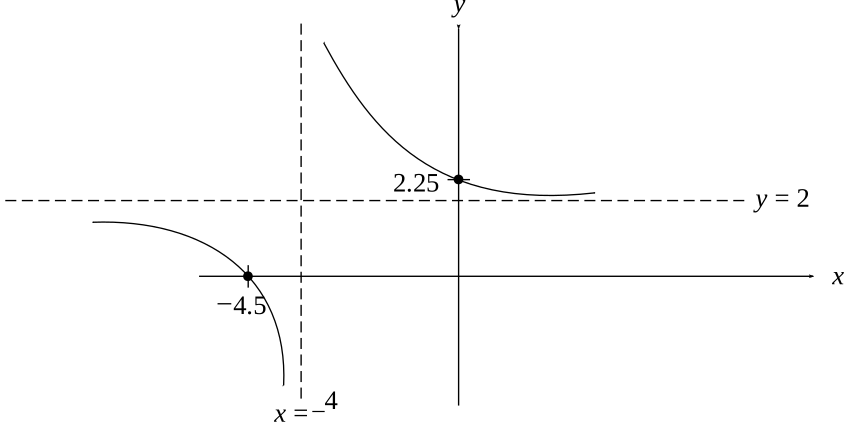
Without using calculus, sketch the graph of  `y = 2 + 1/(x + 4)`, showing the asymptotes and the `x` and `y` intercepts.  (3 marks)

--- 8 WORK AREA LINES (style=lined) ---
Show Answers Only

Show Worked Solution

`text(Asymptotes:)\ x = -4`

`text(As)\ \ x -> ∞, y -> 2`

`ytext(-intercept occurs when)\ \ x = 0:`

`y = 2.25`

`xtext(-intercept occurs when)\ \ y = 0:`

`2 + 1/(x + 4) = 0 \ => \ x = -4.5`
 

Filed Under: Circles and Hyperbola, Non-Calculus Graphing, Reciprocal Graphs Tagged With: Band 4, num-title-ct-pathc, num-title-qs-hsc, smc-1009-10-Quotient Function, smc-1009-40-Identify Asymptotes, smc-4445-30-Hyperbola, smc-6382-30-Sketch Graph

Functions, EXT1 F2 2021 HSC 3 MC

What is the remainder when  `P(x) = -x^3-2x^2-3x + 8`  is divided by  `x + 2`?

  1. `-14`
  2. `-2`
  3. `2`
  4. `14`
Show Answers Only

`D`

Show Worked Solution
`P(-2)` `= -(-2)^3-2(-2)^2-3(-2) + 8`
  `= 8-8 + 6 + 8`
  `= 14`

 
`=> D`

Filed Under: Polynomials, Remainder and Factor Theorems, Remainder and Factor Theorems Tagged With: Band 3, num-title-ct-patha, num-title-qs-hsc, smc-1031-20-Remainder Theorem, smc-4242-20-Remainder Theorem, smc-6644-20-Remainder Theorem

Measurement, STD1 M5 2021 HSC 26

The diagrams show two similar shapes. The dimensions of the small shape are enlarged by a scale factor of 1.5 to produce the large shape.
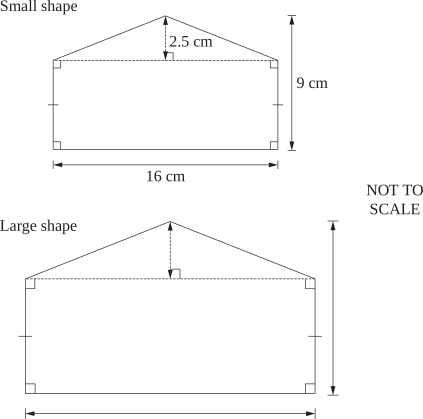


Calculate the area of the large shape.  (3 marks)

--- 5 WORK AREA LINES (style=lined) ---

Show Answers Only

`279\ text(cm)^2`

Show Worked Solution

`text(Dimension of larger shape:)`

♦♦ Mean mark 32%.

`text(Width) = 16 xx 1.5 = 24\ text(cm)`

`text(Height) = 9 xx 1.5 = 13.5\ text(cm)`

`text(Triangle height) = 2.5 xx 1.5 = 3.75\ text(cm)`

`:.\ text(Area)` `= 24 xx (13.5-3.75) + 1/2 xx 24 xx 3.75`
  `= 279\ text(cm)^2`

Filed Under: M5 Scale Drawings (Y12), Ratio and Scale, Similarity Tagged With: Band 5, num-title-ct-pathb, num-title-qs-hsc, smc-1105-30-Similarity, smc-1187-60-Similarity, smc-4746-30-Other similar figures, smc-4746-40-Areas and Volumes

Probability, STD1 S2 2021 HSC 20

In a bag, there are six playing cards, 2, 4, 6, 8, Queen and King. The Queen and King are known as picture cards.

Two of these cards are chosen randomly. All the possible outcomes are shown.



  1. What is the probability that the two cards chosen include one or both picture cards?   (1 mark)

    --- 2 WORK AREA LINES (style=lined) ---

  2. What is the probability that the two cards chosen do NOT include any picture cards?   (1 mark)

    --- 2 WORK AREA LINES (style=lined) ---

Show Answers Only
  1. `9/15=3/5`
  2. `6/15=2/5`
Show Worked Solution

a.   `P text{(at least 1 picture card)} = 9/15=3/5`


b.    `P text{(no picture card)}` `= 1-9/15`
    `= 6/15=2/5`

Filed Under: Probability, Single and Multi-Stage Events, Single and Multi-Stage Events Tagged With: Band 4, num-title-ct-core, num-title-qs-hsc, smc-1135-20-Other Multi-Stage Events, smc-1135-30-\(P(\text{E})=1-P(\text{not E})\), smc-4225-15-Single-stage events, smc-4225-20-Complementary events, smc-6887-50-Other Multi-stage Events

Statistics, STD1 S1 2021 HSC 2 MC

A survey of which of the following would provide data that are both categorical and nominal?

  1. Hair colour
  2. Height in centimetres
  3. Number of people present at a concert
  4. Size of coffee cup classified as small, medium or large
Show Answers Only

`A`

Show Worked Solution

`text(By elimination:)`

♦♦ Mean mark 25%.

`text{Qualitative (not quantitative)}`

`text{→ Eliminate B and C}`

`text(Nominal data is not ordered)`

`text{→ Eliminate D}`

`=> A`

Filed Under: Classifying Data, Classifying Data, Classifying Data, Data Classification, Investigation and Sampling Methods, Data Classification, Investigation and Sampling Methods Tagged With: Band 5, num-title-ct-core, num-title-qs-hsc, smc-1127-20-Classifying Data, smc-4223-30-Categorical data, smc-5075-10-Categorical, smc-6309-20-Data Classification, smc-6529-20-Data Classification, smc-820-20-Classifying Data

Networks, STD1 N1 2021 HSC 1 MC

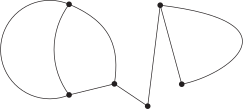
A network diagram is shown.
 

How many vertices are in this network?

  1. 5
  2. 6
  3. 7
  4. 8
Show Answers Only

`B`

Show Worked Solution

`text(Vertices = 6)`

`=> B`

Filed Under: Basic Concepts, Basic Concepts, Network Concepts Tagged With: Band 2, num-title-ct-path, num-title-qs-hsc, smc-1136-30-Definitions, smc-4788-10-Definitions

Measurement, STD2 M6 2021 HSC 32

A right-angled triangle  `XYZ`  is cut out from a semicircle with centre `O`. The length of the diameter  `XZ`  is 16 cm and  `angle YXZ`  = 30°, as shown on the diagram.
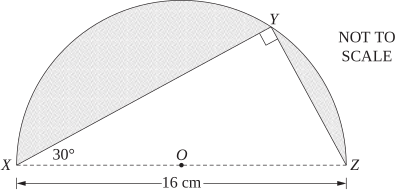


  1. Find the length of  `XY`  in centimetres, correct to two decimal places.   (2 marks)

    --- 4 WORK AREA LINES (style=lined) ---

  2. Hence, find the area of the shaded region in square centimetres, correct to one decimal place.   (3 marks)

    --- 6 WORK AREA LINES (style=lined) ---

Show Answers Only

a.    `13.86 \ text{cm}`

b.    `45.1 \ text{cm}^2`

Show Worked Solution


a.     `cos 30^@` `=(XY)/16`
  `XY` `= 16 \ cos 30^@`
    `= 13.8564`
    `= 13.86 \ text{cm (2 d.p.)}`


b.     `text{Area of semi-circle}` `= 1/2 times pi r^2`
    `= 1/2 pi times 8^2`
    `= 100.531 \ text{cm}^2`

♦ Mean mark part (b) 36%.
`text{Area of} \ Δ XYZ` `= 1/2 ab\ sin C`
  `= 1/2 xx 16 xx 13.856 xx sin 30^@`
  `= 55.42 \ text{cm}^2`


`:. \ text{Shaded Area}` `= 100.531-55.42`
  `= 45.111`
  `= 45.1 \ text{cm}^2 \ \ text{(1 d.p.)}`

Filed Under: Non Right-Angled Trig, Non-Right Angled Trig, Non-right-angled Trig Tagged With: 2adv-std2-common, Band 4, Band 5, num-title-ct-pathc, num-title-qs-hsc, smc-4553-30-Sine Rule (Area), smc-6929-30-Sine Rule (Area), smc-6929-60-X-topic with PAV, smc-804-30-Sine Rule (Area), smc-804-60-X-topic with PAV

Algebra, STD2 A4 2021 HSC 24

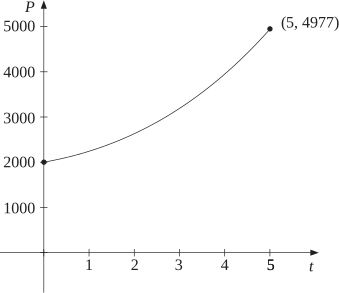
A population, `P`,  is to be modelled using the function  `P = 2000 (1.2)^t`, where `t` is the time in years.

  1. What is the initial population?   (1 mark)

    --- 2 WORK AREA LINES (style=lined) ---
  2. Find the population after 5 years.   (1 mark)

    --- 2 WORK AREA LINES (style=lined) ---

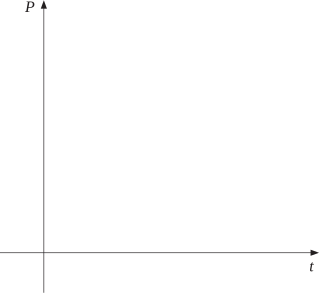
  3. On the axes below, draw the graph of the population against time, showing the points at  `t = 0`  and at  `t = 5`.   (2 marks)
      

    --- 0 WORK AREA LINES (style=lined) ---

Show Answers Only

a.    `2000`

b.    `4977`

c.    `text{See Worked Solutions}`

Show Worked Solution

a.    `text{Initial population occurs when}\ \  t = 0:`

`P= 2000 (1.2)^0= 2000`
 

b.    `text{Find} \ P \ text{when} \ \ t = 5: `

`P` `= 2000 (1.2)^5`
  `= 4976.64`
  `= 4977 \ text{(nearest whole)}`


♦ Mean mark (c) 48%.

c. 

Filed Under: Exponential Functions, Exponentials, Non-Linear: Exponential/Quadratics Tagged With: Band 3, Band 4, Band 5, num-title-ct-coreb, num-title-qs-hsc, smc-4444-40-Population, smc-6921-10-\(\large y=ka^{x}\), smc-6921-30-Draw Graphs, smc-830-30-Exponential

Measurement, STD2 M6 2021 HSC 14 MC

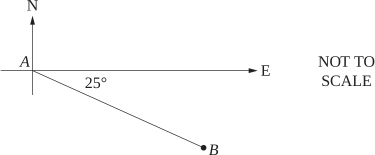
Consider the diagram below.


What is the true bearing of `A` from `B`?
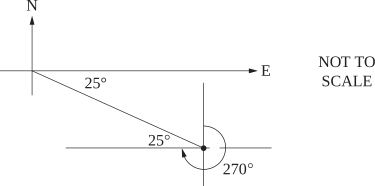
  1. `025^@`
  2. `065^@`
  3. `115^@`
  4. `295^@`
Show Answers Only

`D`

Show Worked Solution

♦♦ Mean mark 28%.

`\text{Bearing (A from B)}= 270 + 25= 295^@`

    
`=> D`

Filed Under: Bearings and Radial Surveys, Bearings and Radial Surveys, Right-Angled Trig Tagged With: Band 5, common-content, num-title-ct-extension, num-title-qs-hsc, smc-4552-70-Bearings, smc-6930-10-Bearings, smc-6930-30-Compass vs True Bearings, smc-803-10-Bearings, smc-803-30-Compass vs True Bearings

Measurement, STD2 M1 2021 HSC 16

The volume, `V`, of a sphere is given by the formula

`V = frac{4}{3} pi r^3,`

where `r` is the radius of the sphere.

A tank consists of the bottom half of a sphere of radius 2 metres, as shown.
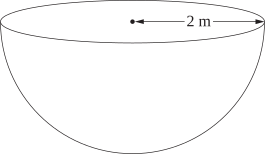
 

Find the volume of the tank in cubic metres, correct to one decimal place.   (2 marks)

Show Answers Only

`16.8\ text{m}^3`

Show Worked Solution
 `V` `= frac{1}{2} times frac{4}{3} pi r^3`
  `= frac{1}{2} times frac{4}{3} times pi times 2^3`
  `= 16.755…= 16.8\ text{m}^3\ \ text{(1 d.p.)}`

Filed Under: Perimeter, Area and Volume, Volume, Mass and Capacity, Volume, Mass and Capacity Tagged With: Band 4, num-title-ct-pathb, num-title-qs-hsc, smc-4235-60-Spheres, smc-6304-50-Volume (Circular Measure), smc-6521-50-Volume (Circular Measure), smc-798-50-Volume (Circular Measure)

Functions, 2ADV F1 2021 HSC 11

Solve  `x+(x-1)/2 = 9`.  (2 marks)

Show Answers Only

`19/3`

Show Worked Solution
`x+(x-1)/2` `=9`  
`2x + x-1` `=18`  
`3x` `=19`  
`x` `=19/3`  

Filed Under: Algebraic Fractions, Algebraic Techniques, Algebraic Techniques Tagged With: 2adv-std2-common, Band 3, common-content, num-title-ct-corea, num-title-qs-hsc, smc-4402-10-Single fraction, smc-6213-10-Algebraic Fractions, smc-983-40-Algebraic Fractions

Functions, 2ADV F1 2021 HSC 8 MC

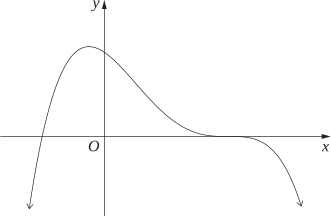
The graph of  `y = f(x)`  is shown.
 

Which of the following could be the equation of this graph?

  1. `y = (1 - x)(2 + x)^3`
  2. `y = (x + 1)(x - 2)^3`
  3. `y = (x + 1)(2 - x)^3`
  4. `y = (x - 1)(2 + x)^3`
Show Answers Only

`C`

Show Worked Solution

`text(By elimination:)`

`text(A single negative root occurs when)\ \ x =–1`

`->\ text(Eliminate A and D)`

`text(When)\ \ x = 0, \ y > 0`

`->\ text(Eliminate B)`

`=> C`

Filed Under: Quadratics and Cubic Functions, Quadratics and Cubic Functions Tagged With: Band 4, num-title-ct-patha, num-title-qs-hsc, smc-4242-30-Graphs, smc-6215-50-Cubics, smc-6215-70-Graphs, smc-984-20-Cubics, smc-984-30-Graphs

Algebra, STD2 A4 2021 HSC 10 MC

Which of the following best represents the graph of  `y = 10 (0.8)^x`?
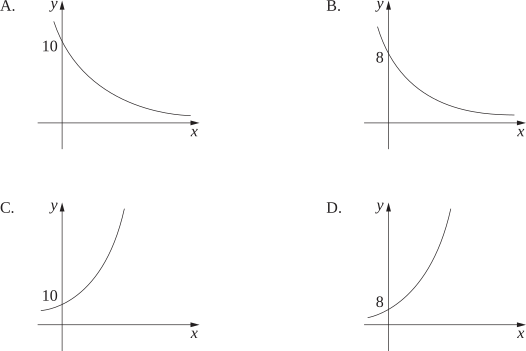
 

Show Answers Only

`A`

Show Worked Solution

`\text{By elimination:}`

♦ Mean mark 41%.

`\text{When} \ x = 0 \ , \ y = 10(0.8) ^0 = 10`

`-> \ text{Eliminate B and D}`

`text(As)\ \ x→oo, \ y→0`

`-> \ text{Eliminate C}`

`=> A`

Filed Under: Exponential Functions, Exponentials, Non-Linear: Exponential/Quadratics Tagged With: 2adv-std2-common, Band 5, common-content, num-title-ct-coreb, num-title-qs-hsc, smc-4444-10-Identify graphs, smc-6921-25-Identify Graphs, smc-830-10-Identify Graphs, smc-830-30-Exponential

Statistics, STD2 S1 2021 HSC 3 MC

The stem-and-leaf plot shows the number of goals scored by a team in each of ten netball games.
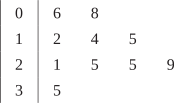
  

What is the mode of this dataset?

  1. 5
  2. 18
  3. 25
  4. 29
Show Answers Only

`C`

Show Worked Solution

`\text{Mode}  -> \text{data point with highest frequency}`

`\text{Mode}  = 25`

`=> C`

Filed Under: Bar Charts, Histograms and Other Graphs, Data Analysis, Displaying Data - Other Charts, Displaying Data - Other Charts, Other Charts Tagged With: Band 3, common-content, num-title-ct-core, num-title-qs-hsc, smc-1128-24-Stem and Leaf, smc-4224-15-Mode, smc-4224-40-Stem and Leaf, smc-6311-10-Stem-and-Leaf, smc-6531-10-Stem-and-Leaf, smc-822-20-Stem and Leaf

Financial Maths, STD2 F4 2021 HSC 26

Nina plans to invest $35 000 for 1 year. She is offered two different investment options.

Option A:  Interest is paid at 6% per annum compounded monthly.

Option B:  Interest is paid at `r` % per annum simple interest.

  1. Calculate the future value of Nina's investment after 1 year if she chooses Option A.   (2 marks)

    --- 4 WORK AREA LINES (style=lined) ---

  2. Find the value of `r` in Option B that would give Nina the same future value after 1 year as for Option A. Give your answer correct to two decimal places.   (2 marks)

    --- 4 WORK AREA LINES (style=lined) ---

Show Answers Only

a.    `$37\ 158.72`

b.    `6.17text(%)`

Show Worked Solution

a.    `r=(6\%)/12=0.5\%=0.005\ text(per month)`

`n=12`

`FV` `= PV(1 + r)^n`
  `= 35\ 000(1 + 0.005)^(12)`
  `= $37\ 158.72`

♦♦ Mean mark part (b) 36%.
b.     `I` `=Prn`
  `2158.72` `=35\ 000 xx r xx 1`
  `r` `=2158.72/(35\ 000)=0.06167…`
    `=6.17 text{% (to 2 d.p.)}`

Filed Under: Compound Interest, Compound Interest and Shares, Investment Tagged With: Band 4, Band 5, num-title-ct-coreb, num-title-qs-hsc, smc-4334-10-Find FV, smc-4334-40-Find r, smc-4334-50-Compound vs Simple, smc-6924-20-FV Formula, smc-6924-30-Interest Comparisons, smc-817-20-FV Formula, smc-817-30-i/r comparisons (incl. graphs)

Financial Maths, STD2 F1 2021 HSC 19

Adam purchased some office furniture five years ago. It depreciated by $2300 each year based on the straight-line method of depreciation. The salvage value of the furniture is now $7500.

Find the initial value of the office furniture.   (2 marks)

--- 4 WORK AREA LINES (style=lined) ---

Show Answers Only

`$19\ 000`

Show Worked Solution

`text{Find initial value}\ (V_0):`

`S` `=V_0-Dn`  
`7500` `=V_0-2300 xx 5`  
`V_0` `=7500 + 11\ 500`  
  `=$19\ 000`  

Filed Under: Depreciation, Depreciation, Depreciation, Simple Interest and S/L Depreciation, Simple Interest and S/L Depreciation Tagged With: Band 3, num-title-ct-coreb, num-title-qs-hsc, smc-1124-20-Straight-line Depreciation, smc-4335-60-Straight-line, smc-6845-10-Straight-line, smc-6925-10-Straight-line, smc-808-20-Straight Line Depreciation

Measurement, STD2 M1 2021 HSC 6 MC

Suppose  `a=b/7`, where  `b=22.`

What is the value of  `a`, correct to three significant figures?

  1. 3.14
  2. 3.15
  3. 3.142
  4. 3.143
Show Answers Only

`A`

Show Worked Solution

`a=b/7=22/7=3.1428…`

`3.1428 = 3.14\ text{(to 3 sig fig)}`

`=>  A`

Filed Under: Identify and Convert Between Units, Numbers of Any Magnitude, Units and Measurement Error Tagged With: Band 4, num-title-ct-corea, num-title-qs-hsc, smc-4232-50-Significant figures, smc-6303-50-Significant Figures, smc-797-30-Significant Figures

Financial Maths, STD2 F4 2021 HSC 4 MC

Three years ago an appliance was valued at $2467. Its value has depreciated by 15% each year, based on the declining-balance method.

What is the salvage value today, to the nearest dollar?

  1. $952
  2. $1110
  3. $1357
  4. $1515
Show Answers Only

`D`

Show Worked Solution
`S` `= V_0 (1-r)^n`
  `= 2467 (1-0.15)^3`
  `= 2467 (0.85)^3`
  `=1515.046…~~ $1515`

 
`=>  D`

Filed Under: Depreciation, Depreciation, Depreciation - Declining Balance Tagged With: Band 3, num-title-ct-coreb, num-title-qs-hsc, smc-4335-10-Find \(S\), smc-6925-20-Declining Balance, smc-813-10-Find \(S\)

Statistics, STD1 S1 2020 HSC 24

  1. The ages in years, of ten people at the local cinema last Saturday afternoon are shown.

\(38 \ \ 25 \ \ 38 \ \ 46 \ \ 55 \ \ 68 \ \ 72 \ \ 55 \ \ 36 \ \ 38\)

  1. The mean of this dataset is 47.1 years.
  2. How many of the ten people were aged between the mean age and the median age?   (2 marks)

    --- 4 WORK AREA LINES (style=lined) ---

  3. On Wednesday, ten people all aged 70 went to this same cinema.
  4. Would the standard deviation of the age dataset from Wednesday be larger than, smaller than or equal to the standard deviation of the age dataset given in part (a)? Briefly explain your answer without performing any calculations.   (2 marks)

    --- 5 WORK AREA LINES (style=lined) ---

Show Answers Only

a.     \(1\)

b.    \(\text{Standard deviation is a measure of how much the}\)

\(\text{ages of individuals differ from the mean age of the group.}\)
 

\(\therefore\ \text{Standard deviation of Wednesday’s group would be}\)

\(\text{less as the mean is 70 and everyone’s age is 70.}\)

Show Worked Solution

a.     \(\text{Reorder ages in ascending order:}\)

    \(25, 36, 38, 38, 38, 46, 55, 55, 68, 72\)

\(\text{Median} = \dfrac{\text{5th + 6th}}{2} = \dfrac{38 + 46}{2} = 42\)

\(\therefore\ \text{People with age between}\ 42-47.1 = 1\ \rightarrow\ (46)\)

♦ Mean mark (a) 39%.

 
b.
    \(\text{Standard deviation is a measure of spread, so how much the}\)

\(\text{ages of individuals differ from the mean age of the group.}\)
 

\(\therefore\ \text{Standard deviation of Wednesday’s group would be}\)

\(\text{less as the mean is 70 and everyone’s age is 70.}\)

♦♦♦ Mean mark (b) 20%.

Filed Under: Measures of Centre and Spread, Measures of Centre and Spread, Standard Deviation, Summary Statistics, Summary Statistics - No Graph Tagged With: Band 5, num-title-ct-corea, num-title-qs-hsc, smc-1131-10-Mean, smc-1131-50-Std Dev (by calc), smc-5020-50-Std Dev definition, smc-6312-10-Mean, smc-6312-50-Std Dev (by Calc), smc-6532-10-Mean, smc-6532-50-Std Dev (by Calc), smc-824-10-Mean, smc-824-50-Std Dev (by calc)

Measurement, STD1 M5 2020 HSC 28

Two similar right-angled triangles are shown.
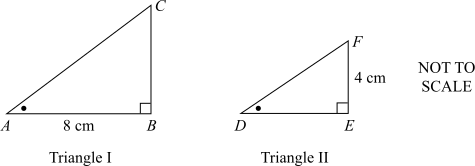


The length of side `AB` is 8 cm and the length of side `EF` is 4 cm.

The area of triangle `ABC` is 20 cm2.

Calculate the length in centimetres of side `DF` in Triangle II, correct to two decimal places.   (4 marks)

--- 8 WORK AREA LINES (style=lined) ---

Show Answers Only

`7.55\ \text{cm}`

Show Worked Solution

`text{Consider} \ Δ ABC :`

`text{Area}` `= frac{1}{2} xx AB xx BC`
`20` `= frac{1}{2} xx 8 xx BC`
`therefore \ BC` `= 5`


`text{Using Pythagoras in} \ Δ ABC :`

♦♦♦ Mean mark 11%.

`AC = sqrt(8^2 + 5^2) = sqrt89`


`text{S} text{ince} \ Δ ABC\ text{|||}\ Δ DEF,`

`frac{AC}{BC}` `= frac{DF}{EF}`
`frac{sqrt89}{5}` `= frac{DF}{4}`
`therefore \ DF` `= frac{4 sqrt89}{5}`
  `= 7.547 …`
  `= 7.55 \ text{cm (to 2 d.p.)}`

Filed Under: M5 Scale Drawings (Y12), Similarity Tagged With: Band 6, num-title-ct-pathb, num-title-qs-hsc, smc-1105-30-Similarity, smc-4746-20-Similar triangles, smc-4746-40-Areas and Volumes

Probability, STD1 S2 2020 HSC 26

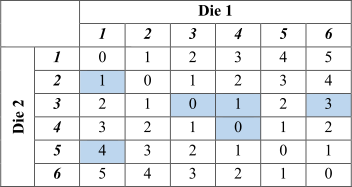
Barbara plays a game of chance, in which two unbiased six-sided dice are rolled. The score for the game is obtained by finding the difference between the two numbers rolled. For example, if Barbara rolls a 2 and a 5, the score is 3.

The table shows some of the scores.
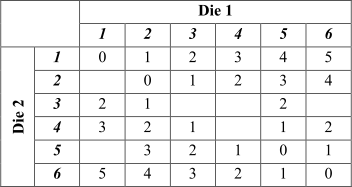


  1. Complete the six missing values in the table to show all possible scores for the game.   (1 mark)
  2. What is the probability that the score for a game is NOT 0?   (2 marks)

    --- 3 WORK AREA LINES (style=lined) ---

Show Answers Only

 a.

b.    `frac{5}{6}`

Show Worked Solution

a.     

♦ Mean mark part (b) 47%.
b.      `Ptext{(not zero)}` `= frac{text(numbers) ≠ 0}{text(total numbers)}`
    `= frac{30}{36}= frac{5}{6}`

 
\(\text{Alternate solution (b)}\)

b.      `Ptext{(not zero)}` `= 1-Ptext{(zero)}`
    `= 1-frac{6}{36}`
    `= frac{5}{6}`

Filed Under: Probability, Single and Multi-Stage Events, Single and Multi-Stage Events Tagged With: Band 4, Band 5, num-title-ct-core, num-title-qs-hsc, smc-1135-20-Other Multi-Stage Events, smc-1135-40-Arrays, smc-4225-20-Complementary events, smc-4225-45-Multi-stage events, smc-6887-50-Other Multi-stage Events, smc-6887-80-Arrays

Statistics, STD1 S3 2020 HSC 22

A group of students sat a test at the end of term. The number of lessons each student missed during the term and their score on the test are shown on the scatterplot.
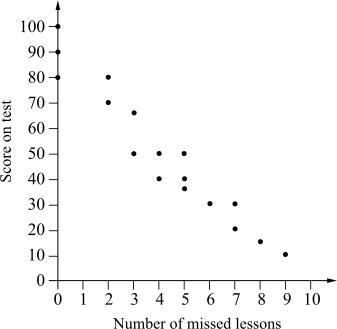


  1. Describe the strength and direction of the linear association observed in this dataset.   (2 marks)

    --- 5 WORK AREA LINES (style=lined) ---

  2. Calculate the range of the test scores for the students who missed no lessons.   (1 mark)

    --- 1 WORK AREA LINES (style=lined) ---

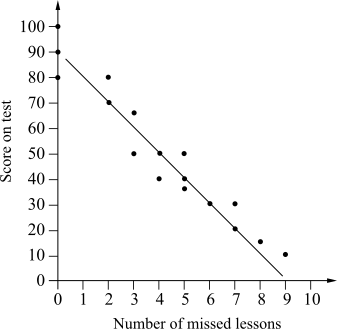
  3. Draw a line of the best fit in the scatterplot above.   (1 mark)
  4. Meg did not sit the test. She missed five lessons.


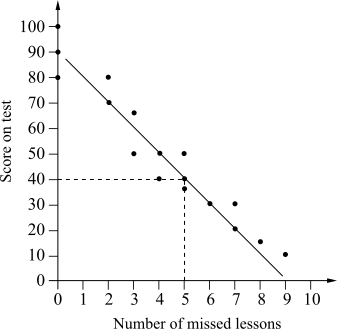
    Use the line of the best fit drawn in part (c) to estimate Meg's score on this test.   (1 mark)

    --- 1 WORK AREA LINES (style=lined) ---

  5. John also did not sit the test and he missed 16 lessons.


    Is it appropriate to use the line of the best fit to estimate his score on the test? Briefly explain your answer.   (1 mark)

    --- 2 WORK AREA LINES (style=lined) ---

Show Answers Only

a.    \(\text{Strength : strong}\)

\(\text{Direction : negative} \)

b.    \(\text{Range}\ = \text{high}-\text{low}\ = 100-80=20\)
 

c.   
d. 


e.    \(\text{John’s missed days are too extreme and the LOBF is not}\)

\(\text{appropriate. The model would estimate a negative score for}\)

\(\text{John which is impossible.}\)

Show Worked Solution

a.    \(\text{Strength : strong}\)

\(\text{Direction : negative} \)

♦ Mean mark (a) 45%.
♦♦ Mean mark (b) 31%.

b.    \(\text{Range}\ = \text{high}-\text{low}\ = 100-80=20\)
 

c.   

d. 


\(\therefore\ \text{Meg’s estimated score = 40}\)
 

e.    \(\text{John’s missed days are too extreme and the LOBF is not}\)

\(\text{appropriate. The model would estimate a negative score for}\)

\(\text{John which is impossible.}\)

♦ Mean mark (e) 38%.

Filed Under: Bivariate Data, Bivariate Data Analysis (Y12), S3 Further Statistical Analysis (Y12) Tagged With: Band 4, Band 5, num-title-ct-coreb, num-title-qs-hsc, smc-1113-10-Line of Best Fit, smc-1113-60-Limitations, smc-5022-10-Line of best fit graphs, smc-5022-25-Draw LOBF, smc-5022-30-Correlation, smc-5022-60-Limitations, smc-6884-10-Lines of Best Fit, smc-6884-30-Limitations

Algebra, STD1 A3 2020 HSC 19

Each year the number of fish in a pond is three times that of the year before.

  1. The table shows the number of fish in the pond for four years.
    \begin{array} {|l|c|c|c|c|}
    \hline
    \rule{0pt}{2.5ex}\textit{Year}\rule[-1ex]{0pt}{0pt} & \ \ \ 2020\ \ \  & \ \ \ 2021\ \ \  & \ \ \ 2022\ \ \  & \ \ \ 2023\ \ \ \\
    \hline
    \rule{0pt}{2.5ex}\textit{Number of fish}\rule[-1ex]{0pt}{0pt} & 100 & & & 2700\\
    \hline
    \end{array}

    Complete the table above showing the number of fish in 2021 and 2022.   (2 marks)
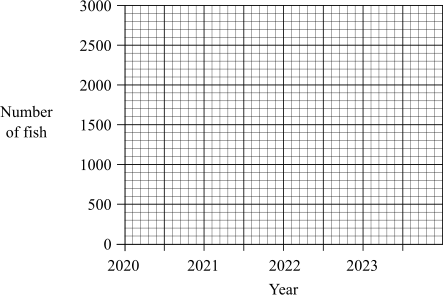
     

  2. Plot the points from the  table in part (a) on the grid.   (2 marks)
     
  3. Which model is more suitable for this dataset: linear or exponential? Briefly explain your answer.   (2 marks)

    --- 4 WORK AREA LINES (style=lined) ---

Show Answers Only

a.   

\begin{array} {|l|c|c|c|c|}
\hline
\rule{0pt}{2.5ex}\textit{Year}\rule[-1ex]{0pt}{0pt} & \ \ \ 2020\ \ \  & \ \ \ 2021\ \ \  & \ \ \ 2022\ \ \  & \ \ \ 2023\ \ \ \\
\hline
\rule{0pt}{2.5ex}\textit{Number of fish}\rule[-1ex]{0pt}{0pt} & 100 & 300 & 900 & 2700\\
\hline
\end{array}

b.   
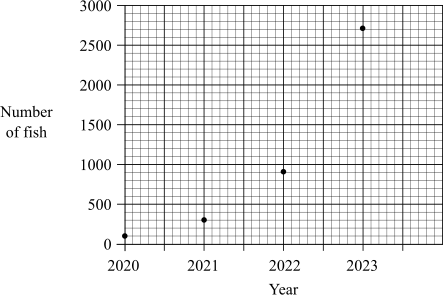
       

c.    \(\text{The more suitable model is exponential.}\)

\(\text{A linear dataset would graph a straight line which is}\)

\(\text{not the case here.}\)

\(\text{An exponential curve can be used to graph populations that }\)

\(\text{grow at an increasing rate, such as this example.}\)

Show Worked Solution

a.        

\begin{array} {|l|c|c|c|c|}
\hline
\rule{0pt}{2.5ex}\textit{Year}\rule[-1ex]{0pt}{0pt} & \ \ \ 2020\ \ \  & \ \ \ 2021\ \ \  & \ \ \ 2022\ \ \  & \ \ \ 2023\ \ \ \\
\hline
\rule{0pt}{2.5ex}\textit{Number of fish}\rule[-1ex]{0pt}{0pt} & 100 & 300 & 900 & 2700\\
\hline
\end{array}

b.  

c.    \(\text{The more suitable model is exponential.}\)

\(\text{A linear dataset would graph a straight line which is}\)

\(\text{not the case here.}\)

\(\text{An exponential curve can be used to graph populations that }\)

\(\text{grow at an increasing rate, such as this example.}\)

♦♦ Mean mark (c) 31%.

Filed Under: A3 Types of Relationships (Y12), Exponentials, Graphs of Practical Situations Tagged With: Band 3, Band 5, num-title-ct-coreb, num-title-qs-hsc, smc-1099-50-Non-linear graphs, smc-4444-40-Population, smc-6840-10-Non-linear Graphs

Statistics, STD1 S3 2020 HSC 4 MC

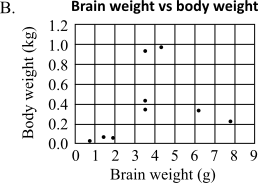
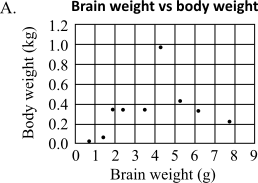
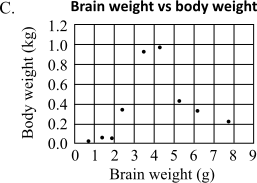
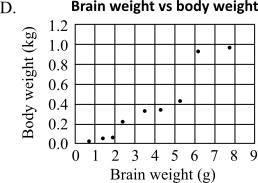
The table shows the average brain weight (in grams) and average body weight (in kilograms) of nine different mammals.

\begin{array} {|l|c|c|c|c|c|c|c|c|}
\hline
\rule{0pt}{2.5ex} \textit{Brain weight (g)} \rule[-1ex]{0pt}{0pt} & 0.7 & 1.4 & 1.9 & 2.4 & 3.5 & 4.3 & 5.3 & 6.2 & 7.8 \\
\hline
\rule{0pt}{2.5ex} \textit{Body weight (kg)} \rule[-1ex]{0pt}{0pt} & 0.02 &0.06 & 0.05 & 0.34 & 0.93 & 0.97 & 0.43 & 0.33 & 0.22 \\
\hline
\end{array}

Which of the following is the correct scatterplot for this dataset?


Show Answers Only

`C`

Show Worked Solution

`text{Consider data point} \ (1.9, 0.05)`

`→ \ text{Eliminate} \ A \ text{(too high)}`

`→ \ text{Eliminate} \ D \ text{(should be below 2nd data point)}`
 

`text{Consider data point} \ (2.4, 0.34)`

`→ \ text{Eliminate} \ B \ text{(not on graph)}` 

`=> \ C`

Filed Under: Bivariate Data, Bivariate Data Analysis (Y12), S3 Further Statistical Analysis (Y12) Tagged With: Band 4, num-title-ct-coreb, num-title-qs-hsc, smc-1113-20-Scatterplot from Table, smc-5022-20-Scatterplot from table, smc-6884-20-Scatterplot from Table

Networks, STD1 N1 2020 HSC 1 MC

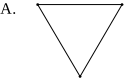
Which of the following networks has more vertices than edges?


Show Answers Only

`C`

Show Worked Solution

`text{Consider C:  Graph has 5 vertices and 4 edges.}`

`=> \ C`

Filed Under: Basic Concepts, Basic Concepts, Network Concepts Tagged With: Band 3, num-title-ct-path, num-title-qs-hsc, smc-1136-40-Degrees of Vertices, smc-4788-20-Degrees of vertices, smc-4788-20-Number of edges, smc-6526-50-Degree of Vertices, smc-6526-55-Number of Edges

Functions, EXT1 F2 2020 HSC 11a

Let  `P(x) = x^3 + 3x^2-13x + 6`.

  1. Show that  `P(2) = 0`.   (1 mark)

    --- 2 WORK AREA LINES (style=lined) ---

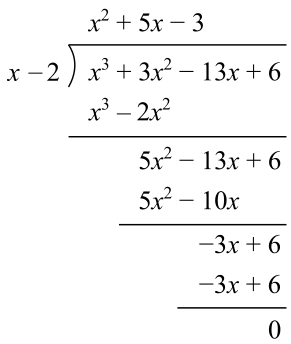
  2. Hence, factor the polynomial `P(x)` as `A(x)B(x)`, where `B(x)` is a quadratic polynomial.   (2 marks)

    --- 8 WORK AREA LINES (style=lined) ---

Show Answers Only
  1. `text(See Worked Solutions)`
  2. `P(x) = (x-2)(x^2 + 5x – 3)`
Show Worked Solution

i.    `P(2)= 8 + 12-26 + 6= 0`
 

ii.   

`:. P(x) = (x-2)(x^2 + 5x – 3)`

Filed Under: Polynomials, Remainder and Factor Theorems, Remainder and Factor Theorems Tagged With: Band 2, Band 3, num-title-ct-patha, num-title-qs-hsc, smc-1031-10-Factor Theorem, smc-4242-10-Factor Theorem, smc-4242-40-Long division, smc-6644-10-Factor Theorem

Measurement, STD2 M1 2020 HSC 25

A composite solid consists of a triangular prism which fits exactly on top of a cube, as shown.
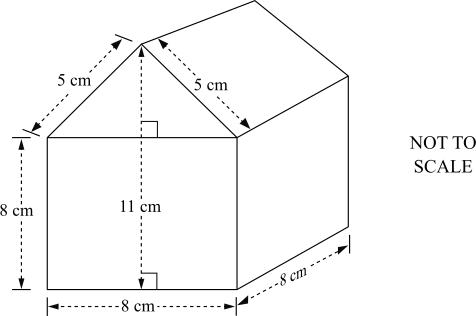
 

Find the surface area of the composite solid.   (3 marks)

--- 6 WORK AREA LINES (style=lined) ---

Show Answers Only

`424 \ text{cm}^2`

Show Worked Solution

`text{S.A. of 1 face of cube} = 8 xx 8 = 64 \ text{cm}^2`

`text{Height of triangle} = 11-8 = 3 \ text{cm}`

`therefore \ text{S.A. (triangular prism)}` `= 2 xx ( frac{1}{2} xx 8 xx 3 ) + 2 xx (5 xx 8)`
  `= 24 + 80= 104 \ text{cm}^2`

 
`therefore \ text{Total S.A.}= 5 xx 64 + 104= 424 \ text{cm}^2`

Filed Under: Area and Surface Area, Perimeter, Area and Volume, Surface Area, Surface Area Tagged With: Band 4, num-title-ct-corea, num-title-qs-hsc, smc-4234-40-SA (prisms), smc-6484-10-Surface Area (Composite Shapes), smc-6522-10-Surface Area (Composite Shapes), smc-798-25-Surface Area

Functions, 2ADV F1 2020 HSC 24

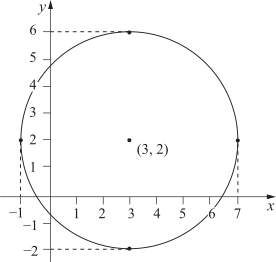
The circle of  `x^2-6x + y^2 + 4y-3 = 0`  is reflected in the `x`-axis.

Sketch the reflected circle, showing the coordinates of the centre and the radius.  (3 marks)

--- 8 WORK AREA LINES (style=lined) ---
Show Answers Only

Show Worked Solution
`x^2-6x + y^2 + 4y-3` `= 0`
`x^2-6x + 9 + y^2 + 4y + 4-16` `= 0`
`(x-3)^2 + (y + 2)^2` `= 16`

 
`=>\  text{Original circle has centre (3, − 2), radius = 4}`

`text(Reflect in)\ xtext(-axis):`

♦ Mean mark 48%.

`text{Centre (3, − 2) → (3, 2)}`
 

Filed Under: Circles and Hyperbola, Further Functions and Relations, Other Graph Transformations Tagged With: Band 5, num-title-ct-extension, num-title-ct-pathc, num-title-qs-hsc, smc-4445-28-Reflection, smc-6408-30-Reflections (only), smc-6408-80-Circles, smc-987-30-Reflections and Other Graphs, smc-987-50-Circles

Financial Maths, STD2 F4 2020 HSC 21

The inflation rate over the year from January 2019 to January 2020 was 2%.

The cost of a school jumper in January 2020 was $122.

Calculate the cost of the jumper in January 2019 assuming that the only change in the cost of the jumper was due to inflation.   (2 marks)

--- 5 WORK AREA LINES (style=lined) ---

Show Answers Only

`$119.61`

Show Worked Solution
`FV` `=PV(1+r)^n`
`122` `=C_(2019)(1+0.02)^1`
`C_2019 xx 1.02` `= 122`
`C_2019` `= frac(122)(1.02)= $119.61`

Filed Under: Compound Interest, Compound Interest and Shares, F2 Investment (Y12), Investment, Investment (Y12) Tagged With: Band 4, num-title-ct-coreb, num-title-qs-hsc, smc-1108-20-FV Formula, smc-4334-30-Find PV, smc-6831-20-FV Formula, smc-6924-20-FV Formula, smc-817-20-FV Formula

Financial Maths, STD2 F1 2020 HSC 20

The table shows the income tax rates for the 2019 – 2020 financial year.

\begin{array} {|l|l|}
\hline
\rule{0pt}{2.5ex}\textit{    Taxable income}\rule[-1ex]{0pt}{0pt} & \textit{    Tax payable}\\
\hline
\rule{0pt}{2.5ex}\text{\$0 – \$18 200}\rule[-1ex]{0pt}{0pt} & \text{Nil}\\
\hline
\rule{0pt}{2.5ex}\text{\$18 201 – \$37 000}\rule[-1ex]{0pt}{0pt} & \text{19 cents for each \$1 over \$18 200}\\
\hline
\rule{0pt}{2.5ex}\text{\$37 001 – \$90 000}\rule[-1ex]{0pt}{0pt} & \text{\$3572 plus 32.5 cents for each \$1 over \$37 000}\\
\hline
\rule{0pt}{2.5ex}\text{\$90 001 – \$180 000}\rule[-1ex]{0pt}{0pt} & \text{\$20 797 plus 37 cents for each \$1 over \$90 000}\\
\hline
\rule{0pt}{2.5ex}\text{\$180 001 and over}\rule[-1ex]{0pt}{0pt} & \text{\$54 097 plus 45 cents for each \$1 over \$180 000}\\
\hline
\end{array}

For the 2019 – 2020 financial year, Wally had a taxable income of `$122\ 680`. During the year, he paid `$3000` per month in Pay As You Go (PAYG) tax.

Calculate Wally's tax refund, ignoring the Medicare levy.   (3 marks)

--- 6 WORK AREA LINES (style=lined) ---

Show Answers Only

`$3111.40`

Show Worked Solution

`text(Tax paid)=12 xx 3000=$36\ 000`

`text(Tax payable on $122 680)`

`=20\ 797 + 0.37(122\ 680-90\ 000)`

`=20\ 797 + 0.37(32\ 680)=$32\ 888.60`

`:.\ text(Tax refund)=36\ 000-32\ 888.60=$3111.40` 
 

Filed Under: Earning and Spending Money, Tax and Percentage Increase/Decrease, Taxation Tagged With: Band 4, num-title-ct-corea, num-title-qs-hsc, smc-4226-30-Tax tables, smc-6277-10-Tax Tables, smc-831-10-Tax Tables

Algebra, STD2 A4 2020 HSC 19

A fence is to be built around the outside of a rectangular paddock. An internal fence is also to be built.

The side lengths of the paddock are `x` metres and `y` metres, as shown in the diagram.
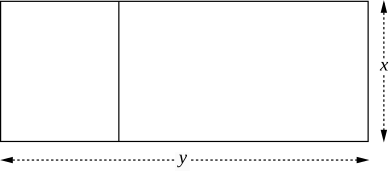
 

A total of 900 metres of fencing is to be used. Therefore  `3x + 2y = 900`.

The area, `A`, in square metres, of the rectangular paddock is given by  `A =450x - 1.5x^2`.

The graph of this equation is shown.
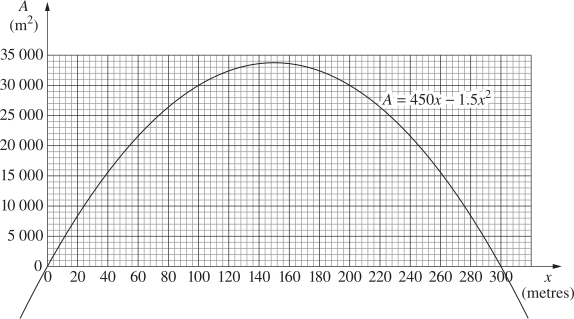
  

  1. If the area of the paddock is `30 \ 000\ text(m)^2`, what is the largest possible value of `x`?   (1 mark)

    --- 2 WORK AREA LINES (style=lined) ---

  2. Find the values of `x` and `y` so that the area of the paddock is as large as possible.   (2 marks)

    --- 4 WORK AREA LINES (style=lined) ---

  3. Using your value from part (b), find the largest possible area of the paddock.   (1 mark)

    --- 2 WORK AREA LINES (style=lined) ---

Show Answers Only

a.    `200 \ text(m)`

b.    `x = 150 \ text(m and) \ y = 225 \ text(m)`

c.    `33 \ 750 \ text(m)^2`

Show Worked Solution

a.    `text(From the graph, an area of)\ 30\ 000\ text(m)^2`

♦ Mean mark part (a) 39%.

`text(can have an)\ x text(-value of)\ \ x=100 or 200\ text(m.)`

`:. x_text(max) = 200 text(m)`
 

b.    `A_text(max) \ text(occurs when) \ \ x = 150`

♦♦ Mean mark part (b) 34%.

`text(Substitute)\ \ x=150\ \ text(into)\ \ 3x + 2y = 900:`

`3 xx 150 + 2y` `= 900`
`2y` `= 450`
`y` `= 225`

 
`therefore \ text(Maximum area when) \ \ x = 150 \ text(m  and) \ \ y = 225 \ text(m)`

♦ Mean mark part (c) 40%.
c.     `A_(max)` `= xy`
    `= 150 xx 225= 33 \ 750 \ text(m)^2`

Filed Under: Non-Linear: Exponential/Quadratics, Quadratic Relationships, Quadratics Tagged With: Band 5, num-title-ct-coreb, num-title-qs-hsc, smc-4443-70-Other applications, smc-6922-10-Find Vertex, smc-6922-20-Practical Problems, smc-830-20-Quadratics

Measurement, STD2 M6 2020 HSC 16

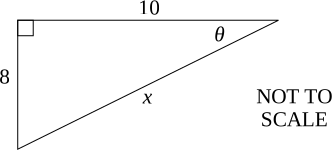
Consider the triangle shown.


  1. Find the value of `theta`, correct to the nearest degree.   (2 marks)

    --- 4 WORK AREA LINES (style=lined) ---

  2. Find the value of `x`, correct to one decimal place.   (2 marks)

    --- 4 WORK AREA LINES (style=lined) ---

Show Answers Only

a.    `39^@`

b.    `12.1 \ text{(to 1 d.p.)}`

Show Worked Solution
a.     `tan theta` `= frac{8}{10}`
  `theta` `= tan ^(-1) frac{8}{10}`
    `= 38.659…`
    `= 39^@ \ text{(nearest degree)}`


b.    `text{Using Pythagoras:}`

`x` `= sqrt{8^2 + 10^2}`
  `= 12.806…`
  `= 12.8 \ \ text{(to 1 d.p.)}`

Filed Under: Pythagoras and Right-Angled Trig, Pythagoras and Right-angled Trig, Right-Angled Trig Tagged With: Band 3, num-title-ct-corea, num-title-qs-hsc, smc-4552-30-tan, smc-6928-20-Right-Angled Trig, smc-802-20-Right-Angled Trig

Algebra, STD2 A2 2020 HSC 10 MC

A plumber charges a call-out fee of $90 as well as $2 per minute while working.

Suppose the plumber works for `t` hours.

Which equation expresses the amount the plumber charges ($`C`) as a function of time (`t` hours)?
  1. `C = 2 + 90t`
  2. `C = 90 + 2t`
  3. `C = 120 + 90t`
  4. `C = 90 + 120t`
Show Answers Only

`D`

Show Worked Solution

♦ Mean mark 42%.

`text(Hourly rate)\ = 60 xx 2=$120`

`:. C = 90 + 120t`

`=>D`

Filed Under: Applications of Linear Relationships, Applications: Currency, Fuel and Other Problems, Linear Applications Tagged With: Band 5, num-title-ct-coreb, num-title-qs-hsc, smc-6256-30-Other Linear Applications, smc-793-30-Other Linear Applications

  • « Previous Page
  • 1
  • 2
  • 3
  • 4
  • …
  • 8
  • Next Page »

Copyright © 2014–2026 SmarterEd.com.au · Log in